Numbers, Facts and Trends Shaping Your World
Read our research on:
Full Topic List

Regions & Countries
- Publications
- Our Methods
- Short Reads
- Tools & Resources
Read Our Research On:
What the data says about immigrants in the U.S.

The United States has long had more immigrants than any other country. In fact, the U.S. is home to one-fifth of the world’s international migrants . These immigrants come from just about every country in the world.
Pew Research Center regularly publishes research on U.S. immigrants . Based on this research, here are answers to some key questions about the U.S. immigrant population.
Pew Research Center conducted this analysis to answer common questions about immigration to the United States and the U.S. immigrant population.
Data for 2023 comes from Census Bureau tabulations of the 2023 American Community Survey . The remaining data in this analysis comes mainly from Center tabulations of Census Bureau microdata the American Community Surveys ( IPUMS ) and historical data from decennial censuses.
This analysis also features estimates of the size of the U.S. unauthorized immigrant population . The estimates presented in this research for 2022 are the Center’s latest. Estimates of annual changes in the foreign-born population are from the Current Population Survey for 1994-2023 and the American Community Surveys for 2001-2022 (IPUMS), with adjustments for changes in the bureau’s survey methodology over time.
How many people in the U.S. are immigrants?
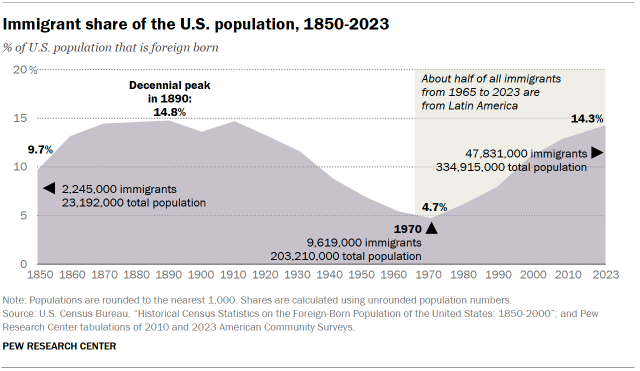
The U.S. foreign-born population reached a record 47.8 million in 2023, an increase of 1.6 million from the previous year. This is the largest annual increase in more than 20 years , since 2000.
In 1970, the number of immigrants living in the U.S. was about a fifth of what it is today. Growth of this population accelerated after Congress made changes to U.S. immigration laws in 1965.
Immigrants today account for 14.3% of the U.S. population, a roughly threefold increase from 4.7% in 1970. The immigrant share of the population today is the highest since 1910 but remains below the record 14.8% in 1890.
(Because only limited data from the 2023 American Community Survey has been released as of mid-September 2024, the rest of this post focuses on data from 2022.)
Where are U.S. immigrants from?
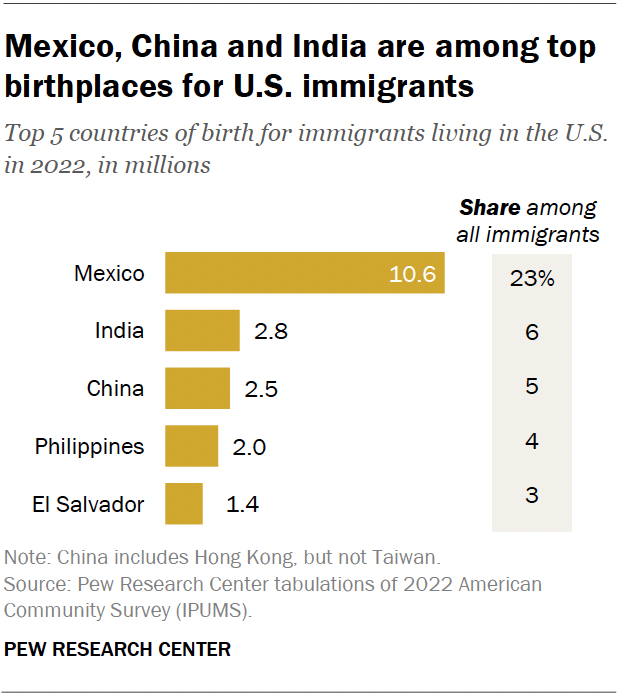
Mexico is the top country of birth for U.S. immigrants. In 2022, roughly 10.6 million immigrants living in the U.S. were born there, making up 23% of all U.S. immigrants. The next largest origin groups were those from India (6%), China (5%), the Philippines (4%) and El Salvador (3%).
By region of birth, immigrants from Asia accounted for 28% of all immigrants. Other regions make up smaller shares:
- Latin America (27%), excluding Mexico but including the Caribbean (10%), Central America (9%) and South America (9%)
- Europe, Canada and other North America (12%)
- Sub-Saharan Africa (5%)
- Middle East and North Africa (4%)
How have immigrants’ origin countries changed in recent decades?
Before 1965, U.S. immigration law favored immigrants from Northern and Western Europe and mostly barred immigration from Asia. The 1965 Immigration and Nationality Act opened up immigration from Asia and Latin America. The Immigration Act of 1990 further increased legal immigration and allowed immigrants from more countries to enter the U.S. legally.
Since 1965, about 72 million immigrants have come to the United States from different and more countries than their predecessors:
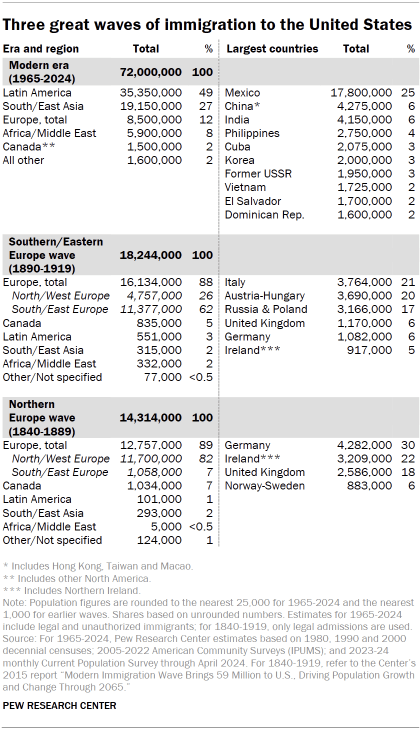
- From 1840 to 1889, about 90% of U.S. immigrants came from Europe, including about 70% from Germany, Ireland and the United Kingdom.
- Almost 90% of the immigrants who arrived from 1890 to 1919 came from Europe. Nearly 60% came from Italy, Austria-Hungary and Russia-Poland.
- Since 1965, about half of U.S. immigrants have come from Latin America, with about a quarter from Mexico alone. About another quarter have come from Asia. Large numbers have come from China, India, the Philippines, Central America and the Caribbean.
The newest wave of immigrants has dramatically changed states’ immigrant populations . In 1980, German immigrants were the largest group in 19 states, Canadian immigrants were the largest in 11 states and Mexicans were the largest in 10 states. By 2000, Mexicans were the largest group in 31 states.
Today, Mexico remains the largest origin country for U.S. immigrants. However, immigration from Mexico has slowed since 2007 and the Mexican-born population in the U.S. has dropped. The Mexican share of the U.S. immigrant population dropped from 29% in 2010 to 23% in 2022.
Where are recent immigrants coming from?
In 2022, Mexico was the top country of birth for immigrants who arrived in the last year, with about 150,000 people. India (about 145,000) and China (about 90,000) were the next largest sources of immigrants. Venezuela, Cuba, Brazil and Canada each had about 50,000 to 60,000 new immigrant arrivals.
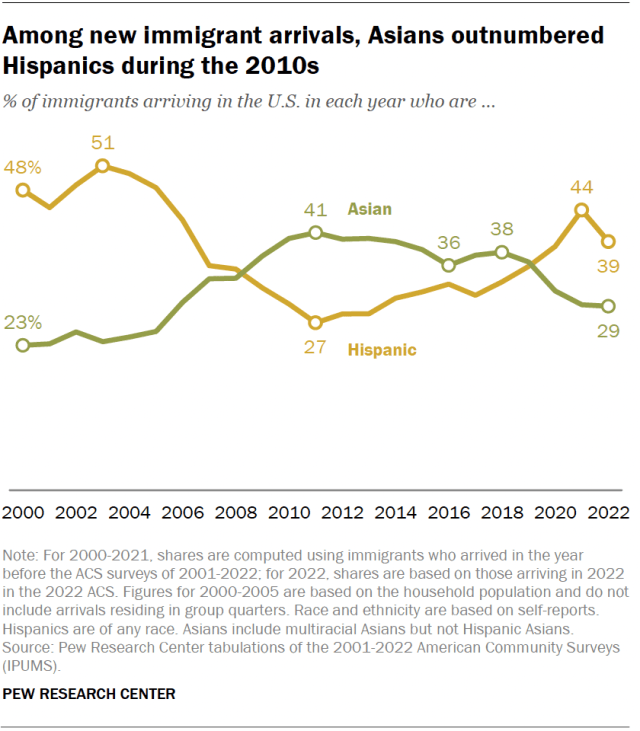
The main sources of immigrants have shifted twice in the 21st century. The first was caused by the Great Recession (2007-2009). Until 2007, more Hispanics than Asians arrived in the U.S. each year. From 2009 to 2018, the opposite was true.
Since 2019, immigration from Latin America – much of it unauthorized – has reversed the pattern again. More Hispanics than Asians have come each year.
What is the legal status of immigrants in the U.S.?
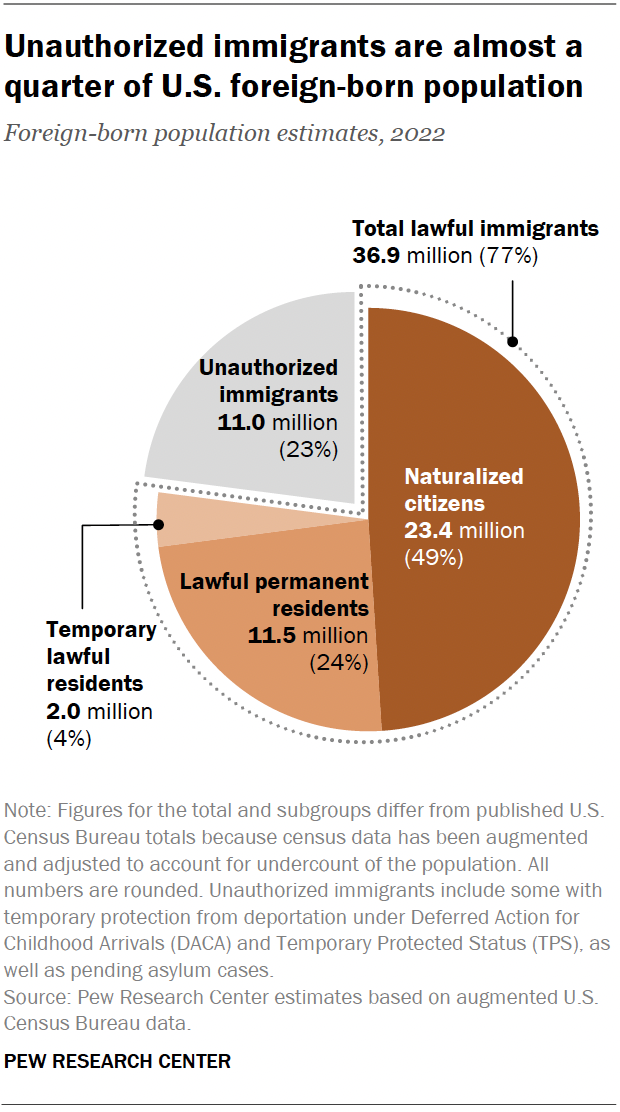
Most immigrants (77%) are in the country legally. As of 2022:
- 49% were naturalized U.S. citizens.
- 24% were lawful permanent residents.
- 4% were legal temporary residents.
- 23% were unauthorized immigrants .
From 1990 to 2007, the unauthorized immigrant population more than tripled in size, from 3.5 million to a record high of 12.2 million. From there, the number slowly declined to about 10.2 million in 2019.
In 2022, the number of unauthorized immigrants in the U.S. showed sustained growth for the first time since 2007, to 11.o million.
As of 2022, about 4 million unauthorized immigrants in the U.S. are Mexican. This is the largest number of any origin country, representing more than one-third of all unauthorized immigrants. However, the Mexican unauthorized immigrant population is down from a peak of almost 7 million in 2007, when Mexicans accounted for 57% of all unauthorized immigrants.
The drop in the number of unauthorized immigrants from Mexico has been partly offset by growth from other parts of the world, especially Asia and other parts of Latin America.
The 2022 estimates of the unauthorized immigrant population are our latest comprehensive estimates. Other partial data sources suggest continued growth in 2023 and 2024 .
Who are unauthorized immigrants?
Virtually all unauthorized immigrants living in the U.S. entered the country without legal permission or arrived on a nonpermanent visa and stayed after it expired.
A growing number of unauthorized immigrants have permission to live and work in the U.S. and are temporarily protected from deportation. In 2022, about 3 million unauthorized immigrants had these temporary legal protections. These immigrants fall into several groups:
- Temporary Protected Status (TPS): About 650,000 immigrants have TPS as of July 2022. TPS is offered to individuals who cannot safely return to their home country because of civil unrest, violence, natural disaster or other extraordinary and temporary conditions.
- Deferred Action for Childhood Arrivals program (DACA): Almost 600,000 immigrants are beneficiaries of DACA. This program allows individuals brought to the U.S. as children before 2007 to remain in the U.S.
- Asylum applicants: About 1.6 million immigrants have pending applications for asylum in the U.S. as of mid-2022 because of dangers faced in their home country. These immigrants can stay in the U.S. legally while they wait for a decision on their case.
- Other protections: Several hundred thousand individuals have applied for special visas to become lawful immigrants. These types of visas are offered to victims of trafficking and certain other criminal activities.
In addition, about 500,000 immigrants arrived in the U.S. by the end of 2023 under programs created for Ukrainians (U4U or Uniting for Ukraine ) and people from Cuba, Haiti, Nicaragua and Venezuela ( CHNV parole ). These immigrants mainly arrived too late to be counted in the 2022 estimates but may be included in future estimates.
Do all lawful immigrants choose to become U.S. citizens?
Immigrants who are lawful permanent residents can apply to become U.S. citizens if they meet certain requirements. In fiscal year 2022, almost 1 million lawful immigrants became U.S. citizens through naturalization . This is only slightly below record highs in 1996 and 2008.
Most immigrants eligible for naturalization apply for citizenship, but not all do. Top reasons for not applying include language and personal barriers, lack of interest and not being able to afford it, according to a 2015 Pew Research Center survey .
Where do most U.S. immigrants live?
In 2022, most of the nation’s 46.1 million immigrants lived in four states: California (10.4 million or 23% of the national total), Texas (5.2 million or 11%), Florida (4.8 million or 10%) and New York (4.5 million or 10%).
Most immigrants lived in the South (35%) and West (33%). Another 21% lived in the Northeast and 11% were in the Midwest.
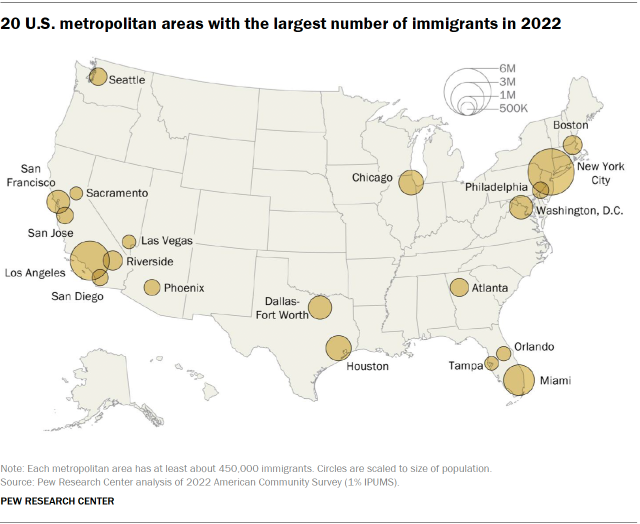
In 2022, more than 29 million immigrants – 63% of the nation’s foreign-born population – lived in just 20 major metropolitan areas. The largest populations were in the New York, Los Angeles and Miami metro areas. Most of the nation’s unauthorized immigrant population (60%) lived in these metro areas as well.
How many immigrants are working in the U.S.?
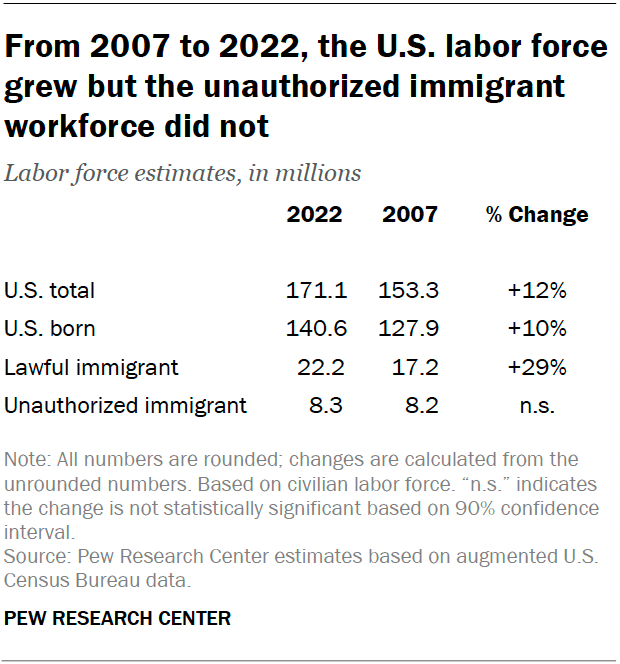
In 2022, over 30 million immigrants were in the U.S. workforce. Lawful immigrants made up the majority of the immigrant workforce, at 22.2 million. An additional 8.3 million immigrant workers are unauthorized. This is a notable increase over 2019 but about the same as in 2007 .
The share of workers who are immigrants increased slightly from 17% in 2007 to 18% in 2022. By contrast, the share of immigrant workers who are unauthorized declined from a peak of 5.4% in 2007 to 4.8% in 2022. Immigrants and their children are projected to add about 18 million people of working age between 2015 and 2035. This would offset an expected decline in the working-age population from retiring Baby Boomers.
How educated are immigrants compared with the U.S. population overall?
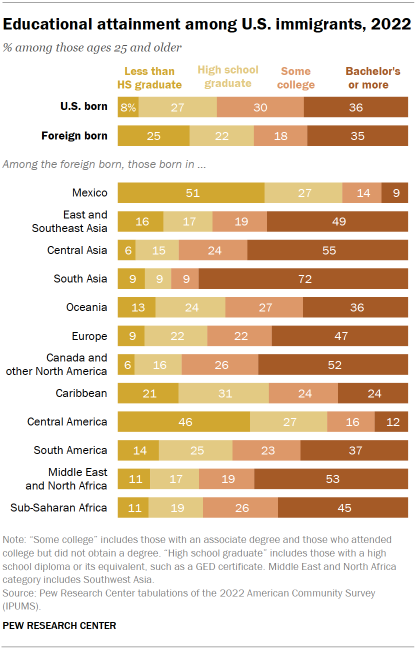
On average, U.S. immigrants have lower levels of education than the U.S.-born population. In 2022, immigrants ages 25 and older were about three times as likely as the U.S. born to have not completed high school (25% vs. 7%). However, immigrants were as likely as the U.S. born to have a bachelor’s degree or more (35% vs. 36%).
Immigrant educational attainment varies by origin. About half of immigrants from Mexico (51%) had not completed high school, and the same was true for 46% of those from Central America and 21% from the Caribbean. Immigrants from these three regions were also less likely than the U.S. born to have a bachelor’s degree or more.
On the other hand, immigrants from all other regions were about as likely as or more likely than the U.S. born to have at least a bachelor’s degree. Immigrants from South Asia (72%) were the most likely to have a bachelor’s degree or more.
How well do immigrants speak English?
About half of immigrants ages 5 and older (54%) are proficient English speakers – they either speak English very well (37%) or speak only English at home (17%).
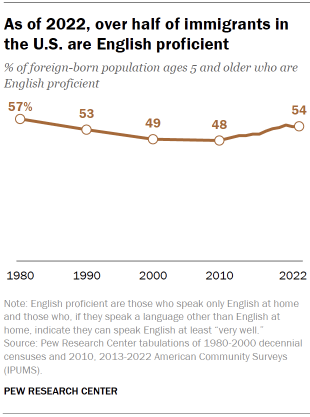
Immigrants from Canada (97%), Oceania (82%), sub-Saharan Africa (76%), Europe (75%) and South Asia (73%) have the highest rates of English proficiency.
Immigrants from Mexico (36%) and Central America (35%) have the lowest proficiency rates.
Immigrants who have lived in the U.S. longer are somewhat more likely to be English proficient. Some 45% of immigrants who have lived in the U.S. for five years or less are proficient, compared with 56% of immigrants who have lived in the U.S. for 20 years or more.
Spanish is the most commonly spoken language among U.S. immigrants. About four-in-ten immigrants (41%) speak Spanish at home. Besides Spanish, the top languages immigrants speak at home are English only (17%), Chinese (6%), Filipino/Tagalog (4%), French or Haitian Creole (3%), and Vietnamese (2%).
Note: This is an update of a post originally published May 3, 2017.
- Immigrant Populations
- Immigration & Migration
- Unauthorized Immigration

Mohamad Moslimani is a former research analyst focusing on race and ethnicity at Pew Research Center .

Jeffrey S. Passel is a senior demographer at Pew Research Center .

What we know about unauthorized immigrants living in the U.S.
Cultural issues and the 2024 election, latinos’ views on the migrant situation at the u.s.-mexico border, u.s. christians more likely than ‘nones’ to say situation at the border is a crisis, how americans view the situation at the u.s.-mexico border, its causes and consequences, most popular.
901 E St. NW, Suite 300 Washington, DC 20004 USA (+1) 202-419-4300 | Main (+1) 202-857-8562 | Fax (+1) 202-419-4372 | Media Inquiries
Research Topics
- Email Newsletters
ABOUT PEW RESEARCH CENTER Pew Research Center is a nonpartisan, nonadvocacy fact tank that informs the public about the issues, attitudes and trends shaping the world. It does not take policy positions. The Center conducts public opinion polling, demographic research, computational social science research and other data-driven research. Pew Research Center is a subsidiary of The Pew Charitable Trusts , its primary funder.
© 2024 Pew Research Center
An official website of the United States government
Official websites use .gov A .gov website belongs to an official government organization in the United States.
Secure .gov websites use HTTPS A lock ( Lock Locked padlock icon ) or https:// means you've safely connected to the .gov website. Share sensitive information only on official, secure websites.
- Publications
- Account settings
- Advanced Search
- Journal List

Immigration: analysis, trends and outlook on the global research activity
Matthias trost, eileen m wanke, daniela ohlendorf, doris klingelhöfer, markus braun, david a groneberg, david quarcoo, dörthe brüggmann.
- Author information
- Article notes
- Copyright and License information
Correspondence to: Matthias Trost Goethe University Frankfurt Institute of Occupational Medicine Social Medicine and Environmental Medicine Theodor-Stern Kai 7 60590 Frankfurt am Main Germany [email protected]
Issue date 2018 Jun.
This work is licensed under a Creative Commons Attribution 4.0 International License.
Immigration has a strong impact on the development of health systems, medicine and science worldwide. Therefore, this article provides a descriptive study on the overall research output.
Utilizing the scientific database Web of Science, data research was performed. The gathered bibliometric data was analyzed using the established platform NewQIS, a benchmarking system to visualize research quantity and quality indices.
Between 1900 and 2016 a total of 6763 articles on immigration were retrieved and analyzed. 86 different countries participated in the publications. Quantitatively the United States followed by Canada and Spain were prominent regarding the article numbers. On comparing by additionally taking the population size into account, Israel followed by Sweden and Norway showed the highest performance. The main releasing journals are the Public Health Reports, the Journal of Immigrant and Minority Health and Social Science & Medicine. Over the decades, an increasing number of Public, Environmental & Occupational Health articles can be recognized which finally forms the mainly used subject area.
Considerably increasing scientific work on immigration cannot only be explained by the general increase of scientific work but is also owed to the latest development with increased mobility, worldwide crises and the need of flight and migration. Especially countries with a good economic situation are highly affected by immigrants and prominent in their publication output on immigration, since the countries’ publication effort is connected with the appointed expenditures for research and development. Remarkable numbers of immigrants throughout Europe compel medical professionals to consider neglected diseases, requires the public health system to restructure itself and finally promotes science.
Immigration has become a vital topic throughout Europe and globally around the world. Effective modes of transportation make it easy to move people quickly around the globe to accept worldwide jobs and boost personal careers [ 1 ]. But also new media attracts with transnational information and creates fundamental networks [ 2 ]. Additionally conflicts, persecution, human rights violation, or inequality force people to leave their homes and families with the hope to improve their quality of life [ 1 ].
In 2015 the number of migrants grew up to 244 million persons worldwide. Mainly originating from middle-income countries nearly two thirds of all international migrants live in Europe and Asia followed by Northern America [ 1 ]. Likewise, the number of asylum-seekers was reaching an all-time high with around 2.0 million submitted applications in 2015. 54% of the worldwide refugee population are originating from three countries: the Syrian Arab Republic, Afghanistan and Somalia with the main destinations in Germany, the United States and Sweden [ 3 ].
The general health of immigrants and refugees is commonly described as equal to the health of the population in the host country. Even sometimes a ‘healthy-immigrant effect’ is noticed which constitutes that ie, chronic conditions are even fewer in the immigrant group [ 4 – 6 ]. But during the period of acculturation a limited access to local health care systems, including individual and public health services, has a severe impact on the health of immigrants and finally on the health of the nation [ 7 ].
As frequently, immigrants do not hold any health insurance coverage, health care services need to be accessible regardless of financial or physical factors. But against the presumption that immigrants use emergency departments more often for routine consultations, this group is actually counted with less emergency department or physician’s consultations [ 8 , 9 ]. Looking at the costs of medical care from a public health perspective, given by an overall good health, the younger age and a fewer utilization of the health care system the health care expenses of immigrants are inferior compared to the native-born population [ 10 ].
Even health care professionals experience difficulties in the context of providing health care and public health to immigrants [ 11 ]. Language barriers, a different understanding of illness and treatment as well as cultural differences with a lack of trust or an inconsistent medical history are part of those complications. Besides this, traumatic experiences leading to psychological issues need to be addressed [ 11 ]. Health care professionals not only need to be aware of rare diseases but also need to address the different groups of immigrants to meet their specific health needs [ 12 ]. Immigrants or refugees are susceptible to communicable diseases and can be either the epidemiological originator or adversely affected by a public health emergency. Clear International Health Regulations (IHR) are necessary to provide a comprehensive coverage of infectious diseases [ 13 ].
Furthermore, neglected diseases like tuberculosis or parasitic infections may emerge, need to be taken into consideration and may form a major public health concern [ 14 ]. After previously declining numbers of tuberculosis during the past, as a result of the demographic development and elevated numbers of immigrants, a significant increase of tuberculosis cases was recognized in various immigration countries in 2015 [ 15 ]. The tuberculosis risk among immigrants is increased for several years after migrating to a low-prevalence country [ 16 , 17 ]. This implies a growing challenge for the global control of tuberculosis [ 18 ].
Despite numerous studies about several immigration areas can be found, there is no thorough scientometric analysis available. Scientometric studies are an integral part of research evaluation, deliver objective data for budget or funding decisions and provide a vital evidence for an impartial quality assessment [ 19 ]. This study maps an overview of the international research activity on immigration. It investigates variations and propensities of scientific development and it illustrates priorities, requirements and opportunities of research.
Although the current refugee movement in Europe requires particular attention, the study was not confined to the peculiar issue of refugees or asylum seekers but was planned to observe the spectrum of immigration as a whole over the last decades and centuries.
Immigration is increasingly important and as one of the most dynamic group immigrants can advance their host country by offering cultural diversity or by leading new pathways in science, medicine and technology [ 1 ]. The health of immigrants is a major part to well-being. It enables to work, helps building social networks and promotes integration, whereas on the other hand side integration ultimately leads to better health outcomes [ 20 ].
Specific benchmarking systems are being used to evaluate the increasing scientific publication output. Therefore, the New Quality and Quantity Indices in Science (NewQIS) platform provides tools for objective scientific evaluation and visualization [ 21 ]. Scientific output, semi-qualitative indices and quantities of research activity in particular areas of science can be evaluated and transparently compared considering specific scientometric parameters within a distinct time period.
Data source
The database Web of Science Core Collection (WoS) was used to capture the bibliometric information of the listed articles on immigration. As an international, multidisciplinary tool it offers access to literature of biomedicine and other disciplines [ 22 ].
Search and data processing
In the scientific world, the word ‘migration’ is being used with several meanings. To secure a clear differentiation conclusively the search term ‘immigra*’ was selected to perform a title search on biomedical categories of the WoS Core Collection without any chronological restriction. The data was captured in September 2016.
Evaluation criteria
The number of specific publications was analyzed including the publication year, the country of origin and national or international collaborations. Additionally, journals, articles and subject areas, the publication language as well as the authors and their particular institution were taken into account. Furthermore, the total number of citations, the citation rate [ 23 ], and the modified country- and issue-specific h-index [ 24 ] were evaluated to assess the awareness of the scientific community. To rectify a possible bias of the low publishing countries, only countries with a threshold of at least 30 articles were taken into consideration while assessing the citation rates.
On additionally considering socioeconomic factors ie, the size of the population and the GDP a further interpretation regarding a countries’ performance is possible. Equally to the citation rates, a minimum of at least 30 articles per country was determined to prevent a distortion of the outcomes.
The h-index is defined by the number n of published articles of an author that have been cited at least n-times each [ 24 ]. In this study, it has been applied in a modified way, meaning that it is adapted to countries and only includes the evaluated articles.
Visualization of findings
Utilizing the density equalizing mapping projection (DEMP) [ 25 ], a two-dimensional cartographic image with variable proportions can be designed. By scaling the country size adjusted to specific parameters, this technique facilitates a swift overview of the gathered results.
General parameters
The search delivered a total number of 6763 articles (n). The chronological distribution shows eminent article numbers (n ~ 100/y) in the first years of the 20th century. These articles mainly originate from Public Health Reports . The first case report was published in 1902. In 1999, the limit of 100 articles per year was approached. After multiplying the scientific output on immigration an all-time high with n = 461 and n = 460 publications per year was reached in 2012 and 2015 ( Figure 1 , panel A ).
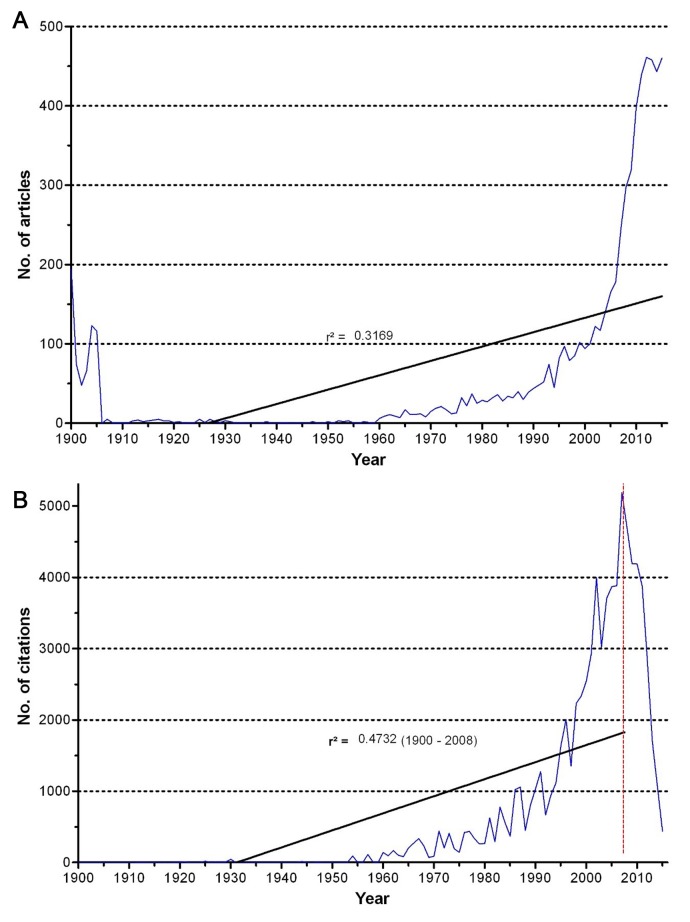
A. Chronological development of the total number of publications on immigration, r 2 = coefficient of determination. B. Chronological development of the total number of received citations for articles on immigration, r 2 = coefficient of determination, dashed line = assumed beginning of the cited half-life effect.
In 1957, first more than a hundred articles on immigration were cited (c = 157) exceeding the limit of one thousand citations first in 1986 (c = 1020). After an excessive increase, the maximum of 5186 citations is seen in 2007. The linear regression of the number of articles over the years showed a coefficient of determination of r 2 = 0.3169 and respectively for the number of citations of r 2 = 0.4732 ( Figure 1 , panel B ).
Regarding the top 10 articles on immigration by the number of received citations seven articles are originating from the USA, two articles are from Canada and the most cited article on immigration is published from Japan. The publications were released between 1983 and 2008 and cover several immigration specific topics. A reasonable part of those papers is facing the acculturation and observed health changes after immigration. Apart from cancer, health behaviors and mortality comparisons furthermore obesity, mental disorders or infections are being discussed ( Table 1 ).
Top 10 articles on immigration by number of received citations
Country specific analysis
The identified publications originate from 86 different countries. With a total of n = 2629 articles (38%) the USA reflect around quadruple of the number of articles published in Canada (n = 664, 10%) followed by Spain (n = 454, 7%), Sweden (n = 350, 5%) and Israel (n = 344, 5%) ( Figure 2 ).
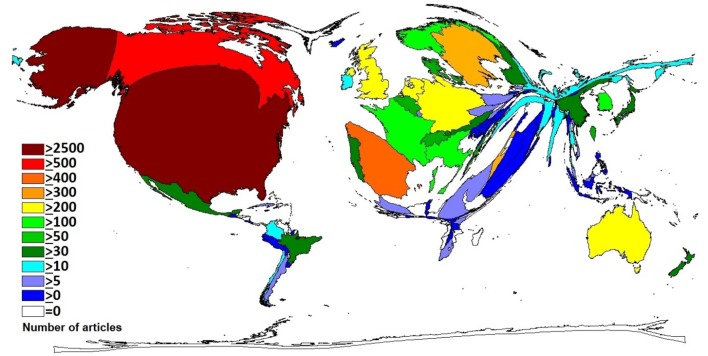
Publishing countries on immigration. DEMP illustrating the number of publications by country.
Setting these outcomes in relation to the size of the particular population of each country results in a different picture (i = publications/inhabitants in million). In this scenario, Israel (i = 42.7) plays the leading role followed by Sweden (i = 35.7), Norway (i = 24.8), Canada (i = 18.9) and Denmark (i = 17.6). The United States (i = 8.2) appear on position ten ( Figure 3 , panel A ).
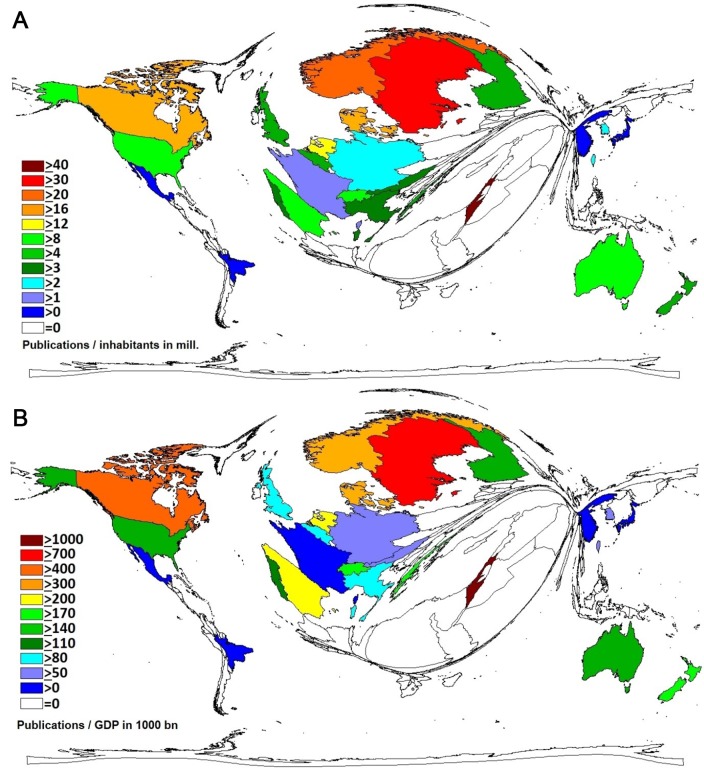
A. Countries publishing on immigration by number of publications in relation to the population size in million, threshold: 30 articles per country. B. Most publishing countries on immigration by the ratio of publications/GDP in 1000 billion US$, threshold: 30 articles per country.
Reviewing the publication numbers in correlation to the Gross Domestic Product (GDP) in billion (g = publications/GDP in 1000 bn. USD) Israel (g = 1220.3) and Sweden (g = 739.3) are still prominent followed by Canada (g = 406.9), Denmark (g = 378.8) and Norway (g = 362.2). The United States (g = 146.5) appear on position 13 ( Figure 3 , panel B ).
Observing the modified h-index, the United States take the lead again (h = 76). Canada takes the second place (h = 42) and the United Kingdom is on position three (h = 41) followed by Sweden (h = 34) and the Netherlands (h = 33).
Regarding the received citations (c) by country, the order of the top countries is: USA (c = 37 742), Canada (c = 9029), United Kingdom (c = 5766), Sweden (c = 4738), Netherlands (c = 3942).
Analyzing the citation rate (cr), Japan (cr = 29.3) is taking the lead. The United Kingdom (cr = 20.0) and Finland (cr = 19.4) appear on position two and three followed by the Netherlands (cr = 18.6) and Australia (cr = 16.2). The United States (cr = 14.4) and Canada (cr = 13.6) flag up on positions six and seven directly followed by Sweden (cr = 13.5) ( Figure 4 ).
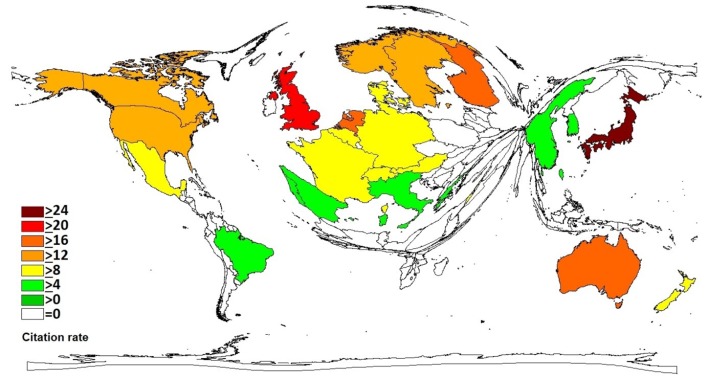
Citation rate for articles on immigration, threshold: 30 articles per country.
International collaborations
Observing the scientific partnerships, an interlinked, international network with multi-layered collaborations over national borders can be ascertained.
The highest numbers of direct collaborations between countries were found between the United States and Canada working together on n = 56 papers and the United States together with South Korea counting n = 54 joint publications. The United States and Sweden count n = 49 collaborative papers and Sweden counts in collaboration with Germany n = 33 joint articles. The United States together with Mexico count n = 31 collaborative publications ( Figure 5 ).
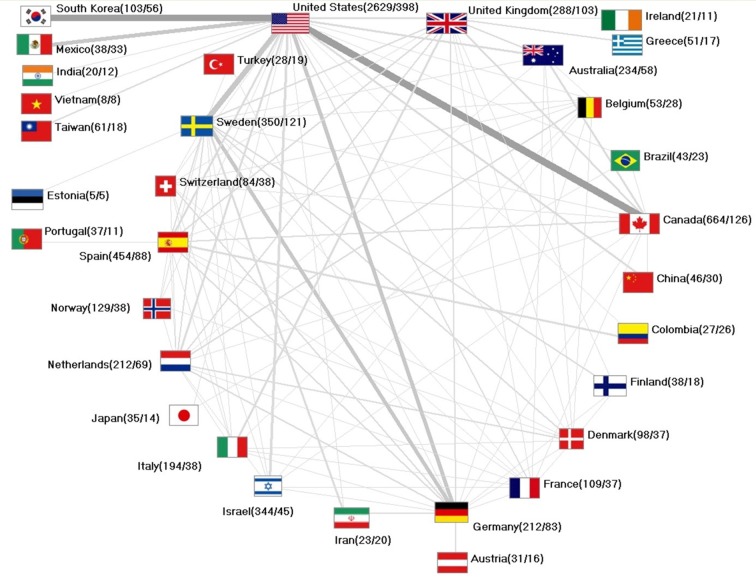
International collaborations. Numbers in brackets: (total number of articles/total number of articles in collaboration).
The United States publish 15% of articles in cooperation. Canada shows 19% of collaborative papers while Sweden represents 35% followed by Germany (39%), South Korea (54%) and Mexico (87%).
Journals and subject areas
The highest number of immigration papers was published by Public Health Reports (n = 638, c = 121). The Journal of Immigrant and Minority Health has issued n = 335 papers receiving c = 1671 citations. Social Science & Medicine published n = 143 articles and received the highest total amount of citations with c = 4078, whereas the American Journal of Public Health received c = 3016 citations with n = 85 articles and the Hispanic Journal of Behavioral Sciences gains c = 1288 citations with n = 83 papers ( Table 2 ).
The 15 most cited journals publishing on immigration
The vast majority of research was found under the subject area Public, Environmental & Occupational Health (n = 2564). These articles additionally show the highest citation numbers (c = 23 906). Number two and three form Psychology (n = 1065, c = 11 425) and Psychiatry (n = 688, c = 12 059) followed by General & Internal Medicine (n = 579, c = 8638) and Nursing (n = 334, c = 2410) ( Figure 6 , panel A ).
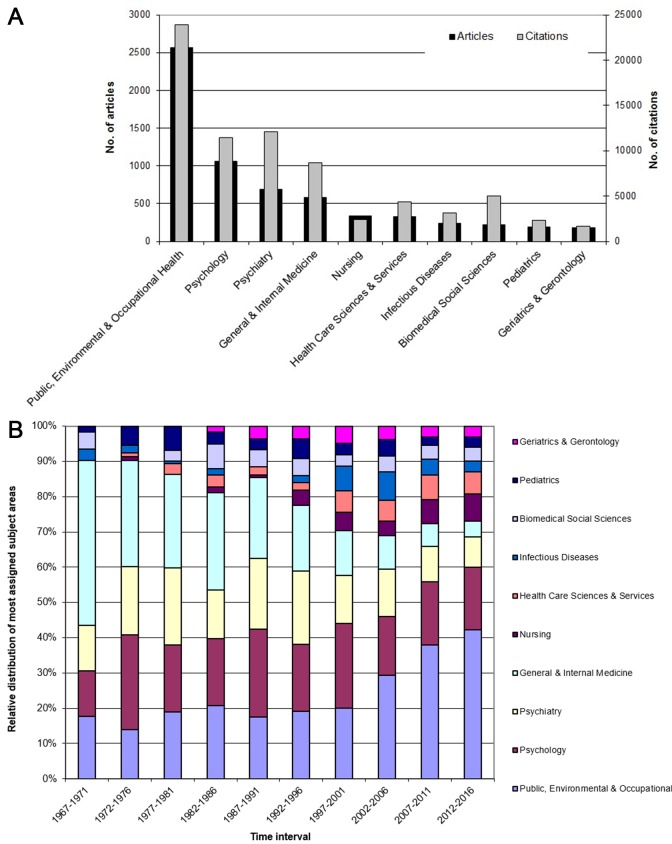
A. Most assigned subject areas for papers on immigration by article number and by number of citations. B. Relative distribution of the most assigned subject areas by time interval for papers on immigration.
Over the last decades, a change of the applied subject areas can be observed with an increasing trend especially in the field of Public, Environmental & Occupational Health . Furthermore, Psychology continues to play a major role. Additionally, subject areas like Nursing and Health Care Sciences & Services gain more visibility ( Figure 6 , panel B ).
The objective of this study was to evaluate the published scientific output using scientometric methods. With the use of the NewQIS System [ 21 ] scientific work was assessed regarding quantitative and semi-qualitative parameters considering chronological and geographical factors and additional publication criteria.
This study does not intend an entire content-analysis of the scientific publications on immigration but it considers titles and subject areas. By additionally analyzing scientometric parameters it is possible to investigate characteristics of the worldwide research output as well as the impact on the scientific community [ 26 ].
The search term was selected in consensus between the authors. In the light of quality and after thoughtful consideration the expression ‘immigra*’ had to be chosen to acquire a representative data set. With this search we figured out to achieve the best thematic results for the project. The asterisk ‘*’ opens up the option to study ‘immigration’, ‘immigrant’ and other possible spelling variants, keeping in mind that single words like ‘migration’ or ‘emigration’ -if they occur alone- cannot be included in this analysis. But as these terms produced high numbers of artefacts for the purpose of the regarded meaning, it was necessary to exclude these words.
The utilized database was the Web of Science Core Collection (WoS). WoS offers search queries through a title or topic selection. The topic search includes the title, the abstract and the author keywords. As an inconsistency can be observed in the structure of keywords [ 27 ] and as an abstract search without scanning the keywords is not provided by WoS a title search was performed accepting the limitation to receive less but higher quality results.
The comparison of WoS, Scopus and Google Scholar , which are the only sources for citation analyses yet, results in the detection of different citation numbers for high-profile medical articles [ 28 ]. While Scopus covers a wider journal range it has a strong limitation by publishing only recent articles after 1995 [ 29 ]. Google Scholar lacks in less frequently updated citations [ 29 ], consequently WoS was the best, but certainly limited, choice.
As WoS originates from the United States a bias of the English language has to be taken into detailed consideration. English is used as the universal language of science [ 30 ]. This can correspondingly be demonstrated on the gathered results with a clear domination of the English language. As English-language articles reveal a higher impact factor [ 31 ] they subsequently receive even more citations.
All parameters based on the amount of citations are affected by incorrect citations or may be manipulated by self-citations [ 32 ]. Additionally, several characteristics of citation can be evaluated throughout the different academic disciplines [ 33 ].
While assessing the h-index of an author, the age of a scientist has not been taken into account whereas the total period of a scientists’ research activity might influence the results [ 34 ]. Furthermore, specific details of an authorship or the country of origin are disregarded.
The citation rate provides single measures but cannot evince the complete work of a researcher. By studying semi-qualitative indicators, the recognition of articles within the scientific community can be investigated. The synopsis of multiple parameters guides to a meaningful statement.
In the first years of the 20th century, remarkable numbers of articles on immigration can be found in Public Health Reports . The intention of these reports was to provide epidemiologic information [ 35 ]. The first published papers in the early 1900s covered several medical immigration topics. Not only trachoma or hookworms were discussed, noticeable are several articles about ‘insanity’ and ‘mentally defective’ immigrants. It shows that the ethical requirements and the moral attitude during this time were completely different from nowadays.
Looking at the number of articles per annum, increasing scientific work on immigration can be found at the end of the 20th-21st century. On one side, this can be explained by an overall increase of scientific work and publications [ 36 , 37 ]. On the other hand, immigration has become a frequently discussed topic in all areas of life. Not only triggered by worldwide crises and a generally increased mobility [ 1 ] immigration has certainly become one of the main topics of public interest in several countries.
The USA releases the vast majority of the total publications. Canada can also be identified as a frequent publishing country. Interestingly Spain, Sweden and Israel are on the next positions which demonstrates the significance of immigration for these countries.
Different countries are equipped with different proportional resources. Not only the national population size but also differing funds for research and development (R&D) need to be taken into consideration [ 38 ]. Ranking each countries’ articles in relation to the GDP clearly shows Israel on position one followed by Sweden, Canada and after several mainly European countries the United States on position 13. Comparing the worldwide gross domestic expenditure on R&D (GERD) as a percentage of the GDP Israel and Sweden can correspondingly be found under the top five countries [ 39 ]. After adjusting the absolute numbers to the number of inhabitants of each country Israel, Sweden and Norway turn up to be on the first positions which shows their substantial work. These findings clearly validate the importance of immigration for the affected countries.
As scientists are interested in a high visibility and recognition of their work, the preference of collaboration partners within prestigious institutions can explain the collaboration share with the USA. In the scientific world international cooperation is important as it achieves a higher impact [ 40 ], it offers access to resources, encourages a spread of knowledge and finally receives more citations [ 41 ].
The most cited articles show the broad spectrum of health issues on immigration. Although several subject areas are being used and different authors and institutions are contributing the research, on evaluating the scientific work, a possible country bias needs to be acknowledged as on nine of the top 10 most cited articles the USA are mainly involved. While barely reaching the threshold (n = 30) by publishing 35 articles in total, Japan achieves the highest citation rate. In this context, the bias of one paper from 1991 in collaboration with the USA, on cancer among Japanese US-immigrants, is appreciable. With 532 citations, it is the most cited article in this study indicating the importance of cancer in conjunction with different home countries.
Concerning the subject areas, a difference can be recognized by comparing Italy and Spain with other countries. Relatively these two countries publish a high number of articles using the subject area Infectious Diseases with a noticeable focus on tuberculosis. Furthermore, ie, hepatitis, HIV or parasitic diseases are being discussed. This shows the impact of immigration on these countries and the specific health topics they are affected with.
With the general increase of publication numbers interestingly a shift between the topics can be documented over the last years. Although a consistent absolute amount of papers is still being published under the subject area General & Internal Medicine the article numbers in the category Public, Environmental & Occupational Health are remarkably increasing leading this group to the mainly used subject area. This demonstrates that immigration is not only relevant for individual medicine, but it is in fact an important aspect for public health and subsequently for a whole nation’s health system.
Immigration is a frequently discussed topic which can also be determined by an increase of scientific work about immigration especially during the recent times. During the next years and decades immigration will be in the focus and further scientific work on immigration will be seen. To satisfy this need of science, future international networks as well as interdisciplinary and international scientific cooperation are extremely important.
Acknowledgements
We thank G Volante for technical assistance and C Scutaru for his pioneering work during the establishment of the NewQIS platform.
Funding: None declared.
Authorship contributions: MT conceptualised the aim of the study, drafted and wrote the manuscript, analysed the data pool. EMW, DO, DK, MB, JB, DAG, DQ, DB contributed to conception, design and analyses and the interpretation of findings. The authors selected the search term and database, revised the article and participated in the final approval of the manuscript.
Competing interests: The authors have completed the Unified Competing Interest form at www.icmje.org/coi_disclosure.pdf (available on request from the corresponding author) and declare no conflict of interest.
- 1. United Nations, Department of Economic and Social Affairs, Population Division. International Migration Report 2015: Highlights. 2016(ST/ESA/SER.A/375).
- 2. Hunger U, Kissau K. Internet und Migration: Theoretische Zugänge und empirische Befunde: VS Verlag für Sozialwissenschaften; 2009.
- 3. UNHCR, Field Information and Coordination Support Section. Global Trends: Forced displacement in 2015. Geneva: United Nations High Commissioner for Refugees; 2016. [ Google Scholar ]
- 4. Dunn JR, Dyck I. Social determinants of health in Canada’s immigrant population: results from the National Population Health Survey. Soc Sci Med. 2000;51:1573–93. doi: 10.1016/S0277-9536(00)00053-8. [ DOI ] [ PubMed ] [ Google Scholar ]
- 5. McDonald JT, Kennedy S. Insights into the ‘healthy immigrant effect’: health status and health service use of immigrants to Canada. Soc Sci Med. 2004;59:1613–27. doi: 10.1016/j.socscimed.2004.02.004. [ DOI ] [ PubMed ] [ Google Scholar ]
- 6. Laroche M. Health status and health services utilization of Canada’s immigrant and non-immigrant populations. Can Public Policy. 2000;26:51–73. doi: 10.2307/3552256. [ DOI ] [ PubMed ] [ Google Scholar ]
- 7. Derose KP, Escarce JJ, Lurie N. Immigrants and health care: sources of vulnerability. Health Aff (Millwood) 2007;26:1258–68. doi: 10.1377/hlthaff.26.5.1258. [ DOI ] [ PubMed ] [ Google Scholar ]
- 8. Devillé W, Greacen T, Bogic M, Dauvrin M, Dias S, Gaddini A, et al. Health care for immigrants in Europe: is there still consensus among country experts about principles of good practice? A Delphi study. BMC Public Health. 2011;11:699. doi: 10.1186/1471-2458-11-699. [ DOI ] [ PMC free article ] [ PubMed ] [ Google Scholar ]
- 9. Ku L, Matani S. Left out: immigrants’ access to health care and insurance. Health Aff (Millwood) 2001;20:247–56. doi: 10.1377/hlthaff.20.1.247. [ DOI ] [ PubMed ] [ Google Scholar ]
- 10. Goldman DP, Smith JP, Sood N. Immigrants and the cost of medical care. Health Aff (Millwood) 2006;25:1700–11. doi: 10.1377/hlthaff.25.6.1700. [ DOI ] [ PubMed ] [ Google Scholar ]
- 11. Priebe S, Sandhu S, Dias S, Gaddini A, Greacen T, Ioannidis E, et al. Good practice in health care for migrants: views and experiences of care professionals in 16 European countries. BMC Public Health. 2011;11:187. doi: 10.1186/1471-2458-11-187. [ DOI ] [ PMC free article ] [ PubMed ] [ Google Scholar ]
- 12. Dauvrin M, Lorant V, Sandhu S, Deville W, Dia H, Dias S, et al. Health care for irregular migrants: pragmatism across Europe: a qualitative study. BMC Res Notes. 2012;5:99. doi: 10.1186/1756-0500-5-99. [ DOI ] [ PMC free article ] [ PubMed ] [ Google Scholar ]
- 13. Seifman R. Refugee and migrant populations and the International Health Regulations, The LANCET Global Health Blog. 2017. Available: http://globalhealth.thelancetcom/2017/04/13/refugee-and-migrant-populations-and-international-health-regulations. Accessed: 18 April 2017.
- 14. Getaz L, Da Silva-Santos L, Wolff H, Vitoria M, Serre-Delcor N, Lozano-Becerra JC, et al. Persistent infectious and tropical diseases in immigrant correctional populations. Rev Esp Sanid Penit. 2016;18:57–66. doi: 10.4321/S1575-06202016000200004. [ DOI ] [ PubMed ] [ Google Scholar ]
- 15. Robert Koch-Institut Infektionsepidemiologisches Jahrbuch meldepflichtiger Krankheiten für 2015. Krankenhhyg Infektverhüt. 2016;38:178–83. [ Google Scholar ]
- 16. Cowie RL, Sharpe JW. Tuberculosis among immigrants: interval from arrival in Canada to diagnosis. A 5-year study in southern Alberta. CMAJ. 1998;158:599–602. [ PMC free article ] [ PubMed ] [ Google Scholar ]
- 17. Lillebaek T, Andersen AB, Dirksen A, Smith E, Skovgaard LT, Kok-Jensen A. Persistent high incidence of tuberculosis in immigrants in a low-incidence country. Emerg Infect Dis. 2002;8:679–84. doi: 10.3201/eid0807.010482. [ DOI ] [ PMC free article ] [ PubMed ] [ Google Scholar ]
- 18. Guo H, Wu J. Persistent high incidence of tuberculosis among immigrants in a low-incidence country: impact of immigrants with early or late latency. Math Biosci Eng. 2011;8:695–709. doi: 10.3934/mbe.2011.8.695. [ DOI ] [ PubMed ] [ Google Scholar ]
- 19. Bornmann L, Leydesdorff L. Scientometrics in a changing research landscape: bibliometrics has become an integral part of research quality evaluation and has been changing the practice of research. EMBO Rep. 2014;15:1228–32. doi: 10.15252/embr.201439608. [ DOI ] [ PMC free article ] [ PubMed ] [ Google Scholar ]
- 20. OECD. Indicators of immigrant integration 2015: Settling in. 2015.
- 21. Groneberg-Kloft B, Fischer TC, Quarcoo D, Scutaru C. New quality and quantity indices in science (NewQIS): the study protocol of an international project. J Occup Med Toxicol. 2009;4:16. doi: 10.1186/1745-6673-4-16. [ DOI ] [ PMC free article ] [ PubMed ] [ Google Scholar ]
- 22. de Granda-Orive JI, Alonso-Arroyo A, Roig-Vazquez F. Which data base should we use for our literature analysis? Web of Science versus SCOPUS. Arch Bronconeumol. 2011;47:213. doi: 10.1016/j.arbres.2010.10.007. [ DOI ] [ PubMed ] [ Google Scholar ]
- 23. Ball R, Tunger D. Bibliometrische Analysen - Daten, Fakten und Methoden: Grundwissen Bibliometrie für Wissenschaftler, Wissenschaftsmanager, Forschungseinrichtungen und Hochschulen. Schriften des Forschungszentrums Jülich Reihe Bibliothek = Library, Vol 12. Jülich: Forschungszentrum Jülich; Zentralbibliothek; 2005. ger. [ Google Scholar ]
- 24. Hirsch JE. An index to quantify an individual’s scientific research output. Proc Natl Acad Sci U S A. 2005;102:16569–72. doi: 10.1073/pnas.0507655102. [ DOI ] [ PMC free article ] [ PubMed ] [ Google Scholar ]
- 25. Gastner MT, Newman MEJ. From The Cover: Diffusion-based method for producing density-equalizing maps. Proc Natl Acad Sci U S A. 2004;101:7499–504. doi: 10.1073/pnas.0400280101. [ DOI ] [ PMC free article ] [ PubMed ] [ Google Scholar ]
- 26. Garfield E. Citation analysis as a tool in journal evaluation. Science. 1972;178:471–9. doi: 10.1126/science.178.4060.471. [ DOI ] [ PubMed ] [ Google Scholar ]
- 27. Parsaei-Mohammadi P, Ghasemi AH, Hassanzadeh-Beheshtabad R. A comparative study of the origin, structure, and indexing language of the Persian and English keywords of articles indexed in the IranMedex database and their compliance with the Persian medical thesaurus and Medical Subject Headings. J Educ Health Promot. 2017;6:2. doi: 10.4103/jehp.jehp_137_14. [ DOI ] [ PMC free article ] [ PubMed ] [ Google Scholar ]
- 28. Kulkarni AV, Aziz B, Shams I, Busse JW. Comparisons of citations in Web of Science, Scopus, and Google Scholar for articles published in general medical journals. JAMA. 2009;302:1092–6. doi: 10.1001/jama.2009.1307. [ DOI ] [ PubMed ] [ Google Scholar ]
- 29. Falagas ME, Pitsouni EI, Malietzis GA, Pappas G. Comparison of PubMed, Scopus, Web of Science, and Google Scholar: strengths and weaknesses. FASEB J. 2008;22:338–42. doi: 10.1096/fj.07-9492LSF. [ DOI ] [ PubMed ] [ Google Scholar ]
- 30. Drubin DG, Kellogg DR. English as the universal language of science: opportunities and challenges. Mol Biol Cell. 2012;23:1399. doi: 10.1091/mbc.E12-02-0108. [ DOI ] [ PMC free article ] [ PubMed ] [ Google Scholar ]
- 31. Mueller PS, Murali NS, Cha SS, Erwin PF, Ghosh AK. The association between impact factors and language of general internal medicine journals. Swiss Med Wkly. 2006;136:441–3. doi: 10.4414/smw.2006.11496. [ DOI ] [ PubMed ] [ Google Scholar ]
- 32. Bartneck C, Kokkelmans S. Detecting h-index manipulation through self-citation analysis. Scientometrics. 2011;87:85–98. doi: 10.1007/s11192-010-0306-5. [ DOI ] [ PMC free article ] [ PubMed ] [ Google Scholar ]
- 33. Sangwal K. Some citation-related characteristics of scientific journals published in individual countries. Scientometrics. 2013;97:719–41. doi: 10.1007/s11192-013-1053-1. [ DOI ] [ PMC free article ] [ PubMed ] [ Google Scholar ]
- 34. Bornmann L, Mutz R, Daniel H-D. Are there better indices for evaluation purposes than the h index?: A comparison of nine different variants of the h index using data from biomedicine. J Am Soc Inf Sci. 2008;59:830–7. doi: 10.1002/asi.20806. [ DOI ] [ Google Scholar ]
- 35. Hofmann D. Public Health – Eine szientometrische Analyse verschiedener Publikationsformen und -medien. Frankfurt: Goethe-Universität; 2016. [ Google Scholar ]
- 36. Noorden van R. Global scientific output doubles every nine years: News blog. Available: http://blogs.nature.com/news/2014/05/global-scientific-output-doubles-every-nine-years.html . Accessed: 25 December 2016.
- 37. Bornmann L, Mutz R. Growth rates of modern science: A bibliometric analysis based on the number of publications and cited references. J Assn Inf Sci Tec. 2015;66:2215–22. doi: 10.1002/asi.23329. [ DOI ] [ Google Scholar ]
- 38. Vinkler P. Correlation between the structure of scientific research, scientometric indicators and GDP in EU and non-EU countries. Scientometrics. 2008;74:237–54. doi: 10.1007/s11192-008-0215-z. [ DOI ] [ Google Scholar ]
- 39. Unesco Institute for Statistics. Science, technology and innovation: Gross domestic expenditure on R&D (GERD), GERD as a percentage of GDP, GERD per capita and GERD per researcher: Year: 2014; July 2016 release. Regional data January 2017 update. Available: http://data.uis.unesco.org/?queryid=74# . Accessed: 9 April 2017.
- 40. Kiesslich T, Weineck SB, Koelblinger D. Reasons for Journal impact factor changes: Influence of changing source items. PLoS One. 2016;11:e0154199. doi: 10.1371/journal.pone.0154199. [ DOI ] [ PMC free article ] [ PubMed ] [ Google Scholar ]
- 41. Adams J. Collaborations: The rise of research networks. Nature. 2012;490:335–6. doi: 10.1038/490335a. [ DOI ] [ PubMed ] [ Google Scholar ]
- View on publisher site
- PDF (3.7 MB)
- Collections
Similar articles
Cited by other articles, links to ncbi databases.
- Download .nbib .nbib
- Format: AMA APA MLA NLM
Add to Collections

IMAGES