
Project in-depth: The Three Gorges Dam, China

Introduction to the Dam
Three Gorges Dam, China is the world’s largest hydroelectric facility. In 1994, work on the project started with the goal of not only creating power to fuel China’s rapid economic expansion but also controlling the country’s longest river, protecting millions of people from deadly floods, and elevating the project to a point of great technological achievement and national pride. Initially, the entire project took about two decades to complete, Construction on the Three Gorges Dam was completed in 2008 it cost 200 billion yuan ($28.6 billion). The dam is significantly larger than Brazil’s 12,600MW Itaipu facility, standing 185 meters tall and 2,309 meters wide as one of the largest hydroelectric plants in the world.

NSPD: Water Quality, Ecosystems
Stakeholder Types: Federated state/territorial/provincial government, Sovereign state/national/federal government, Local Government, Environmental interest, Community or organized citizens.

Sun Yat-sen first stated his plan to construct the dam in 1919. In addition to endorsing the project to mitigate the ongoing threat of flooding, Mao Zedong also revealed his plan to construct the dam in one of his most well-known poems, “Swimming” (1956). At the end of the first phase, two Chinese equipment vendors were crucial.

Working with the two foreign groups, Harbin Power Equipment and Dongfang Electrical Machinery benefited from stringent technology transfer rules. Dongfang collaborated with the Voith General Electric and Siemens consortium, while Harbin worked with the Chinese company Oriental Motor and the Alstom, ABB, and Kvaerner grouping. Nearly the construction of the final two units of the first phase took place in China. Chinese groups were given construction chores. Contracts totaling $800 million were awarded to Gezhouba Share Holding, Yichang Qingyun Hydropower Joint Management, and Yichang Three Gorges Project Construction 378 Joint Management just before the equipment announcements. The powerplant and dikes were constructed as part of the work.

Time of Construction

Because the Three Gorges Project needed to manage flood discharge on a massive scale, if a typical architecture of the flood-discharge orifices had been used, a large leading edge would have been needed for the discharge sections. The length of the flood-discharge dam sections had to be as short as possible while still meeting the requirements of energy dissipation and anti-scouring due to the large installed capacity of the power station and the large number of installed units. In addition, construction diversion and navigation needed to be considered.

Excavation and earth-filling
To build the plant, 102.83 million cubic meters of rock and soil had to be excavated, and 31.98 million cubic meters had to be filled in.

Concrete and metal placement
Additionally, 27.94 million cubic meters of concrete had to be placed, and a 256,500-ton metal frame had to be installed.

Hydro turbine generator
Production of hydroelectric power started small in 2003 and grew steadily as more turbine generators were added over the years until 2012 when all 32 of the dam’s turbine generator units were in use. With those units and two more generators, the dam could produce 22,500 megawatts of energy, making it the world’s most productive hydroelectric dam. With an annual power generating volume of 111.88 terawatt hours in 2020, the hydropower project set a new world record.

The Three Gorges Dam is a gravity structure made of concrete that is straight-crested and spans 2,335 meters (7,660 feet) with a maximum height of 185 meters (607 feet). Its design calls for 463,000 metric tons of steel and 28 million cubic meters (37 million cubic yards) of concrete. Large portions of the Qutang, Wu, and Xiling gorges are submerged by the dam for around 600 km (375 miles) upstream.

This creates a massive deepwater reservoir that enables oceangoing freighters to travel 2,250 km (1,400 miles) inland on the East China Sea from Shanghai to the inland city of Chongqing. The complex’s five-tier ship locks, which let vessels weighing up to 10,000 tons pass the dam, and ship lift, which enables vessels weighing up to 3,000 tons to bypass the ship locks and pass the dam more rapidly, aid in the navigation of the dam and reservoir. The lift was the largest ship lift in the world when it was finished in late 2015. It measured 120 meters (394 feet) long, 18 meters (59 feet) broad, and 3.5 meters (11 feet) deep.
Context and debate surrounding the Three Gorges Dam
The concept for the Three Gorges Dam was first floated by Chinese Nationalist Party leaders in the 1920s. However, it gained fresh momentum in 1953 when Mao Zedong, the Chinese leader, ordered feasibility assessments of several locations. In-depth project planning started in 1955. The dam was not without its critics, despite the claims of its supporters that it would prevent catastrophic floods along the Yangtze, ease inland trade, and supply much-needed electricity for central China. The Three Gorges project was criticized from the moment the designs were put forth until they were completed.

The threat of a dam collapse, the 1.3 million people (some critics claimed the number was closer to 1.9 million) who were uprooted from over 1,500 cities, towns, and villages along the river, and the devastation of numerous unique architectural and archaeological sites along with breathtaking landscapes were among the main issues.

In addition, there were worries—some of which came true—that the reservoir would become contaminated by industrial and human waste from towns and that the massive volume of water it contained may cause landslides and earthquakes. Several smaller, far less expensive, and less problematic dams on the Yangtze tributaries, according to some Chinese and foreign engineers, could produce as much electricity as the Three Gorges Dam and regulate flooding almost as effectively. Building those dams, would, they claimed, allow the government to fulfill its top priorities without taking unnecessary chances.
An Environmental Catastrophe?

Chinese officials assert that the Three Gorges Dam has been successful in preventing floodwaters from spreading, despite the destruction. China Three Gorges Corporation, the dam’s operator, informed China’s official news agency Xinhua that 18.2 billion cubic meters of potential floodwater had been caught by the dam.
The dam “effectively reduced the speed and extent of water level rises” on the middle and lower reaches of the Yangtze, an official from the water resources ministry told the state-run publication China Youth Daily. However, some geologists claim that the poor effectiveness of the Three Gorges Dam in preventing flooding has been exposed, given that numerous gauging stations monitoring river flows in the Yangtze basin are witnessing record-high water levels this summer it involved uprooting over a million people along the Yangtze River.

Furthermore, the government’s claim that the dam could shield the nearby villages from a “once-in-a-century flood” has been contested on multiple occasions. The Yangtze basin experienced its highest average rainfall in over 60 years since June, which led to the river and its numerous tributaries overflowing, reinforcing those fears. Over 158 persons have lost their lives or disappeared, 3.67 million residents have had to relocate, and 54.8 million individuals have been impacted, resulting in horrifying financial losses of 144 billion yuan ($20.5 billion).

Concerns about sustainable development and proper water management have surfaced internationally due to the project’s far-reaching effects. All of the measures as mentioned earlier place a strong emphasis on cooperative fact-finding, mutual benefits discussions, technical expertise, inclusion, transparency, and collaborative adaptive management , all of which are progressively enhancing Chinese governance in the areas of water management and dam construction.
China: The Three Gorges Dam Hydroelectric Project (no date) China: The Three Gorges Dam Hydroelectric Project – AquaPedia Case Study Database. Available at: https://aquapedia.waterdiplomacy.org/wiki/index.php?title=China%3A_The_Three_Gorges_Dam_Hydroelectric_Project (Accessed: 01 December 2023).
Hvistendahl, M. (2013) China’s Three Gorges Dam: An environmental catastrophe? Scientific American. Available at: https://www.scientificamerican.com/article/chinas-three-gorges-dam-disaster/ (Accessed: 28 December 2023).
Three Gorges Dam hydroelectric power plant, China (2021) Power Technology. Available at: https://www.power-technology.com/projects/gorges/?cf-view (Accessed: 01 December 2023).
Three Gorges Dam (2023) Encyclopædia Britannica. Available at: https://www.britannica.com/topic/Three-Gorges-Dam (Accessed: 01 December 2023).
Gan, N. (2020) China’s Three Gorges Dam is one of the largest ever created. was it worth it? CNN. Available at: https://edition.cnn.com/style/article/china-three-gorges-dam-intl-hnk-dst/index.html (Accessed: 01 December 2023).
(2022)The Three Gorges Project. Available at: https://www.engineering.org.cn/en/article/35384/detail (Accessed: 01 December 2023).

A recent graduate, passionate about learning tangible and intangible concepts and ideas relating to space, time and people, is mostly interested in looking at how built spaces is a medium of cultural and social identity. Architecture for her is constant search. she is interested in representing built designs better with graphics,drawings and writing.

Assessment and Evaluation in Decolonized Design Education

Why travel to Kochi this December?
Related posts.

Project in-depth: Kaufmann House by Richard Neutra

Statesman Building, Delhi

Mole Antonelliana, Italy

House of Wisdom, Sharjah

Kanha Shanti Vanam, Telangana

Gingee Fort, Tamil Nadu
- Architectural Community
- Architectural Facts
- RTF Architectural Reviews
- Architectural styles
- City and Architecture
- Fun & Architecture
- History of Architecture
- Design Studio Portfolios
- Designing for typologies
- RTF Design Inspiration
- Architecture News
- Career Advice
- Case Studies
- Construction & Materials
- Covid and Architecture
- Interior Design
- Know Your Architects
- Landscape Architecture
- Materials & Construction
- Product Design
- RTF Fresh Perspectives
- Sustainable Architecture
- Top Architects
- Travel and Architecture
- Rethinking The Future Awards 2022
- RTF Awards 2021 | Results
- GADA 2021 | Results
- RTF Awards 2020 | Results
- ACD Awards 2020 | Results
- GADA 2019 | Results
- ACD Awards 2018 | Results
- GADA 2018 | Results
- RTF Awards 2017 | Results
- RTF Sustainability Awards 2017 | Results
- RTF Sustainability Awards 2016 | Results
- RTF Sustainability Awards 2015 | Results
- RTF Awards 2014 | Results
- RTF Architectural Visualization Competition 2020 – Results
- Architectural Photography Competition 2020 – Results
- Designer’s Days of Quarantine Contest – Results
- Urban Sketching Competition May 2020 – Results
- RTF Essay Writing Competition April 2020 – Results
- Architectural Photography Competition 2019 – Finalists
- The Ultimate Thesis Guide
- Introduction to Landscape Architecture
- Perfect Guide to Architecting Your Career
- How to Design Architecture Portfolio
- How to Design Streets
- Introduction to Urban Design
- Introduction to Product Design
- Complete Guide to Dissertation Writing
- Introduction to Skyscraper Design
- Educational
- Hospitality
- Institutional
- Office Buildings
- Public Building
- Residential
- Sports & Recreation
- Temporary Structure
- Commercial Interior Design
- Corporate Interior Design
- Healthcare Interior Design
- Hospitality Interior Design
- Residential Interior Design
- Sustainability
- Transportation
- Urban Design
- Host your Course with RTF
- Architectural Writing Training Programme | WFH
- Editorial Internship | In-office
- Graphic Design Internship
- Research Internship | WFH
- Research Internship | New Delhi
- RTF | About RTF
- Submit Your Story
Looking for Job/ Internship?
Rtf will connect you with right design studios.

Case Study: The Three Gorges Dam
The 3 Gorges Dam project - China
- This is an example of a large scale development project designed to:
- Create more jobs
- Allow large ships to navigate the river and reach Chungong Create thousands of jobs Develop new towns and farms
- Provide 10% of China’s electricity through HEP Increase tourism along the river
- Protect precious farmland from flooding
- However it also has a number of disadvantages:
- Over 150 towns and 4500 thousand villages will be flooded displacing people from their homes
- 1.3 million people will be forced to move
- The river landscape will be forever changed
- The lake which will be created could become very polluted from industrial waste
This video showcases the Chinese Three Gorges Dam Project

ORIGINAL RESEARCH article
Case study: influence of three gorges reservoir impoundment on hydrological regime of the acipenser sinensis spawning ground, yangtze river, china.

- 1 Changjiang River Scientific Research Institute, Wuhan, China
- 2 Key Laboratory of River Regulation and Flood Control of MWR, Wuhan, China
After the construction of the Three Gorges Dam (TGD) in China, the downstream has been affected by the reduction in sediment discharge and regulation of flow processes, which have resulted in severe scouring and changes hydrological regime. Consequently, the spawning ground of Chinese sturgeon distributed along the downstream Yichang reach could be affected. This study examined the effects of TGD on the streamflow, sediment load and channel morphology downstream based on in situ measured data. Results showed that, after the impoundment of the TGD, sediment load at the downstream Yichang hydrological station decreased significantly, and the Yichang reach continued to be scoured. The distribution of erosion was uneven, and the scouring mainly occurred in the branching channels. The channel gradient and riverbed roughness increased with the erosion of the river cross section. After more than 10 years of erosion, the riverbed scouring and armouring in the Yichang reach was basically completed, thus we expected that the spawning grounds of Chinese sturgeon could be retain as the riverbed tends to be stable. The findings in this work have implications in the protection of the critically endangered Chinese sturgeon.
Introduction
The Three Gorges Reservoir (TGR) is one of the largest water projects in the world. While it plays an important role in flood control and water utilisation, the TGR dramatically changes the incoming water and sediment conditions in the downstream reaches ( Yang et al., 2007a ; Zhang et al., 2017 ; Guo et al., 2019 ). Owing to the storage and regulation performed by the reservoir, extensive sediment is deposited in the reservoir, thereby significantly reducing the sediment concentration of the flow discharged downstream. The sediment carrying capacity of the water flow is severely sub-saturated. Riverbed scouring and armouring critically impacts the flood control, navigation, ecology, and environment of the lower reaches ( Friedman et al., 1998 ; Yang et al., 2014 ; Zhou et al., 2014 ).
Global researches demonstrated that about 30% of fish species in freshwater have become endangered, threatened, or extinct in the past few decades, which is much worse than in marine ecosystems ( Liermann et al., 2012 ). Chinese sturgeon Acipenser sinensis , mainly lives in the mainstream of Yangtze river, the continental shelf of East China Sea and Yellow Sea. It is one of the first-class national protected animals in China, and has been classified as Critically Endangered in the IUCN Red List of Threatened Species. The spawning grounds of Chinese sturgeon were in the upper Yangtze river and the Jinshajiang river, covering a stretch of at least 600 km of the river length. However, after the construction of Gezhouba Dam (GD) in January 1981, Chinese sturgeon could not go to the previous spawning grounds and fish alternatively spawned within a 30 km section below the GD, which is much smaller than the original spawning ground in the upper reach of the Yangtze river ( Chang, 1999 ; Wang et al., 2013 ). In 2003, the TGR (∼38 km upstream of Gezhouba Dam) began to operate, resulting in a large change in the downstream hydrological regime ( Guo et al., 2012 , 2020 ). It is urgent to protect Chinese sturgeon from extinction as the population of this endangered species in the Yangtze river has declined remarkably in recent decades due to the influences of habitat loss, overfishing, and hydrologic regime changes ( Zhuang et al., 2016 ; Shen et al., 2018 ). The new spawning ground plays a crucial role in preserving Chinese sturgeon species. Thus, the conservation of this area is crucial.
Because of its importance, many researchers have studied the evolution and hydrodynamic characteristics of this reach. Li et al. (2011) analysed its flow-sediment conditions. Zhou et al. (2017) studied the shape of its cross section and variation in flat discharge and considered that the cross section tends to be narrower and deeper. However, other researchers ( Zhang et al., 2013 ; Han et al., 2017 ; Xia et al., 2017 ) focused on the entire middle and lower reaches of the Yangtze River. Most of the riverbed in the middle and lower reaches of the Yangtze River have sandy materials, which are easy to deform, while only the Yichang reach has a sandy pebble riverbed in the middle reaches. In addition to morphological changes, bed sediment armouring often occurs in the scouring state ( Doyle and Harbor, 2003 ; Yuan et al., 2012 ; Li et al., 2019 ). However, the impacts of the specific variations of hydraulic condition and channel morphology on the spawning ground of Chinese sturgeon just a few 10 km downstream of the GD remain unclear. Although the spawning behaviour in the downstream site next to GD has been detected after the impoundment of TGD, the spawning has been lowered in quantity and quality, moreover, the natural spawning activities of Chinese sturgeon has been interrupted for 3 consecutive years from 2017 to 2019. Therefore, it is necessary to figure out the effects of the newest changes in the river regime, riverbed materials, and response to flow conditions in the suitability of the only existed spawning ground for Chinese sturgeon. Our objectives were to analyse the impact of the impoundment of TGD on the water-sediment conditions and riverbed evolution of the Yichang reach and their influences on the spawning ground of Chinese sturgeon recently based on measured data from 2003 to 2018. It is expected to provide reference for the protection of Chinese sturgeon spawning grounds and the evolution of sandy pebble riverbed downstream of other dams.
Study Area and Methods
The Yangtze river is the longest river in China with a total length of ∼6,300 km, and it provides essential habitat for many fish species. According to the geographic and hydrological properties, the Yangtze river is usually divided into upper, middle and lower reaches with divisions at Yichang and Hukou ( Figure 1A ).

Figure 1. (A) Boundaries of the Yangtze River Basin. (B) Map of the Yichang reach. The yellow area in (B) shows the spawning ground of Chinese sturgeon, and red lines indicate the cross sections from Yi34-Yi51 without Yi35. DGB, Dagong Bridge; BTH, Baotahe; YZB, Yanzhiba; AJZ, Aijiazhen; LPL, Longpan Lake; MPX, Mopanxi; HYT, Huyatan; GLB, Gulaobei; HHT, Honghuatao.
The Three Gorges Dam (TGD) locates at the outlet of the upper Yangtze river, approximately 40 km upstream of the Yichang hydrological station. The storage capacity of TGR is about 393 × 10 8 m 3 , corresponding to its normal impoundment water level of 175 m. The GD locates about 38 km downstream of the TGD, and it is the largest runoff hydropower station with low water head and large flow discharge in the world. The GD was China’s largest hydroelectric facility with a total storage capacity of 15.8 × 10 8 m 3 until the completion of the TGR project.
As the spawning ground of Chinese sturgeon have been changed to downstream of GD since 1982, the Yichang reach was selected as the study area.
The Yichang reach is located at the entrance of the middle reaches of the Yangtze river, which is a transition section from a mountainous river to a plain river. Restricted by the low mountains and hills on both sides of the river, the trend of the entire reach is from northwest to southeast. This reach starts at the GD and ends near Gulaobei (GLB), with a length of ∼30 km. The Yichang reach is generally straight, with Yanzhiba (YZB) forming a river island. The deep channel is close to the left bank, which is submerged and exposed to water in normal water periods. Hence, the Yangtze river is divided into left and right branches. The left branch is the main branch, whereas the right branch is cut off in dry seasons ( Figure 1B ).
Data Acquisition
Streamflow and sediment in the Yichang reach mainly come from the upper Yangtze river. Annual hydrological data including flow discharge, sediment load, and median particle size since 1950 were collected at the hydrometric station of Yichang, which is located just a few kilometers downstream of the GD ( Figure 1B ). The data used in the present study were obtained from the Changjiang Water Resources Commission (CWRC) 1 , and their consistency was verified.
In order to calculate the cumulative volume of channel deformation and analysis the plane change, the post-flood cross-sectional profiles surveyed at 17 fixed locations annually since 2002 were collected in the study reach, with the section number ranged from Yi34- Yi51 (without Yi35). The distance between two consecutive sections varies from about 1–3 km, with a mean spacing of around 2 km.
This study analysed the erosion and deposition volume and morphological changes of the river channel, riverbed armouring, gradient changes, and resistance changes.
The cross-section morphology method could accurately reflect the volume changes and distribution circumstances along the main channel of the rivers, as well as the beach and whole reach area on the cross-sections. Thus, the volume of erosion and deposition was calculated using the cross-section morphology method ( Xia et al., 2017 ; Yuan et al., 2018 ). By cutting out several cross sections of the river channel, assuming that the changes between two adjacent sections are gradual. The storage capacity between sections Vi can be calculated using a trapezoidal formula as:
where A i and A i + 1 indicate the areas of the i th and i + 1th section, respectively. ΔL is the distance between the i th and i + 1th sections. Differences between Vi under varied years show the volume of erosion (negative) or deposition (positive).
When the circumstances of water and sediment changed, the river channel would usually gradually reach a new balance state through continuous self-adjustments. The fluvial facies relationship is known as a quantitative relationship between the section morphology and longitudinal profile ( Yuan et al., 2018 ). In this study, the fluvial facies coefficient ζ was used to represent the morphological variation, which was expressed using the width to depth ratio as:
where B is the river width, h is the water depth.
Riverbed armouring is reflected by changes in the characteristic particle size of the riverbed materials ( Doyle and Harbor, 2003 ).
The change in roughness was back-calculated using the Manning model:
where A ¯ = the mean area river of import and export cross section in the channel, m 2 ; Q ¯ = the mean discharge of import and export cross section, m 3 /s; R ¯ = the mean hydraulic radius of import and export cross section, m; and J = the flow surface slope.
Streamflow and Sediment Changes
The Yichang hydrological station is the control station. Figure 2 shows the variation in annual runoff and sediment load over time at Yichang station. The annual runoff at Yichang station fluctuated yearly with no clear trend, but the annual sediment load has been decreasing significantly since around 2001 when the TGD was closed to operation.

Figure 2. Annual runoff and sediment load at Yichang station.
Before the impoundment of the GD (1950–1980), the multi-year average runoff and sediment load at Yichang station was 4,518 × 10 8 m 3 and 5.15 × 10 8 t, respectively. After the impoundment of the GD and before the impoundment of the TGR (1981–2002), the multi-year average runoff at Yichang station was 4,348 × 10 8 m 3 , and the mean annual sediment load was 4.59 × 10 8 t. Before the impoundment of the TGR, the annual runoff and sediment load at Yichang station underwent minor changes. Since the operation of the TGR (2003–2018), the annual runoff at Yichang station fluctuated around the average value over many years with minor changes, while the annual sediment load declined sharply down to about 0.36 × 10 8 t.
The variations of impoundment phases of the TGR was as follows: the storage level was raised to 135 m in 2003, and the cofferdam power generation period was initiated (period A). Then in October 2006, the storage level reached 156 m, marking the start of the initial storage period (period B). Two years later, the TGR began to impound water to the normal level of 175 m on September, 2008, known as the 175 m trial storage period (period C) ( Ren et al., 2021 ). From 2003 to 2018, the outflow sediment became thinned. As shown in Figure 3 , during the power generation period at the cofferdam, the mean particle size of the outflow sediment decreased sharply from 0.044 to 0.014 mm. The proportion of particles finer than 0.031 mm increased from 75.3 to 86.7%, and the proportion of particles larger than 0.125 mm decreased from 14 to 5.4%. The mean and median particle sizes of the outflow sediment had minor changes in the period B of the initial storage period from 2006 to 2008, and the proportion of coarse sediment continued to decrease. While during the trial storage period from October 2008 to December 2018, the mean and median particle sizes of suspended sediment slightly increased. In 2018, the median particle size at Yichang station was 0.009 mm, and the coarse-grained sediment content was 0.5%.

Figure 3. Changes of the median and mean particle size of suspended sediment at Yichang station.
Since the TGR has been in operation, the changes in median and mean particle sizes of the suspended sediment during different periods basically demonstrated the same patterns. In other words, the discharged sediment became finer. During the power generation period at the cofferdam, the difference between the median and mean particle sizes of the suspended sediment discharged from the reservoir was large, indicating that the degree of non-uniformity of sediment gradation was large. However, in both initial and trial storage periods, the difference between the median and mean particle sizes decreased, indicating that, owing to the reservoir regulation, the non-uniformity of the suspended sediment discharged from the reservoir was reduced. From January 2013 to December 2018, the mean particle size of suspended sediment increased, but it was notably smaller than that during the cofferdam impoundment period. Further, the median particle size exhibited no significant changes.
Riverbed Erosion and Deposition
The shoreline of the Yichang reach is composed of hilly terraces with strong impact resistance. With the control of bedrock nodes along the course, the overall river regime has been stable over the years, and the main stream has been relatively stable.
Since the impoundment of the TGR, the channel was mainly in the scouring state. Analysis of the main flow line changes demonstrated that the flow in this section was relatively smooth, and no large backflow areas were observed. During the high water periods, the main stream was in the middle of the channel and could submerge the YZB. The maximum flow velocity was observed at the tail of YZB. During the normal and low water periods, branching flow was formed at the head of YZB, and the main stream flowed to the left channel. The maximum velocity happened at the head of YZB. During the low water period, the main stream started from the GD, and turned right to the head of YZB. After flowing out of YZB, the main stream slightly tended to the right bank during the low water period and tended toward the centre of the channel during medium and high water periods.
With the normal operation of the TGR, the scouring intensity of the riverbed in this section of the river gradually decreased, and the scouring slowly moved downstream. The scouring in the YZB reach was the most evident from 2002 to 2004, and the scouring intensity of the entire reach decreased slightly after 2004. Since the initial storage period of the TGR, the riverbed between the Yichang station and YZB presented a state of alternation of scouring and deposition until 2016, with a small change range. From YZB to Huyatan (HYT), the erosion remained dominant, and the location of erosion was significant in the YZB section. Table 1 shows the calculations of sectional erosion and deposition amount in the Yichang reach. It can be seen that from 2002 to 2016, the Yichang reach presented a scouring state, and the cumulative amount of erosion was 1,565 × 10 4 m 3 . Among them, the erosion in the YZB section was the most severe, and the total amount of erosion attained 47.5% of the entire Yichang reach ( Table 1 ).

Table 1. Statistics of the erosion and deposition volume in the Yichang reach at the water level of 43.3 m in different periods.
Plane Changes
The thalweg line of the Yichang reach started from the GD, and it went down along the left trough of YZB and then gradually transited to the right bank after leaving YZB. In the vicinity of Longpan Lake (LPL), the thalweg line transited to the left bank and then turned to the right bank. It gradually transited to the left bank until reaching the Mopanxi (MPX). This trend was basically consistent with that of the main stream and underwent minor changes over the years ( Figure 4 ). According to the change of main stream and thalweg, the interannual oscillation of the thalweg was small.

Figure 4. Thalweg variations along the Yichang reach before and after the impoundment of the Three Gorges Reservoir.
It was found that the river reach just downstream of the GD (sections Yi 34∼Yi 39) almost reached the bedrock, and the riverbed exhibited strong anti-scouring capability. The elevation variation range over the years was small, from 18 to 22 m. The changes of the thalweg were relatively large in the YZB reach (sections Yi 42∼Yi 44). From 2002 to 2008, the elevation of thalweg generally decreased by 2–5 m, while the descending rate of the thalweg slowed significantly from 2008 to 2010. In the reach below YZB, the thalweg descent slowed down after 2002, and the change of thalweg elevation was not significant from 2008 to 2010. From 2010 to 2016, the interannual variations of scouring and deposition of the reach increased, as well as the changes of longitudinal section of the thalweg.
Typical Marshland
The main river island of the Yichang reach is YZB, which is about 10.2 km away from the GD. YZB is a river island near the right bank, which stretches from Baotahe (BTH) down to Aijiazhen (AJZ). During both normal and high water periods, the YZB is submerged, whereas it is exposed during the low water period. After the normal impoundment of the GD and before the impoundment of the TGD, the YZB was basically stable, but the erosion and deposition processes were stronger than that of the natural river channel before the construction of the GD and TGD. In 2002, the 25 m contour lines of the upper and lower sections of the left branch channel were connected to form a complete 25 m deep channel. After 2002, the dam body of YZB was slightly scoured, and its area had been reduced, but the maximum length and width increased slightly. The maximum elevation of dam crest also increased slightly. After the impoundment of the TGD, the YZB was still generally stable, and its dam body erosion and shape change were relatively slow ( Table 2 ).

Table 2. Statistics of the characteristic values of Yanzhiba marshlands under the water depth of 39 m from 2002 to 2016.
Cross-Sectional Morphology
The cross-sectional morphology of the Yichang reach can be divided into three types: V shape for the curved section, U shape for the straight section, and W shape for the branching section. The main parts of erosion and deposition of each type of cross-section were the normal and low water parts of the main channel and side beach of the river bed, and the change of the part above the high water level is relatively small.
According to the analysis of the topographic data of the fixed section over time, the cross-sectional morphology of this reach changed greatly, and the fluvial facies coefficient was around 2–5. The width of the river changed from approximately 900 to 1,500 m, and the cross-sectional change was mainly reflected in the erosion and deposition in the deep channel. The statistics of cross-sectional elements of the normal-water channel in some sections of the Yichang reach showed that the fluvial facies coefficient in this section had a large change along the course and that of the YZB branching channel was large as the channel was wide and shallow. From 2002 to 2016, fluvial facies coefficient showed a decreasing trend, indicating that the river channel in this section tended to become narrower and deeper as the riverbed was undercut ( Table 3 ).

Table 3. Statistics of some cross-section elements of the Yichang reach under the water depth of 43.3 m.
As shown in Figure 5 , the left and right shorelines of the Yichang reach were relatively stable, and the riverbed evolution trend was dominated by deep channel scouring. The erosion range was large. The deep groove expanded yearly and became deeper and longer, while the horizontal dimension remained unchanged overall. The shoals in the whole reach shrank to varying degrees, and the shrinkage amplitude of the river island was slightly less than that of the side beach. With the operation of the TGR, the scouring intensity of the reach was gradually weakened.

Figure 5. Typical cross-section changes of the Yichang reach.
Riverbed Armouring
Since the operation of the TGR, an overall temporal fining trend of the suspended sediment was found, which was in consistent with the decreasing sediment load tendency ( Yang et al., 2014 ; Guo et al., 2020 ). In contrast, the riverbed materials coarsened significantly at Yichang station ( Figure 6 ). The median size of riverbed materials increased from 0.638 mm in November 2003 to 23.59 mm in October 2012. The riverbed composition gradually evolved from sand or sandy pebble before impoundment to pebble with sand. Before the impoundment of the TGR, 99% of riverbed materials ranged from 0.062 mm to 0.5 mm. From 2003 to 2005, 99% of riverbed material sizes were between 0.125 and 1 mm, approximately twice as large as before impoundment. After 2006, the trend of riverbed armouring was more obvious, and the proportion of coarser particles increased annually. The median size of riverbed materials coarsened to 10 mm with annual fluctuations. The coarsening of riverbed sediment at Yichang reach was ascribed to erosion, which tends to resuspend the finer grains and leave the coarser particles on the riverbed ( Yang et al., 2018 ). It was observed that the maximum coarsening of surficial sediment was immediately downstream of the TGD, and riverbed erosion has become the dominant source of suspended sediment in the middle and lower Yangtze reaches since the beginning of the TGD ( Yang et al., 2018 ; Guo et al., 2019 ). The size of riverbed materials at Yichang station increased to the maximum value in 2009 due to the 175 m experimental impoundment of the TGR in 2008, with pebbles as the main component. After 2010, there was more sediment deposition in the Yichang reach, with a slight increase in the content of fine-grained materials. From 2012 to 2014, the riverbed materials changed with the erosion and deposition conditions in the river reach. Gravel and pebbles were still the main components of the riverbed materials. The content of sand particles less than 2 mm was low. In 2015, due to the reduction in incoming sand from upstream, weak scouring occurred in the Yichang reach, and the proportion of gravel and pebbles increased. Thus, the riverbed at Yichang station coarsened significantly. The median post-flood particle size of riverbed materials at Yichang station in 2017 was 43.1 mm. Although the surficial sediment at Yichang reach has been coarsening significantly, it is expected that armouring of the coarsening reach will prevent further erosion.

Figure 6. Gradation curve of post-flood riverbed materials at Yichang station.
Changes in Gradient and Roughness
Changes in gradient.
The common result of riverbed undercutting erosion is water level drop. Since the GD has been in operation, low water levels at stations along the reach (Q: 5,000 m 3 /s) demonstrated a cumulative downward trend ( Table 4 ).

Table 4. Statistics of low water levels at each water level station along the Yichang reach under the flow discharge of 5,000 m 3 /s.
Figure 7 shows the water surface gradient of each section of the Yichang reach under different flow rates in 2012 after the impoundment of the TGR. The figure demonstrates that as flow rate increased, the overall gradient also increased. Gradients around YZB and MPX were small, which could control the low water level. For intermediate flood discharges, the control of YZB on the gradient is clearly weakened, while MPX has certain control at all discharge levels.

Figure 7. Water surface gradient of each section of the Yichang reach at different flow discharges in 2012.
Since the impoundment of the TGR, there has been a certain degree of adjustment in the water surface gradient in the Yichang reach ( Figure 8 ). In general, the gradient of the downstream reach of the dam is lower, however, the gradient of the Yichang reach increased, especially in the section from the GD to the BTH. A larger gradient indicates that the roughness of the section will increase. Accordingly, the gradient of the section from YZB to AJZ slightly increased.

Figure 8. Water surface gradient variation of each section in the Yichang reach at two different flow discharges: (A) 5,800 m 3 /s; (B) 10,000 m 3 /s.
Changes in Resistance After Riverbed Armouring
For sandy pebble reaches, the resistance of sand particles on the riverbed surface is a major source of resistance. Downstream of the TGD, the differences in grain size after bed surface armouring increased 100-fold, which inevitably led to a significant change in riverbed surface resistance ( Rinaldi and Simon, 1998 ).
Resistance adjustment can be visualized by the changes in the waterlines ( Zhou et al., 2018 ). Using the measured topographic and water level data of 2003 and 2012, the changes in channel roughness were analysed. The results showed that the channel roughness in 2012 increased significantly compared to that in 2003 ( Table 5 ), which was consistent with the riverbed surface armouring. The erosion of the cross section increased, and thus the hydrodynamic force was reduced. The roughness increase was beneficial to restrain the drawdown of normal and low water levels and reduced the flow rate. However, it was also likely to increase the turbulence near the riverbed, especially at the normal and low flow rates.

Table 5. Changes in topography and roughness before and after scouring.
Effects on the Spawning Ground of Chinese Sturgeon
After the construction of GD, the spawning ground of Chinese sturgeon located just downstream of the GD (Yichang reach) was the only natural one that had been found ( Tao et al., 2009 ). Thus it is crucial to retain the availability of this spawning ground for the sustainability of this critically endangered species.
Researches showed that sturgeons were selective in their spawning ground, and the specific spawning locations were generally around the sharp bends of river with complex flow patterns, with hard bed materials, and with water depth ranging from a few meters to 20–30 m ( Paragamian and Wakkinen, 2002 ). Some biologists held that there was a certain relationship between the spawning of Chinese sturgeon and the hydrology as well as the substrate types of the river bottom ( Chang, 1999 ; Zhang et al., 2011 ; Zhou et al., 2014 ). The spawn of Chinese sturgeon requires a series of certain environmental conditions, including water temperature, riverbed topography, substrate, hydrological and hydraulic conditions etc. ( Zhang et al., 2011 ; Shen et al., 2018 ). It was found that the preferred flow velocity and suspended sediment concentration for the spawning of Chinese sturgeon were in the range of 1.0–1.7 m s –1 and 0.2–0.3 kg m –3 , respectively ( Yang et al., 2007b ). Considering the water depth, the Chinese sturgeon appears more frequently in 6–15 m, regardless of whether it is male or female ( Yang, 2007 ).
Among the influencing factors, the topography of the riverbed plays a key role, as the change of it could lead to the variations of substrate, hydrological and hydraulic conditions to a certain extent. According to the results of filed surveys, it was found that the morphology, gradient, and roughness of the Yichang reach had suffered from significant changes due to the erosion by the clean water from the TGR. The channel gradient increased, especially in the upstream section of YZB. The riverbed roughness also increased accordingly. With the erosion of the river cross section, the hydrodynamic force of the reach was weakened, which brought new impacts on the spawning ground of Chinese sturgeon. Good news is that except for the branched section, the adjustment range of riverbed scouring in the Yichang reach was small and stable. Thus, it is expected that as the riverbed topography tends to be stable after more than 10 years of erosion since 2003, the spawning grounds of Chinese sturgeon could also be retained. Thoroughly evaluation of the ecological effects is required in future studies, and necessary measures should be taken to rehabilitate the spawning ground of Chinese sturgeon if the adverse effects on the survival and development of Chinese sturgeon continues.
This work examined the construction of GD and TGD and their impacts on the streamflow, sediment load and channel morphology downstream based on in situ measured data. The operation of the GD reduced sediment inflow to Yichang station and triggered the prevailing scouring of the Yichang reach, which is the only regular spawning ground of Chinese sturgeon after the construction of GD. The impoundment of TGD greatly altered the water-sediment conditions of Yichang reach, which is manifested in the flow process regulation, sharp sediment content reduction, and particle size decrease etc. Thus, the river channel was further eroded, especially in the form of undercutting.
In recent years, channel erosion has been uneven as there are some scour resistant nodes in the reach, such as YZB and MPX. The water surface gradient is controlled by such nodes, and the water level of each section drops unevenly. Overall, the low water surface gradient has decreased. According to the grading of riverbed sediment, the riverbed scouring and armouring in the Yichang reach was basically completed, and the riverbed material has been transformed from sandy gravel to pebble. The channel gradient and riverbed roughness increased with the erosion of the river cross section, especially in the upstream section of YZB. The hydrodynamic force of the Yichang reach was weakened, while the adjustment range of riverbed scouring was small and stable. It is expected that the spawning grounds of Chinese sturgeon could be retained as the riverbed tends to be stable. Further evaluation and necessary steps should be taken considering the influences of clean water erosion and related problems in the downstream ecological.
Data Availability Statement
The original contributions presented in the study are included in the article/supplementary material, further inquiries can be directed to the corresponding author/s.
Author Contributions
YZ was responsible for the writing and design of data analysis. ZL, SY, MS, and CG were responsible for data analysis and discussion. All authors contributed to the article and approved the submitted version.
This research was funded by the National Key Research and Development Program of China (2019YFC1510704 and 2016YFC0402300), the Fundamental Research Funds for Central Public Welfare Research Institutes (CKSF2019246/HL and CKSF2019171/HL), Natural Science Foundation of China (Nos. 51579014, 41906149, and 51609013), and the National Major Hydraulic Engineering Construction Funds “Research Program on Key Sediment Problems of the Three Gorges Project” (12610100000018J129-05).
Conflict of Interest
The authors declare that the research was conducted in the absence of any commercial or financial relationships that could be construed as a potential conflict of interest.
- ^ www.cjw.gov.cn/zwzc/bmgb/
Chang, J. (1999). Structure and dynamics of the spawning stock of Chinese sturgeon, Acipenser sinensis, in the Yangtze River. Doctoral dissertation. Wuhan: Institute of Hydrobiology, Chinese Academy of Sciences, 149.
Google Scholar
Doyle, M. W., and Harbor, J. M. (2003). A scaling approximation of equilibrium timescales forsand-bed and gravel-bed rivers responding to base-level lowering. Geomorphology 54, 217–223. doi: 10.1016/s0169-555x(02)00357-4
CrossRef Full Text | Google Scholar
Friedman, W. R., Osterkamp, M. L., and Scott, G. T. A. (1998). Downstream effects of dams on channel geometry and bottomland vegetation: regional patterns in the great plains. Wetlands 18, 619–633. doi: 10.1007/bf03161677
Guo, C., Jin, Z., Guo, L., Lu, J., and Zhou, Y. (2020). On the cumulative dam impact in the upper Changjiang river: streamflow and sediment load changes. Catena 184, 104250. doi: 10.1016/j.catena.2019.104250
Guo, H., Hu, Q., Zhang, Q., and Feng, S. (2012). Effects of the three gorges dam on yangtze river flow and river interaction with poyang lake, china: 2003-2008. J. Hydrol. 416, 19–27. doi: 10.1016/j.jhydrol.2011.11.027
Guo, L., Su, N., Townend, I., Wang, Z., and He, Q. (2019). From the headwater to the delta: a synthesis of the basin-scale sediment load regime in the changjiang river. Earth Sci. Rev. 197:102900. doi: 10.1016/j.earscirev.2019.102900
Han, J., Sun, Z., Li, Y., and Yang, Y. (2017). Combined effects of multiple large-scale hydraulic engineering on water stages in the middle yangtze river. Geomorphology 298, 31–40. doi: 10.1016/j.geomorph.2017.09.034
Li, D., Lu, X., Chen, L., and Wasson, R. J. (2019). Downstream geomorphic impact of the three gorges dam: with special reference to the channel bars in the middle yangtze river. Earth Surface Proc. Landforms 44, 2660–2670. doi: 10.1002/esp.4691
Li, Q., Yu, M., Lu, G., Cai, T., Bai, X., and Xia, Z. (2011). Impacts of the Gezhouba and Three Gorges reservoirs on the sediment regime in the yangtze river, china. J. Hydrol. 403, 224–233. doi: 10.1016/j.jhydrol.2011.03.043
Liermann, C., Nilsson, C., Robertson, J., and Ng, R. Y. (2012). Implications of dam obstruction for global freshwater fish diversity. Bioscience 62, 539–548. doi: 10.1525/bio.2012.62.6.5
PubMed Abstract | CrossRef Full Text | Google Scholar
Paragamian, V., and Wakkinen, V. (2002). Temporal distribution of kootenai river white sturgeon spawning events and the effect of flow and temperature. J. Appl. Ichthyol. 18, 542–549. doi: 10.1046/j.1439-0426.2002.00391.x
Ren, S., Zhang, B., Wang, W., Yuan, Y., and Guo, C. (2021). Sedimentation and its response to management strategies of the three gorges reservoir, yangtze river, china. Catena 199:105096. doi: 10.1016/j.catena.2020.105096
Rinaldi, M., and Simon, A. (1998). Bed-level adjustments in the arno river, central italy. Geomorphology 22, 57–71. doi: 10.1016/s0169-555x(97)00054-8
Shen, Y., Wang, P., Wang, C., Yu, Y., and Kong, N. (2018). Potential causes of habitat degradation and spawning time delay of the chinese sturgeon ( acipenser sinensis ). Ecol. Infor. 43, 96–105. doi: 10.1016/j.ecoinf.2017.11.002
Tao, J., Qiao, Y., Tan, X., and Chang, J. (2009). Species identification of chinese sturgeon using acoustic descriptors and ascertaining their spatial distribution in the spawning ground of Gezhouba Dam. Chinese Sci. Bull. 54, 3972–3980. doi: 10.1007/s11434-009-0557-9
Wang, C., Kynard, B., Wei, Q., Du, H., and Zhang, H. (2013). Spatial distribution and habitat suitability indices for non-spawning and spawning adult chinese sturgeons below gezhouba dam, yangtze river: effects of river alterations. J. Appl. Ichthyol. 29, 31–40. doi: 10.1111/jai.12094
Xia, J., Deng, S., Zhou, M., Lu, J., and Xu, Q. (2017). Geomorphic response of the Jingjiang Reach to the Three Gorges Project operation. Earth Surface Proc. Landforms 42, 866–876. doi: 10.1002/esp.4043
Yang, H., Yang, S., Xu, K., Milliman, J., Wang, H., Yang, Z., et al. (2018). Human impacts on sediment in the Yangtze river: a review and new perspectives. Global Planetary Change 162, 8–17. doi: 10.1016/j.gloplacha.2018.01.001
Yang, S., Milliman, J., Xu, K., Deng, B., Zhang, X., and Luo, X. (2014). Downstream sedimentary and geomorphic impacts of the three gorges dam on the yangtze river. Earth Sci. Rev. 138, 470–486.
Yang, S., Zhang, J., and Xu, X. (2007a). Influence of the three gorges dam on downstream delivery of sediment and its environmental implications, yangtze river. Geophy. Res. Lett. 34:L10401.
Yang, D., Wei, Q., Chen, X., Liu, J., Zhu, Y., and Wang, K. (2007b). Hydrology status on the spawning ground of Acipenser sinensis below the Gezhouba Dam and its relation to the spawning run. Acta Ecologica Sinica 27, 862–869. doi: 10.1016/s1872-2032(07)60023-7
Yang, Y. (2007). Study on hydraulic characteristics of Chinese sturgeon habitat in Yangtze river. Nanjing: Hohai University.
Yuan, W., Yin, D., Finlayson, B., and Chen, Z. (2012). Assessing the potential for change in the middle Yangtze River channel following impoundment of the three gorges dam. Geomorphology. 147, 27–34. doi: 10.1016/j.geomorph.2011.06.039
Yuan, X., Tian, F., Wang, X., Liu, Y., and Chen, M. (2018). Small-scale sediment scouring and siltation laws in the evolution trends of fluvial facies in the ningxia plain reaches of the yellow river (NPRYR). Quat. Int. 476, 14–25. doi: 10.1016/j.quaint.2018.03.034
Zhang, H., Wei, Q., Kynard, B., Du, H., Yang, D., and Chen, X. (2011). Spatial structure and bottom characteristics of the only remaining spawning area of chinese sturgeon in the yangtze river. J. Appl. Ichthyol. 27, 251–256. doi: 10.1111/j.1439-0426.2011.01708.x
Zhang, Q., Singh, V. P., Xu, C., and Chen, X. (2013). Abrupt behaviours of streamflow and sediment load variations of the yangtze river basin, china. Hydrol. Process 27, 444–452. doi: 10.1002/hyp.9278
Zhang, W., Yang, Y., Zhang, M., Li, Y., Zhu, L., You, X., et al. (2017). Mechanisms of suspended sediment restoration and bed level compensation in downstream reaches of the Three gorges projects (TGP). J. Geographic Sci. 27, 463–480. doi: 10.1007/s11442-017-1387-3
Zhou, J., Zhang, H., Song, L., Bi, S., and Zhao, Y. (2014). Assessing the effect of the three gorges reservoir impoundment on spawning habitat suitability of chinese sturgeon (acipenser sinensis) in yangtze river, china. Ecol. Infor. 20, 33–46. doi: 10.1016/j.ecoinf.2014.01.008
Zhou, M., Xia, J., Lu, J., Deng, S., and Lin, F. (2017). Morphological adjustments in a meandering reach of the middle yangtze river caused by severe human activities. Geomorphology 285, 325–332. doi: 10.1016/j.geomorph.2017.02.022
Zhou, Y., Lu, J., Chen, L., and Ren, J. (2018). Bed roughness adjustments determined from fractal measurements of river-bed morphology. J. Hydrodynamics 30, 882–889. doi: 10.1007/s42241-018-0101-y
Zhuang, P., Zhao, F., Zhang, T., Chen, Y., Liu, J., Zhang, L., et al. (2016). New evidence may support the persistence and adaptability of the near-extinct chinese sturgeon. Biol. Conser. 193, 66–69. doi: 10.1016/j.biocon.2015.11.006
Keywords : Three Gorges Reservoir, Chinese sturgeon, spawning grounds, riverbed evolution, Yangtze river
Citation: Zhou Y, Li Z, Yao S, Shan M and Guo C (2021) Case Study: Influence of Three Gorges Reservoir Impoundment on Hydrological Regime of the Acipenser sinensis Spawning Ground, Yangtze River, China. Front. Ecol. Evol. 9:624447. doi: 10.3389/fevo.2021.624447
Received: 31 October 2020; Accepted: 22 January 2021; Published: 11 February 2021.
Reviewed by:
Copyright © 2021 Zhou, Li, Yao, Shan and Guo. This is an open-access article distributed under the terms of the Creative Commons Attribution License (CC BY) . The use, distribution or reproduction in other forums is permitted, provided the original author(s) and the copyright owner(s) are credited and that the original publication in this journal is cited, in accordance with accepted academic practice. No use, distribution or reproduction is permitted which does not comply with these terms.
*Correspondence: Zhijing Li, [email protected] ; Chao Guo, [email protected] ; [email protected]
Disclaimer: All claims expressed in this article are solely those of the authors and do not necessarily represent those of their affiliated organizations, or those of the publisher, the editors and the reviewers. Any product that may be evaluated in this article or claim that may be made by its manufacturer is not guaranteed or endorsed by the publisher.
Thank you for visiting nature.com. You are using a browser version with limited support for CSS. To obtain the best experience, we recommend you use a more up to date browser (or turn off compatibility mode in Internet Explorer). In the meantime, to ensure continued support, we are displaying the site without styles and JavaScript.
- View all journals
- Explore content
- About the journal
- Publish with us
- Sign up for alerts
- Open access
- Published: 15 November 2017
Influence of Large Reservoir Operation on Water-Levels and Flows in Reaches below Dam: Case Study of the Three Gorges Reservoir
- Yunping Yang 1 , 2 ,
- Mingjin Zhang 1 ,
- Lingling Zhu 3 ,
- Wanli Liu 1 ,
- Jianqiao Han 4 &
- Yanhua Yang 1
Scientific Reports volume 7 , Article number: 15640 ( 2017 ) Cite this article
10k Accesses
82 Citations
2 Altmetric
Metrics details
- Natural hazards
The Three Gorges Project (TGP) is the world’s largest water conservation project. The post-construction low-flow water level at the same discharge below the dam has declined, but there remains disagreement over whether the flood level has increased. Measured water levels and upstream and downstream flow data from 1955 to 2016 show that, post-construction: (1) the low-flow water level at the same discharge decreased, and the lowest water level increased due to dry-season reservoir discharge; (2) the decline of the low-flow water level below the dam was less than the undercutting value of the flow channel of the river; (3) the flood level at the same discharge below the dam was slightly elevated, although peak water levels decreased; (4) flood characteristics changed from a high discharge–high flood level to a medium discharge – high flood level; and (5) an expected decline in the flood level downstream was not observed. Channel erosion and the adjustment of rivers and lakes tend to reduce flood levels, while river bed coarsening, vegetation, and human activities downstream increase the flood level. Although the flood control benefits of the Three Gorges Dam (TGD) and the upstream reservoirs are obvious, increased elevation of the downstream flood level remains a concern.
Limnological effects of a large Amazonian run-of-river dam on the main river and drowned tributary valleys

Buffering the impacts of extreme climate variability in the highly engineered Tigris Euphrates river system

Opportunities to curb hydrological alterations via dam re-operation in the Mekong
Introduction.
The huge storage capacity of a river-reach reservoir changes downstream flows and water quantities, intercepts downstream transportation of sediment, and leads to river erosion, water-level adjustments and other impacts, as stream reaches below the dam adapt to the discharge change and the sharp reduction in sediment supply. After construction of the Aswan Dam on the Nile River in Egypt, the average river channel undercut was 0.45 m, and the flow level at the same discharge showed a declining trend 1 . After the establishment of a reservoir on the Missouri River in the United States, the low water level dropped by more than 2.5 m, and the flood level increased by almost 1 m in the lower reaches around Kansas City 2 . In 2011, the Mississippi River flooded with a discharge lower than that measured during the 1927 and 1973 floods 3 , but due to the backwater caused by dense vegetation in higher parts of the floodplain, the flood level increased 4 , resulting in conditions of medium discharge but a high water level. Following r construction of the Danjiangkou Reservoir on the Hanjiang River in China, when the downstream discharge at Huangjiang port and Xiangfan Hydrological Station is less than 5,000 m 3 /s, the water level decreaseds by 1.5–1.7 m relative to pre-construction levels. When the discharge exceeds 10,000 m 3 /s, however, water levels are not significantly reduced compared to pre-construction values 5 . A review of the literature 6 , 7 indicates that following the construction of a reservoir, the low-water level below the dam decreases at the same discharge, while the flood level at the same discharge does not change significantly or increases only slightly, although this will vary due to the different hydraulic factors for different rivers.
The Three Gorges Project (TGP) is the largest comprehensive water conservation project in the world 8 . It has considerable comprehensive benefits, such as flood control, power generation, shipping, water supply, and energy savings 9 . The influence of its construction and operation on the regulation of the downstream river, flood water levels and other important factors has attracted significant attention from researchers. The low-flow water level downstream of the Three Gorges Dam (TGD) is decreasing 10 , 11 , which is consistent with predictions 12 , 13 and also with the decline of the low-flow water level downstream of the world’s other large reservoirs 6 , 7 . At these large reservoirs, downstream flood levels generally increase only slightly or do not change significantly 6 , 7 . As of yet, there is no common understanding of the variation in the downstream flood level before and after construction of the TGD, and it is not certain whether data show a decrease in the downstream flood level 14 ,a small or non-significant increase 15 , or a rising trend 16 , 17 .
Recent studies have shown that, at times when the river downstream of the TGD was actively eroding, the flood level was not reduced. Instead, the flood diversion from the Jingjiang reach to Dongting Lake decreased, and the flood discharge capacity declined further 16 . Comparing the 2003–2013 and 2000–2002 periods, when the flow rate at Hankou Station was 50,000 m 3 /s, the corresponding increase in the water level was 0–1.0 m 17 . During July 2016, flood control water levels were exceeded at the lower sections of Jianli Station in the middle and lower reaches of the Yangtze River, and also at Dongting Lake and Poyang Lake. The total alarm period was 12 to 29 days, the longest since 1999, and in the reach from Hankou to Datong reach and Poyang Lake, the water level was the highest measured since 1999 18 . In 1954 and 1998, the maximum flow rate at Luoshan Station was 78,800 m 3 /s and 67,800 m 3 /s, respectively, and the corresponding water levels were 33.17 m and 34.95 m. Comparing 1954 and 1998, the maximum flow rate had decreased by 11,000 m 3 /s, and the water level had increased by 1.78 m 19 . In 2016, the maximum flow rate at Luoshan Station was 52,100 m 3 /s and the corresponding water level was 34.86 m, indicating that the flow rate had decreased by 15,700 m 3 /s and the water level had decreased by 0.09 m in comparison with those of 1998. After construction of the Three Gorges Reservoir (TGR), a consensus was reached that the lowest water level at the same discharge had decreased. Although it remains controversial whether the flood level has increased, it is necessary to study the characteristics, regularity, and genesis of the changes of the flood level downstream of the TGD. In general, siltation of the shoreline, decline of the branch river, shrinkage of the flood channel, and increased resistance in the river channel caused by coarsening of the river bed and encroachment of vegetation into the river channel are the main factors affecting flood-level elevation 20 , 21 . Following construction of the TGR, the erosion downstream of the dam intensified 22 , and the impact of factors, such as the coarsening of the river bed 23 , 24 , the variation in the number of days of floodplain inundation 23 , and the effects of human activities 25 , 26 , on the flood level is apparently increasing. Therefore, it is very important to conduct the relevant analysis as soon as possible.
The present study uses measured data from the period 1955–2016 to analyse the variation and regularity of the flood level and the low-flow water level below the TGD and to discuss the underlying causes, clarifying the relationship between changes in the low-flow water level and the increase of waterway depth, and the relationship between the change in the flood level and flood-control scenarios. The results obtained in this study provide important reference points for further optimization of the joint control of the TGR and the upstream cascade reservoirs, and prediction of the flood-control scenarios, well in advance of flood events.
Study area and dispatching process of the runoff at the TGR
On the Yangtze River, the main stream above Yichang is the upper reach, with a length of 4,504 km. The middle reaches extend for 955 km from Yichang to Hukou, in which the section Zhicheng – Chenglingji is known as the Jingjiang Reach, which is further divided into the Upper Jingjiang Reach (UJR) and the Lower Jingjiang Reach (LJR) at Ouchikou. The river below Hukou is the lower reach, which is 938 km long (Fig. 1 ). The length of the Yichang–Datong reach of the Yangtze River downstream from the TGR is 1,183 km. The Yichang–Dabujie segment is a sandy cobble reach, 116.4 km long, while downstream from Dabujie is a sandy reach of 1,066.4 km (Fig. 1b ). The main stream of the river in the study area includes the hydrological stations at Yichang, Zhicheng, Shashi, Jianli, Luoshan, Hankou, Jiujiang, and Datong. Flood diversion channels to Dongting Lake include Songzikou, Taipingkou, and Ouchikou, which are known as the three mouths of Dongting Lake. The Xiangjiang, Zishui, Yuanjiang, and Lishui Rivers converge at Dongting Lake and are known as the Four Rivers of Dongting Lake. The Chenglingji Hydrological Station controls the discharge from Dongting Lake into the main stream of the Yangtze River. The Hanjiang River confluence is controlled by Huangzhuang Station. Hukou Station controls the discharge to the river from Poyang Lake, which is fed by the Xiushui, Ganjiang, Fuhe, Xinjiang, and Raohe Rivers, known as the Five Rivers. The impact of the TGR is most significant in the Yichang–Datong reach, which corresponds to the middle and lower reaches of the Yangtze River.

Location map ( a ), and detailed study area ( b ), with hydrologic distribution. Note: The figure shows: ( a ) the geographical location of the Yangtze River reaches, and the study area; ( b ) the study area in more detail, including the length of the reaches, the location of the hydrological stations mentioned in the text, and the compositional information of the riverbed geology; and ( c ) the main water system of the study area. (YZR denotes Yichang to Zhicheng Reach (61 km); UJR denotes Upper Jingjiang Reach (175 km); LJR denotes Lower Jingjiang Reach (173 km); CHR denotes Chenglingji to Hukou Reach (546 km); HHR denotes Hukou to Datong Reach (228 km). Figure 1 Location map ( a ), and detailed study area ( b ), generated using AutoCAD 2009. Then Fig. 1 ( a ), ( b ) and ( c ) were joined by the software of CorelDRAW X6.
Data sources
The hydrological stations involved in this study are Yichang, Zhicheng, Shashi, Jianli, Luoshan, Hankou, Jiujiang, and Datong. Also involved are the three diversion channels to Dongting Lake, and the discharge channels from the Dongting and Poyang lakes, respectively controlled by the Chenglingji and Hukou stations. Runoff rates, flow rates, sediment transport data, and water-level data for the period 1955–2016 were collected from each of the hydrological stations. Deposition, erosion, and cross-section data were collected from the Yichang–Hukou segment from 1987 to 2014. Water-level data were collected along the Yichang–Hankou segment from 1981 to 2016. Information on the depth and width of the shipping channel from 2002 and 2015 was also collected. Data collection times vary, but all data sets end within the past three years, and so include recent information. Table 1 shows the source of each type of data.
Flow regulation of the TGR
The TGR began impounding water in June 2003, reaching an impoundment level of 175 m in three separate stages (Fig. 2 ): (1) June 2003–September 2006; (2) October 2006–September 2008; and (3) October 2008–present. These are distinguished as the cofferdam stage, initial stage, and pilot impoundment stage, with corresponding water retention levels of 135–139 m, 144–156 m, and 145–175 m, respectively. Regulation of water level in the TGR is based on flood peak reduction and drought flow recharge. Thus, during the flood season, the upstream flood peak is drastically reduced to alleviate the pressure of downstream flood prevention, and during the drought season, the discharge is supplemented with the goal of alleviating downstream drought conditions, while increasing channel depth and improving its ecology. Since reaching the 175 m pilot retention stage in 2009, both flood peak reduction and runoff recharge for drought season have become increasingly important. For example, in 2010 the maximum reduction of peak flow reached 30,000 m 3 /s, which ensured that the reservoir discharge rate did not exceed 40,000 m 3 /s. Since 2009, the number of drought season runoff recharge days has increased every year; it reached 189 days during the period between 2015 and 2016, indicating that the flow recharge regulation lasted for more than half of the year (Table 2 ).

Inflow and outflow during the pilot impoundment stage of the TGR, showing the runoff regulation process (2009–2016).
Changes in the flood and low-flow water levels in the reaches below the TGD
Variation of the highest and lowest water level.
The TGR reduces the peak flow so that the corresponding flood level decreases, while allowing an increase in the low-flow water level during the dry season 27 , 28 . The highest and lowest water levels in the reaches below the dam after reservoir construction show the combined effects of reservoir runoff regulation, climate change, channel scouring and silting, human activities and other factors. The occurrence of extremely low runoff and water levels cannot be attributed entirely to the reservoir, climate change is not a negligible factor 29 , 30 .
Minimum water levels
Before construction of the TGR, there was a fluctuating downward trend of minimum water levels at the Yichang, Zhicheng, and Shashi hydrological stations, and the corresponding minimum discharge did not change significantly. After impoundment began at the TGR, the annual minimum water level and minimum flow began to increase (Fig. 3a,b, and c ). The Yichang, Zhicheng, and Shashi stations showed a decreasing trend in the corresponding water levels at the same flow rate in the 4 time periods of 1955–1968, 1969–1987, 1988–2002, and 2003–2016. The minimum water levels and minimum flow rates at Luoshan Station and Hankou Station increased steadily, both before and after the TGP was implemented (Fig. 3d and e ). This change is related to the decrease of the shunt flow volumes of the three outlets of Dongting Lake along the south bank during the same period 31 . The increase or decrease in the corresponding water levels at the same flow rate at Luoshan and Hankou stations in the 4 time periods of 1955–1968, 1969–1987, 1988–2002, and 2003–2016 was not significant.

Minimum water levels and corresponding flows at the hydrologic stations downstream of the TGD.
Maximum water levels
Changes in the maximum water level are shown in Fig. 4 . Before the impoundment at the TGR, the highest water level at Yichang, Zhicheng, and Shashi stations showed fluctuating but generally decreasing trends. After impoundment began, there was no significant trend, but the maximum water levels measured were lower than the pre-impoundment maxima. Before construction of the TGR, the maximum water levels at Luoshan Station and Hankou Station increased slightly, but there was no significant elevation change post-construction. A comparison between the water levels during the 2003–2016 period with the water levels corresponding to the same flow rates before construction of the TGR shows that post-construction water levels were all elevated, and the expected decline did not occur.

Maximum water levels and corresponding flows at the hydrologic stations downstream of the TGD.
Variation of water levels at the same discharge
The years 1998, 2003, 2010 and 2016 were selected as representative years (Fig. 5 ), during which the water levels of the dry-season discharges dropped, while discharges during the flood season showed an increasing trend. For each station, there is a critical discharge below which a declining trend is observed, while discharges greater than this value increased over time. Comparing the 2010–2016 and 2003–2010 periods, the value of this critical discharge showed a decreasing trend, indicating that the flood characteristics had changed from a high discharge and high flood water level to a moderate flood discharge and high flood water level.

Relationship between the water level and flow in reaches below the TGD.
Reasons for the variation in the flood and low-flow water levels and their influence on the flood control situation and channel water depth
Analysis of the causes of the variation of the flood and low-flow water levels.
Before and after construction of the TGR, the adjustment trends of the low-flow water level and flood level of the river channel were different, suggesting that the influentian factors driving the variation of these water levels were also different. After the impoundment was completed, scouring in reaches below the dam mainly occurred as a result of the basic flow channel, and the expansion of the water area below the low-flow water level was the main factor driving the water-level decline 10 . In addition to exceptional reasons, such as elevation of the erosion datum by sedimentation and flooding at the confluence with tributaries, the increase in river channel resistance due to the coarsening of the bed and increased growth of vegetation in the river channel are the major factors leading to higher flood levels at the same discharge 20 , 21 . Due to the combined effect of natural and human factors, the decrease in the water level corresponding to the same flow was greater than the increase in water level. The water level with the same flow exhibited a decreasing trend, which should otherwise have increased. Based on this concept, we analysed the effects of changes in any of the influential factors on the drought and flood water-levels under the same flow-rate conditions in the lower reaches of the Three Gorges Dam.
Effect of river channel geometry adjustment
According to the statistics of the Bureau of Hydrology, Changjiang Water Resources Commission, from 1981 to 2002, the volume of erosion of the Yichang to Hukou reach from the basic flow channel was 4.91 × 10 8 m 3 , the sediment volume of the basic flow channel-bankfull channel was 5.05 × 10 8 m 3 , such that the sediment volume of the bankfull channel was 0.14 × 10 8 m 3 , and the average annual sediment volume was 67.23 × 10 4 m 3 (Fig. 6 ). During the period from October 2002 to October 2015, the cumulative volumes scoured from the basic flow channel and the bankfull channel in the Yichang–Hukou reach were 15.16 × 10 8 m 3 and 15.88 × 10 8 m 3 , respectively, the annual scouring amounts were 1.16 × 10 8 m 3 and 1.22 × 10 8 m 3 , respectively, and 95.46% of the river erosion occurred in the basic flow channel (Fig. 6 ). Before construction of the TGR, sediment deposition in the middle and lower reaches of the Yangtze River was the main reason for the increasing flood level at the same discharge 15 , 32 . After construction of the TGR, erosion in reaches below the dam (Fig. 6 ) could reduce the flood level in theory, but the trend of river bank erosion was opposite to the elevation of the flood level at the same discharge, indicating that river erosion did not cause the decrease in the flood level. The maximum discharge and water levels at the Yichang and Zhicheng stations, both within the sandy cobble reach, were reduced (Figs 3 and 4 ). Even if the flood level increased at the same discharge, the pressure on flood control systems in this section was effectively weakened, due to runoff regulation by the TGR. The increase in the area of the river channels in the upper reaches and the reach-scale bankfull channels of the lower reaches of the Jingjiang reach 22 were conducive to the release of more floods waters. The cross-sectional geometry shows that the shape of the channel above bankfull was not significantly changed (Fig. 6 ). Dongting Lake and Poyang Lake are downstream of the middle and lower reaches of the Yangtze River, and variations in the lake volume will also affect the main channel flood level. Therefore, when analysing the factors causing the increasing flood level at the same discharge in the main stream of the Yangtze River, we must consider the relationship between the river and lakes, human activities, beach vegetation above the bankfull channel and controls in the watershed.

Erosion and deposition changes in the channels of the Yichang–Hukou reach.
The Influence of River and Lake Diversion
Net siltation occurred in the Dongting Lake region from 1960 to 2006, but the overall balance shifted to scouring from 2007–2015. In the Poyang Lake region, there was alternating siltation and scouring from 1960 to 1999, but from 2000 to 2015, there was a tendency for increased scouring (Fig. 7 ). Both lakes receive sediment scoured from upstream rivers 15 , 32 . Before construction of the TGR, the siltation and flooding capacity in the Dongting Lake area decreased, and the flood discharge capacity of the main stream increased, but this did not lead to higher flood levels at the same discharge. Sedimentation of the Luoshan–Hankou reach was the main cause of flood level elevation at the same discharge 15 , 32 . After construction of the TGR, the trend towards increasing erosion in the Dongting Lake and Poyang Lake was reduced, the area flooded during the flood season was reduced 33 , and the storage volume of the lakes was somewhat increased, reducing the contribution of the lakes to floods and reducing the pressure on flood-control measures along the main stream. Flow rates at the entrances to the river control the influence of the lakes on flooding in the main stream and determine whether flooding in the middle and lower reaches of the river is comprised of upstream flood water or a combination of lake water and upstream flood water. However, the flow rate is not the main determinant of fixed flow-rate flood water levels.

Sedimentation in Dongting Lake and Poyang Lake.
Sedimentation in Dongting Lake and Poyang Lake can be expressed as follows:
Effect of beach vegetation
Beach vegetation can help prevent erosion of riverbanks and maintain river bed stability 34 . It also increases flow resistance and thereby decreases the speed of the flow, which increases the water level and affects flood prevention to a certain extent 35 . The Mississippi River in the United States flooded in 2011. Flow rates during that flood were lower than those in the floods of 1928 and 1973 3 . Lush vegetation at higher elevations in the flood plain (corresponding to high beach areas) caused backwater that further increased the flood water level 4 . This led to localized “medium flood flow rate, high flood water level” conditions. Figure 8 shows the number of days per year that the flow rate exceeded 30,000 m 3 /s in 2009–2015 and in 2016 after water was stored in the TGR compared to that in 2003–2008. Over the 2009–2015 period, the number decreased slightly overall, but in 2016, it increased considerably at Luoshan and further downstream (Fig. 8 ). Flooding occurred in the lower reaches of Luoshan and in the middle reaches of the Yangtze River in 2016, and water inundated the floodplain for a longer period of time. Prior to this, the number of days of flooding was low, and the vegetation on the beach was relatively lush, which increased the river flood capacity to flood level. In the Zhicheng – Chenglingji River section, due to the combined effects of peak cutting by the TGR and diversions to Dongting Lake, the floodplain rarely flooded, and thus Jingjiang reach flood control security was guaranteed. In 2016, the flow rate in the Hankou – Jiujiang reach was high, due to flows from the Daoshui, Jushui, Bahe, and Xishui tributaries. These tributaries caused the flow rate in the main stream to rise by as much as 24,800 m 3 /s (measured on June 30, 2016, as the difference between the flow rates at Jiujiang and Hankou stations). This partially explains why the flood water level at Hankou was high in 2016. The channel-boundary node protruding from river bank of the Wuhan–Jiujiang reach is a hindrance to flooding 36 , and when the Wuhan–Jiujiang reach discharge is ≥50,000 m 3 /s, the Tianjiazhen node blocks the discharge of upstream flooding for 2 to 3 days 37 , which also leads to a high flood level capacity, and is one of the reasons for the high flood level of this section.

The regulatory effect of the TGR and the change in the number of days of flooding.
Influence of shoreline control, waterway management, and other human activities
The Jingjiang reach is a major flood control region in the middle reaches of the Yangtze River and is regarded by many to be the most dangerous part of the Yangtze, as river bank collapses occur occasionally 22 . There are ports, wharves, bridges, and scenic works all along the banks of the middle and lower reaches of the Yangtze River, and these occupy portions of the flood control zone and narrow the flood channel. After the floods of 1998, the water conservancy department strengthened and improved the prevention and control embankments on the middle and lower reaches of the Yangtze River, and the flood control capacity of the embankment was increased by 0.51–3.00 m (Table 3 ). The total number of embankment collapses in 2016 was only 0.51% of that in 1998 18 , and there was no greater risk (Table 4 ), indicating that embankment reinforcement and improvement can effectively reduce flooding.
The middle and lower reaches of the Yangtze River have always had the reputation of being a “golden waterway”. During the period from 2003 to 2015, the Yangtze River Waterway Bureau implemented a targeted waterway regulation project. For the sand and cobble river sections, the project goal was to protect the bottom of the river, to prevent the water level in the channel from dropping as a result of further erosion. For sandy river sections, the goal was mainly to protect the bank beaches and central beaches, and protection or adjustment works were carried out at the low beaches of the centre and sides of the Yangtze River and its tributaries. At the same time, to improve the boundary stability, shoreline reinforcement or revetment works were implemented, and the flood storage capacity was somewhat improved by the comprehensive engineering project. In a June 2015 report, the Changjiang River Scientific Research Institute (CRSRI) 38 showed that after remediation of 29 shipping obstructions, 10 sections of beach had a maximum hydraulic resistance of 5–12.2%, and 19 sections of beach had a hydraulic resistance of 0–5%. In seven sections of beach, maximum flood water levels were elevated by 5–12.4 cm, and in 22 sections of beach, maximum flood water levels were elevated by 1–5 cm. Single projects have limited impact on overall flood control, but the combined influence of all bridges and wharves has a significant impact on flood water levels and adversely affects flood control in the channel 39 , 40 .
Effect of river bed coarsening
A rougher river bed increases a river’s hydraulic resistance, and raises water levels. After water was stored in the TGR, the river bed downstream became rougher 23 , 24 . The median grain size (D 50 ) of the surface of the river bed between Yichang and Zhicheng increased by a factor of 48, i.e., from 0.638 mm in December 2003 to 30.4 mm in October 2010. Between Zhicheng and Dabujie, the D 50 value increased by a factor of 20. The roughness increased by 91%, 65%, 3%, and 2% in reaches below the TGD from Yichang to Zhicheng (distance to Yichang is approximately 61 km), from Zhicheng to Dabujie (61 km to 116.4 km), in the upper Jingjiang reach (116.4 km to 319 km), and from Chenglingji to Hukou (319 km), respectively (Table 5 ).
Mathematical model calculations 40 show the following: in the pebble and gravel Yichang–Dabujie reach of the river, after coarsening of the river bed, the water levels corresponding to Yichang flow rates of 5,000 m 3 /s, 10,000 m 3 /s, 23,000 m 3 /s, and 35,000 m 3 /s increased by an average of 1.57 m, 2.04 m, 2.7 m, and 3.3 m, respectively. These values are higher than the actual drop in the water level due to the increased channel depth corresponding to each flow rate increase. This explains how coarsening of the river bed effectively mitigated low water-level drops in this pebble and gravel section of the river. In the sandy reaches downstream from Dabujie, the average increases in the water level corresponding to Yichang flow rates of 5,000 m 3 /s, 10,000 m 3 /s, 23,000 m 3 /s, and 35,000 m 3 /s were 0.13 m, 0.11 m, 0.16 m, and 0.16 m, respectively. These increases were limited relative to the effects of undercutting.
Based on the above analysis, changes in the drought water-level for the same flow were as follows: before and after the impoundment of the TGR in the Yichang-Zhicheng and Upper Jinjiang Reach, river channel erosion was the main cause of the decreased drought water-level; in the Lower Jingjiang Reach, Chenglingji-Wuhan, and Wuhan-Hukou reach, river channel sedimentation before the impoundment developed into erosion after the impoundment, and because the decrease in water level caused by channel erosion was similar to that caused by channel coarsening, there was no obvious trend in the same-flow drought water level. The changes in the flood water-level under the same flow-rate were as follows: Before and after the abovementioned impoundment, the Yichang-Zhicheng and Upper Jingjiang Reach exhibited a continuous erosion trend; the Lower Jingjiang, Chenglingji-Wuhan, and Wuhan-Hukou Reach changed from sedimentation to erosion; and the trend in the flood water level under the same flow-rate was inconsistent with the channel erosion trend, which indicated that channel erosion was not the main reason for the increased flood water-level under the same flow-rate.
The confluence points of the Dongting and Poyang Lakes only influenced water levels close to the intersections and had a minor influence on the mainstream flood water-levels under the same flow-rate. Moreover, lake erosion improved the regulation of lakes and weakened the contribution of Lake Flood water to the mainstream runoff, thus helping to alleviate the flood control pressure of the Yangtze River mainstream. After the impoundment of the TGR, the duration of the flow rate exceeding the bankfull elevation downstream of the dam decreased, increasing the exposure time of the area above the bankfull channel and, in turn, allowing the shore vegetation to flourish. This resulted in an increased flood water-level under the same flow-rate due to the backwater effect.
However, this is not unique to the Yangtze River. The importance of this effect is illustrated by the Mississippi River floods in 2011. The combined effect of river channel erosion, waterway engineering, and river regime control engineering caused riverbed coarsening, which further accelerated the increase of the same-flow flood water-level. Substantial waterways, river regime control, and shoreline engineering were implemented in the middle and lower reaches of the Yangtze River, which significantly reducing the floodwater river width. Although the effects of individual projects are small, the combined effect of many can contribute towards the upward trend in the same-flow flood water-level.
Relationship between changes in low water levels and siltation and scouring of the channel
The predict show that after 40 years (2005–2045) of impoundment 13 , when the flow (Q) at Yichang Station 20,000 m 3 /s, the low-flow water level in the 700 km reach below the dam will have a decreasing trend. An examination of the depth of the channel in a 410 km section of the river downstream from the TGR in October 2014 showed an average undercutting of 1.50 m compared with October 2002. Further downstream, alternating siltation and scouring occurred at several locations during this same period (Fig. 9a ). On average, the low-flow water level in the 240 km downstream from the TGR was 1.10 m lower in the 2003–2014 period compared with 1981–2002; further downstream, the low-flow water levels rose on average when compared with the low-flow water level from 1981–2002. Undercutting was concentrated in the Yichang–Zhicheng reach and in the upper and lower sections of the Jingjiang reach, and low water level decreases mainly occurred in the Yichang–Zhicheng reach and the upper section of the Jingjiang reach (Fig. 9b ). In the immediate future, undercutting in the lower sections of the Jingjiang reach should be controlled to prevent low water levels from dropping.

Downstream thalweg and water level elevations before and after construction of the TGR. Note: ( a ) depths are from a selected number of cross-sections along the Yichang – Hukou river section, with a spacing of generally 200–500 m. The thalweg depth is the deepest point of the cross-section. In the case of multiple waterways, the main channel of the multiple waterways is selected; ( b ) water levels (98% highest water level) measured relative to the waterway datum during 1981–2002 and 2003–2014, and the difference in elevation between these periods.
Since water has been stored at the TGR, the depth of the waterway has been controlled mainly by erosion. To prevent adverse effects, such as shoreline collapse, beach and shoal atrophy, and reduction of flow in the main waterway during the dry season, the Yangtze Waterway Bureau carried out systematic waterway remediation work in the middle and lower reaches of the Yangtze from 2003 to 2015. As a result, the depth of the waterway increased by 0.50 to 0.60 m in the Yichang–Chenglingji, Chenglingji–Wuhan, Wuhan–Anqing, Anqing–Wuhu, and Wuhu–Nanjing reaches, from 2.9 m, 3.2 m, 4.0 m, 4.5 m, and 6.0 m (2003) to 3.5 m, 3.7 m, 4.5 m, 6.0 m, and 9.0 m (2015), respectively (Fig. 10 ). The width of the waterway also increased significantly. Thus, by 2015, the dimensions of the waterway had already increased to the target dimensions for 2020 41 , 42 .

Change in the depth and width of waterway from Shuifu to Yangtze Estuary. (Note: The water depth and width of the waterway are the values of the main waterway).
Impact of changing flood water levels on flood control conditions in the middle reaches of the Yangtze River
Wuhan is the key city for flood control in the middle reaches of the Yangtze River. Using Hankou Station as an example, during the period from 2003 to 2016, the flood control water level was exceeded in both 2010 and 2016. The highest water level in 2010 exceeded the flood control water level by 1 cm, while the water level exceeded the flood control water level by 107 cm on 7 July 2016; this is the 5 th highest water level since 1870. The discharge corresponding to the flood control water level in different years has recently been recalculated (Fig. 11 ), and the discharge at the flood control water level at Yichang Station, Luoshan Station, Hankou Station and Datong Station declined, whereby the flood-alarm discharge in 2016 compared with 1998 reduced by 8,800 m 3 /s, 8,400 m 3 /s, 5,600 m 3 /s and 2,600 m 3 /s, respectively. The discharge in 2016 also showed a decreasing trend compared with 2003. Jianli and Jiujiang stations were affected by the backwater effect at the outflow points of both Dongting and Poyang Lakes. The water-level and flow-relationship curve (Fig. 5 ) shows a wide flow-fluctuation range corresponding to flood control warning levels, and the statistical analysis shows that the minimum flow rate reached the flood control warning level (Fig. 11 ). On the other hand, the flow rate at Jianli station exceeded the minimum flood control warning level, showing an increasing trend, which indicates that the influence of Dongting Lake inflow on the mainstream water level weakened. This can be attributed to the combined effect of the Three Gorges Reservoir regulation and the increase in the lake basin capacity. The minimum flow at Jiujiang station also exceeded the flood control warning level due to the increasing trend. However, compared with Jianli station, the trend was relatively weak. Due to the large distance between the station and the TGR, the effect of reservoir regulation was relatively weak, but the increased lake basin capacity was beneficial in reducing the mainstream runoff. In the near-dam section at Yichang Station, due to the peak-cutting effect of the TGR, the discharge flow was drastically reduced, and the number of days exceeding the flood-control water level was also reduced. Before construction of the TGR, siltation of the Luoshan reach was the main reason for the increasing flood level 43 , 44 . However, due to river erosion in the Luoshan-Hankou reach after construction, there was an increase in vegetation and bed resistance and an obvious increase in water capacity, which was the main reason for the change in flood elevation at Luoshan Station, before and after construction of the TGR. A comparison of the periods 2003–2013 and 2000–2002 indicated that when the flow rate at Hankou Station was 50,000 m 3 /s, the corresponding increase in the water level was 0–1.0 m 17 . A comparison between 2016 and 2003 showedthat this elevation trend did not decrease, which is not conducive to flood control in Wuhan.

In July 2016, a major regional flood occurred in the middle and lower reaches of the Yangtze River. Through the use of the TGR and upper reaches of the cascade reservoirs, 22.7 billion m 3 of flood water was intercepted and stored. Consequently, the water levels in the Jingjiang reach, the Chenglingji area, and the lower reaches of Wuhan were reduced by 0.8–1.7 m, 0.7–1.3 m, and 0.2–0.4 m, respectively, and the length of the section was reduced decreased by 250 km, which effectively reduced the pressure on flood-control measures in the Chenglingji reach and Dongting Lake area in the middle reaches of the Yangtze River. Scenarios exceeding the alarm level in the Jingjiang reach and flood diversion to the Chenglingji area were avoided, the safety of the population of the Jingjiang reach was secured, and the integrity of the Yangtze River embankment was guaranteed.
Analysis of water level data from 38 rivers in the United States indicates that dam construction resulted in a reduction in the average annual flood peak discharge of 7.40% to 95.14% 45 . According to the TGR Dispatching Rules, the TGR will regulate small and medium floods 16 , which will effectively alleviate the flood risk in the Yichang–Luoshan River reach. After the flood control standard at the Jingjiang embankment is improved, pressure on flood-control measures on this river section will be greatly reduced. The combined regulating process of the TGD and its upstream cascade reservoirs can not only stop floods with a large flow rate, but also gradually stop floods with low and medium flow rates, resulting in a decrease in the peak value of the outflow during the flood season in the TGD. After a continuous long period, the large flood processes downstream of the TGD will be lost, and the flow process will tend to become uniform throughout the year. With no shaping of river channels due to periods of large flow rates, the flood capacity of the river channels will decrease 16 . Once severe floods occur, especially regional floods in the middle and lower reaches of the TGD due to integrated effects of Dongting Lake, Poyang Lake, Hanjiang River and other tributaries and local rainfall, these floods will be less regulated by the TGD. Without long-term shaping of flood river channels by large floods, the vegetation in the high beach areas will become lush, and silt will gradually accumulate, resulting in increases in integrated resistance of river channels, and the effective flood control capacity will be further reduced 16 .
After the impoundment of the TGR, floods similar to those in 1954 and 1998 did not occur in the middle and lower reaches of the Yangtze River. However, as the discharge corresponding to the flood-control water level reduces, a high flood discharge – high flood level gradually transforms into one of moderate flood discharge – high water level, which should raise concerns of increased flooding. For the near future, issues of flood control and disaster reduction are still highly significant along the Yangtze River, and flood control is still the primary task of development and protection in this area. We should continue strengthening the comprehensive Yangtze River flood control and disaster reduction system and its management, as well as speeding-up the transformation from flood control to flood management and other measures to address flood security issues.
Conclusions
Construction and operation of the TGP have been studied by many researchers. The effect of reservoir operation on the flood and low-flow water levels in the lower reaches and related issues have been the focus of the river management and waterway management departments. Through analysis of measured data from the reaches below the TGD over the period 1955–2016, the following conclusions have been drawn:
The low-flow water level at the same discharge in the reaches below the TGD declined, an effect also observed in downstream water levels of other large dams around the world. Due to the compensating effect of the reservoir during dry seasons, the discharge at low-flow water levels is increased and the lowest water level showed an increasing trend. At the channel scale, the decline in the low-flow water level in the reaches below the TGD is less than the undercutting value of the basic flow channel. Governed by the action of such a large-scale waterway regulation project, water depths in the reaches below the dam have been improved, and the proposed objective for 2020 has been achieved five years in advance.
The flood water level at the same discharge increased slightly in the channels below the TGD. The flood characteristics had a tendency to change from a high flood discharge-high flood level to a moderate discharge-high flood level, which is not conducive to flood safety. Peak cutting by the reservoir reduced the highest water levels downstream. For example, during the regional flood of July 2016, the flood height in the reaches below the dam (based on flood heights and flows prior to dam construction) was reduced by 1.7–0.2 m; but the relative magnitude of the reduction declined downstream. The scouring of Dongting Lake and Poyang Lake and the main channel erosion allowed for additional reduction of the flood water level at the same discharge. Increased vegetation, coarsening of the riverbed and human activities have led to increased flood levels at the same discharge in the reaches below the dam, although the flood level at the same discharge in this area was expected to decline.
In the future, the TGR and the upstream cascade reservoirs will adopt a joint dispatching method, and the sediment volume downstream of the dam will be kept at a low level. The continuous flooding and erosion of the river will tend to decrease the low-flow water level, and insufficient water depth in the waterway caused by the drop of the low-flow water level should be controlled and avoided. The joint dispatching of the TGR and the upper reach cascade reservoirs will play a more prominent role in reducing flood peaks, which will reduce pressure on flood control measures downstream of the dam. Nonetheless, the current elevation of flood water level at the same discharge should be a focus of concern.
SSAD, M. B. A. Nile River Morphology Changes Due to the Construction of High Aswan Dam in Egypt. The Planning Sector Ministry of Water Resources and Irrigation (2002).
Pinter, N. & Heine, R. A. Hydrodynamic and morphodynamic response to river engineering documented by fixed-discharge analysis, Lower Missouri River, USA. J. Hydrol 302 (1–4), 70–91 (2005).
Article ADS Google Scholar
Day, J., Cable, J., Lane, R. & Kemp, G. Sediment Deposition at the Caernarvon Crevasse during the Great Mississippi Flood of 1927: Implications for Coastal Restoration. Water 8 (2), 38 (2016).
Article Google Scholar
Carle, M. V., Sasser, C. E. & Roberts, H. H. Accretion and Vegetation Community Change in the Wax Lake Delta Following the Historic 2011 Mississippi River Flood. J. Coastal Res 31 (3), 569–587 (2016).
Google Scholar
Lu, J. Y. Relationship between water level and discharge of the lower reaches of the water conservancy project. Journal of Hydraulic Research Institute 1 (2), 109–117 (1994).
Bormann, H., Pinter, N. & Elfert, S. Hydrological signatures of flood trends on German rivers: Flood frequencies, flood heights and specific stages. J. Hydrol 404 (1–2), 50–66 (2011).
James, L. A. Incision and morphologic evolution of an alluvial channel recovering from hydraulic mining sediment. Geoll Soc Am Bull 103 (6), 723–736 (1991).
Chakraborti, N. Fragmentation and flow regulation of the world’s large river systems. Science 308 (5720), 405 (2005).
Article CAS Google Scholar
Zheng, S. R. Reflections on the Three Gorges Project since Its Operation. Engineering 2 (4), 389–397 (2016).
Sun, Z. H., Huang, Y., Cao, Q. X. & Han, J. Q. Spatial and Temporal Variations of the Low Flow Stage in the Immediate Downstream Reach of the Three Georges Dam. Journal of Basic Science and Engineering 23 (4), 694–704 (2015).
Lai, X. J., Jiang, J. H., Yang, G. S. & Lu, X. X. Should the Three Gorges Dam be blamed for the extremely low water levels in the middle–lower Yangtze River? Hydrol Process 28 (1), 150–160 (2014).
Lu, Y. J. et al . Impact of the Three Gorges Project on the Water Level and Navigation Channel in the Near-dam Reach Downstream The Gezhouba Project. Eng. Sci 4 (10), 67–72 (2002).
CAS Google Scholar
Fang, H. W., Han, D., He, G. J. & Chen, M. H. Flood management selections for the Yangtze River midstream after the Three Gorges Project operation. J. Hydrol s432–433 (8), 1–11 (2012).
Jiang, J. H. & Huang, Q. Study on impacts of the Three Gorges Project on its downstream water level. Journal of Hydraulic Engineering 8 , 40–44 (1997).
Li, Y. T., Sun, Z. H., Liu, Y. & Deng, J. Y. Channel Degradation Downstream from the Three Gorges Project and Its Impacts on Flood Level. J. Hydraul Eng-ASCE 135 (9), 718–728 (2009).
Zhang, M., Zhou, J. J. & Huang, G. X. Flood control problems in middle reaches of Yangtze River and countermeasures. Water Resources Protection 32 (4), 1–10 (2016).
Mei, X. F., Dai, Z. J., van Gelder, P. H. A. J. M. & Gao, J. J. Linking Three Gorges Dam and downstream hydrological regimes along the Yangtze River, China. Earth and Space Science 2 (4), 94–106 (2015).
Huang, X. L., Wang, W. K., Zhu, M. H. & Tan, W. “2016.7” flood last danger analysis and revelation in the middle and lower reach of the Yangtze River. China Flood & Drought Management 5 , 47–49 (2016).
Fan, P., Li, J. C., Liu, Q. Q. & Singh, V. P. Case Study: Influence of Morphological Changes on Flooding in Jingjiang River. J. Hydraul Eng-ASCE 134 (12), 1757–1766 (2008).
Greene, S. L. & Knox, J. C. Coupling legacy geomorphic surface facies to riparian vegetation: Assessing red cedar invasion along the Missouri River downstream of Gavins Point dam, South Dakota. Geomorphology 204 (1), 277–286 (2014).
Zong, Y. Q. & Chen, X. Q. The 1998 Flood on the Yangtze, China. Nat Hazards 22 (2), 165–184 (2000).
Article MathSciNet Google Scholar
Xia, J. Q., Deng, S. S., Lu, J. Y., Xu, Q. X. & Zong, Q. L. Dynamic channel adjustments in the Jingjiang Reach of the Middle Yangtze River. Sci Rep 6 , 22802 (2016).
Article ADS CAS PubMed PubMed Central Google Scholar
Zhang, W. et al . Mechanisms of suspended sediment restoration and bed level compensation in downstream reaches of the Three Gorges Projects (TGP). J. Geogr. Sci 27 (4), 463–480 (2017).
Luo, X. X., Yang, S. L. & Zhang, J. The impact of the Three Gorges Dam on the downstream distribution and texture of sediments along the middle and lower Yangtze River (Changjiang) and its estuary, and subsequent sediment dispersal in the East China Sea. Geomorphology 179 (1), 126–140 (2012).
Yin, H. F. & Li, C. G. Human impact on floods and flood disasters on the Yangtze River. Geomorphology 41 (2–3), 105–109 (2001).
Cheng, X. T. Changes of Flood Control Situations and Adjustments of Flood Management Strategies in China. Water Int 30 (1), 108–113 (2005).
Wang, J. D., Sheng, Y. W., Gleason, C. J. & Wada, Y. Downstream Yangtze River levels impacted by Three Gorges Dam. Environmental Res Lett 8 (4), 4012 (2013).
Dai, Z. J., Fagherazzi, S., Mei, X. F. & Gao, J. J. Decline in suspended sediment concentration delivered by the Changjiang (Yangtze) River into the East China Sea between 1956 and 2013. Geomorphology 268 , 123–132 (2016).
Lu, X. X. & Yang, X. K. Dam not sole cause of Chinese drought. Nature 475 (7355), 174 (2011).
Article ADS CAS PubMed Google Scholar
Dai, Z. J., Du, J. Z., Li, J. F., Li, W. H. & Chen, J. Y. Runoff characteristics of the Changjiang River during 2006: Effect of extreme drought and the impounding of the Three Gorges Dam. Hydrogeol J 18 (2), 359–369 (2010).
Chang, J. et al . The hydrological effect between Jingjiang River and Dongting Lake during the initial period of Three Gorges Project operation. J. Geogr. Sci 20 (5), 771–786 (2010).
Li, Y. T. & Ni, J. R. Influence of Sediment Transport on Water Levels in the Middle Yangtze River. Water Int 26 (2), 191–196 (2001).
Hu, Y. X., Huang, J. L., Du, Y., Han, P. P. & Huang, W. Monitoring Spatial and Temporal Dynamics of Flood Regimes and Their Relation to Wetland Landscape Patterns in Dongting Lake from MODIS Time-Series Imagery. Remote Sens 7 (6), 7494–7520 (2015).
Chen, S. C., Chan, H. C. & Li, Y. H. Observations on flow and local scour around submerged flexible vegetation. Adv Water Resour 43 (6), 28–37 (2012).
Heidi, M. N. Hydrodynamics of vegetated channels. J. Hydraul Res 50 (3), 262–279 (2012).
Zhang, Q., Shi, Y. F. & Xiong, M. Geometric properties of river cross sections and associated hydrodynamic implications in Wuhan-Jiujiang river reach, the Yangtze River. J. Geogr. Sci 19 (1), 58–66 (2009).
Shi, Y. F., Zhang, Q., Chen, Z. Y., Jiang, T. & Wu, J. L. Channel morphology and its impact on flood passage, the Tianjiazhen reach of the middle Yangtze River. Geomorphology 85 (3), 176–184 (2007).
Changjiang River Scientific Research Institute (CRSRI). Yichang to Anqing improving waterway standard effects on flood control and river regime control report in Yangtze River. 299–308 (2015).
Zhang, X. B., Lu, J. Y. & Li, Q. S. Preliminary study on accumulated influence of the bankline use on flood control in the middle and lower reaches of the Yangtze River. Resources and Environment in the Yangtze Basin 20 (9), 1138–1142 (2011).
Li, Z. Q. & Liao, X. Y. The cumulative impact of river construction projects on flood control. Hydro-Science and Engineering 4 , 121–125 (2011).
Cao, F. S., Xiao, X. & Wu, P. Yangtze River: China’s golden waterway. Civil Engineering 163 (5), 15–18 (2010).
Li, J. Y., Notteboom, T. E. & Jacobs, W. China in transition: institutional change at work in inland waterway transport on the Yangtze River. Journal of Transport Geography 40 , 17–28 (2014).
Lai, X. J. et al . Sand mining and increasing Poyang Lake’s discharge ability: A reassessment of causes for Lake Decline in China. J. Hydrol 519 , 1698–1706 (2014).
Leeuw, J. D. et al . Strategic assessment of the magnitude and impacts of sand mining in Poyang Lake, China. Reg Environ Change 10 (2), 95–102 (2009).
Mei, X. F., Van Gelder, P. H. A. J. M., Dai, Z. J. & Tang, Z. H. Impact of dams on flood occurrence of selected rivers in the United States. Front Earth Sci , 1–15 (2016).
Han, J. Q. The interaction mechanism between longitudinal water and sediment transport and channel morphology in the downstream of Three Gorges Reservoir. Wuhan University doctoral dissertation (2015).
Download references
Acknowledgements
This study was funded by the National Key Research and Development Program of China (2016YFC0402106, 2016YFC0402305); the National Natural Science Foundation of China (51579123); and the Fundamental Research Funds for Central Welfare Research Institutes (TKS160103); Open Research Fund Program of State Key Laboratory of Water Resources and Hydropower Engineering Science (2016HLG02); Key Research and Development Program of Tianjin (16YFXT00280); and the Doctoral foundation of Northwest Agriculture and Forestry University (2452015337). The hydrological data for this study were provided by the Bureau of Hydrology, Changjiang Water Resources Commission, China and Yangtze River Waterway Bureau. The contributions of both other organizations and individuals involved are gratefully acknowledged.
Author information
Authors and affiliations.
Key Laboratory of Engineering Sediment, Tianjin Research Institute for Water Transport Engineering, Ministry of Transport, Tianjin, 300456, China
Yunping Yang, Mingjin Zhang, Wanli Liu & Yanhua Yang
State Key Laboratory of Water Resources and Hydropower Engineering Science, Wuhan University, Wuhan, 430072, China
- Yunping Yang
Bureau of Hydrology Changjiang Water Resources Commission, Wuhan, 430010, China
Lingling Zhu
Institute of Soil and Water Conservation, Northwest Agriculture and Forestry University, Yangling, 712100, China
Jianqiao Han
You can also search for this author in PubMed Google Scholar
Contributions
Y.P.Y. and J.Q.H. conceived the study and wrote the draft of the manuscript. M.J.Z. and L.L.Z. contributed to the improvement of the manuscript. Y.H.Y. prepared Figs 1–5. Y.P.Y. and W.L.L. prepared Figs 6–11 and Tables 1–5. All authors reviewed the manuscript.
Corresponding author
Correspondence to Jianqiao Han .
Ethics declarations
Competing interests.
The authors declare that they have no competing interests.
Additional information
Publisher's note: Springer Nature remains neutral with regard to jurisdictional claims in published maps and institutional affiliations.
Rights and permissions
Open Access This article is licensed under a Creative Commons Attribution 4.0 International License, which permits use, sharing, adaptation, distribution and reproduction in any medium or format, as long as you give appropriate credit to the original author(s) and the source, provide a link to the Creative Commons license, and indicate if changes were made. The images or other third party material in this article are included in the article’s Creative Commons license, unless indicated otherwise in a credit line to the material. If material is not included in the article’s Creative Commons license and your intended use is not permitted by statutory regulation or exceeds the permitted use, you will need to obtain permission directly from the copyright holder. To view a copy of this license, visit http://creativecommons.org/licenses/by/4.0/ .
Reprints and permissions
About this article
Cite this article.
Yang, Y., Zhang, M., Zhu, L. et al. Influence of Large Reservoir Operation on Water-Levels and Flows in Reaches below Dam: Case Study of the Three Gorges Reservoir. Sci Rep 7 , 15640 (2017). https://doi.org/10.1038/s41598-017-15677-y
Download citation
Received : 23 June 2017
Accepted : 31 October 2017
Published : 15 November 2017
DOI : https://doi.org/10.1038/s41598-017-15677-y
Share this article
Anyone you share the following link with will be able to read this content:
Sorry, a shareable link is not currently available for this article.
Provided by the Springer Nature SharedIt content-sharing initiative
This article is cited by
Substantial burial of terrestrial microplastics in the three gorges reservoir, china.
- Baoshan Xing
Communications Earth & Environment (2023)
Relationship between potential waterway depth improvement and evolution of the Jingjiang Reach of the Yangtze River in China
Journal of Geographical Sciences (2023)
Short-term Prediction Method of Reservoir Downstream Water Level Under Complicated Hydraulic Influence
- Jingwei Huang
Water Resources Management (2023)
Evaluating the impacts of inter-basin water transfer projects on ecosystem services in the Fenhe River Basin using the SWAT model
- Linfang Wang
Environmental Monitoring and Assessment (2023)
Evaluating the hydrological effects of the Three Gorges Reservoir based on a large-scale coupled hydrological-hydrodynamic-dam operation model
- Sidong Zeng
- Renyong Huang
By submitting a comment you agree to abide by our Terms and Community Guidelines . If you find something abusive or that does not comply with our terms or guidelines please flag it as inappropriate.
Quick links
- Explore articles by subject
- Guide to authors
- Editorial policies
Sign up for the Nature Briefing newsletter — what matters in science, free to your inbox daily.

Three Gorges Dam: Consequences of Hydropower in China
Kitty kwan december 15, 2016, submitted as coursework for ph240 , stanford university, fall 2016, introduction to hydropower.
| In addition to its importance in agriculture, the carp has significance within Chinese culture as well, symbolizing life achievement that is gained through hard work. With this being true, it is important to consider China's achievements in energy in the context of what is being sacrificed. (Source: ) |
Hydroelectric power has strong energy potential in terms of its output and sustainability. As population's increase and economies grow, there is a clear increase in worldwide energy demand. According to BP's Statistical Review of World Energy, worldwide primary energy consumption has increased from 10,940 to 13,147 million tonnes of oil equivalent, while hydroelectricity consumption has increased from 661.4 to 892.9 million tonnes of oil equivalent from 2005 to 2015. [1] While the primary energy space is still dominated by fossil fuels, hydroelectric energy production and use is becoming more popular. As it further develops, there are concerns over its environmental and social effects on neighboring areas. Hydropower is one of the most important renewable energy sources in electricity generation. As water is found naturally moving in many locations, energy can be extracted from its velocity and positioning to power machinery and generate electricity. Hydropower provides a significant amount of energy in the world, contributing approximately 15% of the global electricity production. [2] Global growth has been primarily concentrated in several key countries, top of which is China. China had 15GW deployed in 2012 and has a 5-year plan to have 284GW through 2015, hypothetically using 71% of its available hydroelectric power. [3]
Three Gorges Dam
Given the prominence of China in the hydropower space, it is fitting to explore the Three Gorges Dam as a case of a large-scale hydropower project with wide reaching impact. The Three Gorges Dam is the largest hydroelectric dam in the world, providing energy production, flood control, and navigation to China's Yangtze River area. In its full completion with 26 turbines, it has a full power capacity that exceeds 22,000 MWe. Intended to help reduce China's energy reliance on burning coal, the energy from Three Gorges Dam is able to replace around 50 million tons of coal that otherwise would have been burned. [4] Additionally, the Three Gorges Dam has the added benefit of flood control, a major problem of the Yangtze River Basin. The Three Gorges Dam additionally is able to divert water resources to northern China, where rainfall is in a shortage.
However, the Three Gorges Dam has also had many negative implications on the local ecology and relocation of people. Ecosystems have been destroyed through the process of blocking a massive river. Additionally, the process of its construction offsets many of the immediate benefits it poses to reducing the negative externalities of fossil fuels. An estimated 2 million people downstream of the dam were relocated, without acknowledgement of their loss of livelihood. This project has also greatly affected the farming and fishing communities. The river is fished out, and the Yangtze's four major species of carp are dwindling, as referenced in the figure. This is a result of increased traffic, pollution from construction, and various industrial wastes. [5]
Future Directions
The Three Gorges Dam in China has proven to be a controversial project for its added pros and cons to the Yangtze River landscape. As China propels and continues to lead hydropower generation and leverage its hydropower potential, it is very important for planners to maintain careful planning and design to work around the challenges. In particular, lessons from the Three Gorges Dam must be taken when considering the development of new dams, such as the Nu River Dam. This 13-cascade would leverage China's last undammed river, have immense power generating potential, but also face many similar ecological and social consequences. [6]
© Kitty Kwan. The author grants permission to copy, distribute and display this work in unaltered form, with attribution to the author, for noncommercial purposes only. All other rights, including commercial rights, are reserved to the author.
[1] " BP Statistical Review of World Energy 2015 ," British Petroleum, June 2016.
[2] C. S. Kaunda et al. , " Hydropower in the Context of Sustainable Energy Supply: A Review of Technologies and Challenges ," ISRN Renewable Energy 2012 , 730631 (2012).
[3] " World Energy Resources ," World Energy Council, 2013, Ch. 5.
[4] P. H. Gleick, "Three Gorges Dam Project, Yangtze River, China," in The World's Water, 2008-2009 , ed. by P. H. Gleick (Island Press, 2008), p. 139.
[5] R. Stone, "Three Gorges Dam: Into the Unknown," Science 321 , 628 (2008).
[6] P. H. Brown, D. Magee, and Y. Xu, "Socioeconomic Vulnerability in China's Hydropower Development," China Econ. Rev. 19 , 614 (2008).
- 0 Shopping Cart
River management in an emerging country
Edexcel iGCSE > River Environments > River management in an emerging country: China’s Three Gorges Dam
China’s Three Gorges Dam
The Three Gorges Dam, located on the Yangtze River, is the largest multipurpose river management structure globally. The dam, over 2 km long and 100m high, was finished in 2009, forming a lake over 600 km long behind it. The Yangtze basin, home to 400 million people and providing 66% of China’s rice, covers 1.8 million km2 and releases 24,000 m’/second of water annually.

The Three Gorges Dam
The project boasts several benefits:
- Flood management, protecting 10 million downstream residents in cities like Wuhan, Nanjing, and Shanghai from the river’s seasonal floods.
- A massive electricity generation capacity of 22,500 MW, primarily powering Shanghai and Chongqing, making it the world’s largest power station.
- Incorporation of locks for navigation, promoting shipping above the dam and boosting tourism with the growth of cruise ships on the river.
- During dry spells, ensure downstream water supply for agricultural, industrial, and domestic uses.
However, the dam has also attracted criticism for several reasons:
- Over 1.25 million people were displaced to make space for the dam and lake.
- The dam sits in an earthquake-prone region, where landslides occur frequently.
- The dam’s silt trapping reduces the reservoir ’s capacity and the downstream farmland’s fertility over time.
- The dam disrupts aquatic ecosystems.
The Three Gorges Dam on the Yangtze River, the world’s largest river management scheme, provides flood control, powers cities, promotes tourism and shipping, and supplements water supply.
Over 1.25 million people were displaced due to the dam’s construction.
The dam’s location in an earthquake-prone region leads to frequent landslides.
Silt trapping by the dam reduces reservoir capacity and downstream farmland fertility and disrupts aquatic life.
Share this:
- Click to share on Twitter (Opens in new window)
- Click to share on Facebook (Opens in new window)
- Click to share on Pinterest (Opens in new window)
- Click to email a link to a friend (Opens in new window)
- Click to share on WhatsApp (Opens in new window)
- Click to print (Opens in new window)
Please Support Internet Geography
If you've found the resources on this site useful please consider making a secure donation via PayPal to support the development of the site. The site is self-funded and your support is really appreciated.
Search Internet Geography
Latest Blog Entries
Pin It on Pinterest
- Click to share
- Print Friendly
- History & Society
- Science & Tech
- Biographies
- Animals & Nature
- Geography & Travel
- Arts & Culture
- Games & Quizzes
- On This Day
- One Good Fact
- New Articles
- Lifestyles & Social Issues
- Philosophy & Religion
- Politics, Law & Government
- World History
- Health & Medicine
- Browse Biographies
- Birds, Reptiles & Other Vertebrates
- Bugs, Mollusks & Other Invertebrates
- Environment
- Fossils & Geologic Time
- Entertainment & Pop Culture
- Sports & Recreation
- Visual Arts
- Demystified
- Image Galleries
- Infographics
- Top Questions
- Britannica Kids
- Saving Earth
- Space Next 50
- Student Center
- Introduction
- Physical description and capacity of the Three Gorges Dam
History and controversy of the Three Gorges Dam

- What are the major ethnic groups in China?

Our editors will review what you’ve submitted and determine whether to revise the article.
- CNN - China's Three Gorges Dam is one of the largest ever created. Was it worth it?
- Montana State University - Three Gorges Dam
- Association for Asian Studies - The Three Gorges: Dam Energy, the Environment, and the New Emperors
- International Rivers - Three Gorges Dam
- NASA - Scientific Visualization Studio - Rise of the Three Gorges Dam
- Frontiers - Case Study: Influence of Three Gorges Reservoir Impoundment on Hydrological Regime of the Acipenser sinensis Spawning Ground, Yangtze River, China
- Table Of Contents
First discussed in the 1920s by Chinese Nationalist Party leaders, the idea for the Three Gorges Dam was given new impetus in 1953 when Chinese leader Mao Zedong ordered feasibility studies of a number of sites. Detailed planning for the project began in 1955. Its proponents insisted it would control disastrous flooding along the Yangtze, facilitate inland trade, and provide much-needed power for central China , but the dam was not without its detractors. Criticisms of the Three Gorges project began as soon as the plans were proposed and continued through its construction. Key problems included the danger of dam collapse, the displacement of some 1.3 million people (critics insisted the figure was actually 1.9 million) living in more than 1,500 cities, towns, and villages along the river, and the destruction of magnificent scenery and countless rare architectural and archaeological sites. There were also fears—some of which were borne out—that human and industrial waste from cities would pollute the reservoir and even that the huge amount of water impounded in the reservoir could trigger earthquakes and landslides . Some Chinese and foreign engineers argued that a number of smaller and far cheaper and less-problematic dams on the Yangtze tributaries could generate as much power as the Three Gorges Dam and control flooding equally well. Construction of those dams, they maintained, would enable the government to meet its main priorities without the risks.
Because of these problems, work on the Three Gorges Dam was delayed for nearly 40 years as the Chinese government struggled to reach a decision to carry through with plans for the project. In 1992 Premier Li Peng , who had himself trained as an engineer, was finally able to persuade the National People’s Congress to ratify the decision to build the dam, though almost a third of its members abstained or voted against the project—an unprecedented sign of resistance from a normally acquiescent body. Pres. Jiang Zemin did not accompany Li to the official inauguration of the dam in 1994, and the World Bank refused to advance China funds to help with the project, citing major environmental and other concerns.
Nevertheless, the Three Gorges project moved ahead. In 1993 work started on access roads and electricity to the site. Workers blocked and diverted the river in 1997, bringing to a close the first phase of construction. In 2003 the reservoir began to fill, the five-tier ship locks —which allowed vessels of up to 10,000 tons to navigate past the dam—were put into preliminary operation, and the first of the dam’s generators was connected to the grid, completing the second phase of construction. (Following completion of this second phase, some 1,200 sites of historical and archaeological importance that once lined the middle reaches of the Yangtze River vanished as floodwaters rose.) Construction of the main wall of the dam was completed in 2006. The remainder of the dam’s generators were operational by mid-2012, and a ship lift, which allowed vessels of up to 3,000 tons to bypass the five-tier ship locks and more quickly navigate past the dam, was completed in late 2015 and began officially operating in 2016.
by edluffy_
IB Geography Turtle
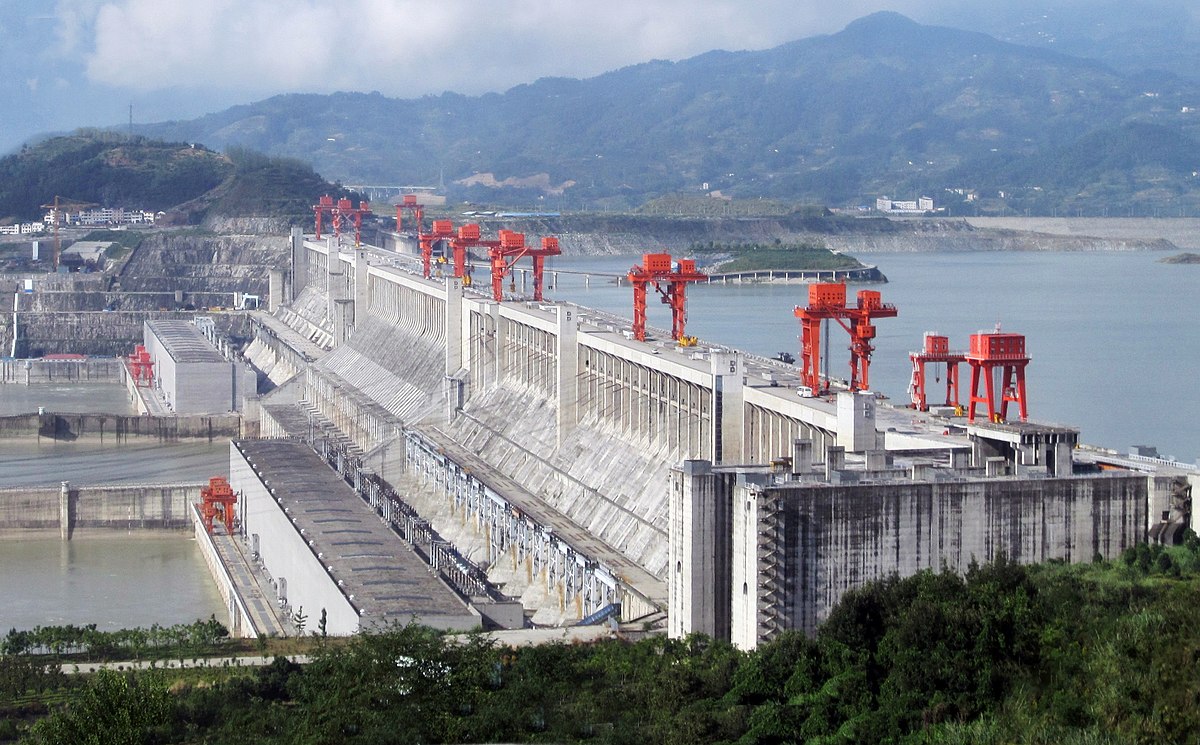
Case study: Three Gorges Dam
Introduction.
With the recent worldwide focus on renewable energy sources, Hydroelectric dams that control the flow of a river are being built faster than ever before. One of the prime examples of this, is the Three Gorges Dam – now the largest power station in the world.
The Three Gorges dam originally began construction in 1992 , on a chokepoint of the River Yangtze. Only being finished recently in 2012 , there are many benefits and disadvantages that have come with its construction.
Socio-economic
- The dam currently provides protection from 1 in a 100 year floods. This is vital in ensuring the livelihoods of people living in the nearby Dongting Lake Plains .
- The dam provides 18,200 MW of hydro-electric power. This is estimated to be about 10% of China’s total electricity needs.
- The dam has improved the Chinese inland shipping system. Areas of the valley that were once out of reach for ships are now becoming major ports of trade.
- Water supply for towns in the valley has also improved.
Environmental
- Reduced air pollution as HEP energy is mostly generated in a clean and safe manner.
Disadvantages
Socio-Economic
- At least 1.2 million people have been resettled due to controlled flooding when the dam was built. Whole towns have disappeared.
- Some people living in the valleys have had to move to steeper areas with poorer soils for agriculture.
- Cultural heritage has been destroyed as over 1700 sites of cultural importance have been submerged by flooding.
- Due to the dam blocking the flow of the river, sewage and industrial effluent have piled up in the reservoir.
- The famous Yangtze River Dolphin is now thought to be extinct due to loss of its habitat
- Such a large-scale dam has slightly increased earthquake risk in the area.
Share this:
Leave a comment cancel reply.
- Already have a WordPress.com account? Log in now.
- Subscribe Subscribed
- Copy shortlink
- Report this content
- View post in Reader
- Manage subscriptions
- Collapse this bar
Leaving the Three Gorges After Resettlement: Who Left, Why Did They Leave, and Where Did They Go?
- First Online: 16 January 2021
Cite this chapter

- Brooke Wilmsen 4 ,
- Andrew van Hulten 4 &
- Yuefang Duan 5
Part of the book series: International Political Economy Series ((IPES))
414 Accesses
1 Citations
Studies of dam resettlement in China tend to focus on those who remain in resettlement sites, producing a distorted discourse of life after resettlement. Households and individuals often move out of resettlement sites but, because they are difficult to trace, there is limited research about them. It is estimated that 30 per cent of resettled households emigrated from the Three Gorges Dam resettlement site. To explore this and contribute to the limited research about emigration after resettlement, this chapter asks: Who left the Three Gorges after resettlement? Why did they leave? Where did they go? To understand what may have led to emigration we analyse the livelihoods of 178 households who responded to a survey in 2003, but were no longer living at the same resettlement site in 2012. We find low-income rural households and higher income urban households were more likely than their cohort averages to have left the resettlement between 2003 and 2011. This provides initial evidence that a range of push and pull factors influence the decision to leave resettlement sites. These dynamics have been overlooked in the resettlement literature, potentially skewing assessments of resettlement outcomes.
This is a preview of subscription content, log in via an institution to check access.
Access this chapter
Subscribe and save.
- Get 10 units per month
- Download Article/Chapter or eBook
- 1 Unit = 1 Article or 1 Chapter
- Cancel anytime
- Available as PDF
- Read on any device
- Instant download
- Own it forever
- Available as EPUB and PDF
- Compact, lightweight edition
- Dispatched in 3 to 5 business days
- Free shipping worldwide - see info
- Durable hardcover edition
Tax calculation will be finalised at checkout
Purchases are for personal use only
Institutional subscriptions
Slum Resettlement to the Margins: Increasing the Deprivation of the Poor and Impeding the Resilience of the City

The Merowe Dam in Northern Sudan: A Case of Population Displacement and Impoverishment

Echoes of Urban Displacement: Unveiling Lingering Consequences
See Article XIII of the Regulations for Resettlement for Large and Medium Hydropower and Water Conservation Projects. For more on resettlement policies, see the chapters by Tilt and Chen as well as Habich-Sobiegalla and Plümmer, this volume.
In the 1990s, SLA emerged from the academic literature on participatory development and was used extensively by development agencies to plan and assess development projects. More recently, it has been the subject of extensive critique (Scoones 2009 ; Reddy et al. 2015 ; Smyth and Vanclay 2017 ), in particular for the complexity of translating the framework into practice at the project level. Nonetheless, at the time of our research it was widely accepted and, despite its shortcomings, provided a useful framework for framing our research questions in the Three Gorges. For more details on our research methods and limitations, see Wilmsen ( 2016a ) and Wilmsen and van Hulten ( 2017 ).
Follow-up analysis revealed that of the 178 non-respondents in 2012, 17 households had passed away sometime between 2003 and 2012.
Cernea, M. M. (1999). The economics of involuntary resettlement: Questions and challenges . Washington, DC: International Bank for Reconstruction and Development/The World Bank.
Book Google Scholar
Cernea, M. M. (2016). The state and involuntary resettlement: Reflections on comparing legislation on development-displacement in China and India. In F. Padovani (Ed.), Development-induced displacement in India and China: A comparative look at the burdens of growth . Lanham: Lexington Books.
Google Scholar
Cernea, M. M., & Maldonado, J. K. (2018). Introduction: Challenging the prevailing paradigm of displacement and resettlement. In J. K. Maldonado & M. M. Cernea (Eds.), Challenging the prevailing paradigm of displacement and resettlement (pp. 1–42). London: Routledge.
Chapter Google Scholar
Chen, S. (2016). From involuntary to voluntary: New-type urbanization approach to reservoir resettlement . Society for Applied Anthropology Conference, Vancouver.
Department for International Development (DFID). (1999). Sustainable livelihoods guidance sheets . https://www.livelihoodscentre.org/documents/114097690/114438878/Sustainable+livelihoods+guidance+sheets.pdf/ . Accessed 29 May 2020.
Duan, Y., & Steil, S. (2003). China Three Gorges Project resettlement: Policy, planning and implementation. Journal of Refugee Studies, 16 (4), 422–443.
Article Google Scholar
Duan, Y., & Wilmsen, B. (2012). Addressing the resettlement challenges at the Three Gorges Project. International Journal of Environmental Studies, 69 (3), 461–474.
Duan, Y., Wilmsen, B., & Zhao, X. (2019). Urbanisation resettlement in China: Characteristics, risks and the revised land administration law. In S. Price & J. Singer (Eds.), Country frameworks for development displacement and resettlement: Reducing risk, building resilience (pp. 219–230). London: Routledge.
Han, X. (2018). Money markets and hydropower: Chinese dam construction in Africa. PhD dissertation, University of Melbourne.
Heggelund, G. (2004). Environment and resettlement politics in China . Hampshire: Ashgate.
Hensengerth, O. (2013). Chinese hydropower companies and environmental norms in countries of the Global South: The involvement of Sinohydro in Ghana’s Bui Dam. Environment, Development and Sustainability, 15 (2), 285–300.
Hwang, S., Xi, J., Cao, Y., Feng, X., & Qiao, X. (2007). Anticipation of migration and psychological stress and the Three Gorges Dam project, China. Social Science and Medicine, 65 (5), 1012–1024.
International Hydropower Association (IHA). (2019). China . https://www.hydropower.org/country-profiles/china . Accessed 29 May 2020.
Jun, J. (2000). Environmental protests in rural China. In E. Perry & M. Selden (Eds.), Chinese society: Change, conflict and resistence (pp. 197–214). Oxon: Routledge.
McDonald, B. D. (2006). From compensation to development: Involuntary resettlement in the People’s Republic of China. PhD dissertation, University of Melbourne.
McDonald, B., Webber, M., & Duan, Y. (2008). Involuntary resettlement as an opportunity for development: The case of urban resettlers of the Three Gorges Project, China. Journal of Refugee Studies, 21 (1), 82–102.
Reddy, G., Smyth, E., & Steyn, M. (2015). Land access and resettlement . London: Routledge.
Rogers, S., & Wilmsen, B. (2020). Towards a critical geography of resettlement. Progress in Human Geography, 44 (2), 256–275.
Scoones, I. (2009). Livelihood perpectives and rural development. Journal of Peasant Studies, 36 (1), 171–196.
Scudder, T. (1997). Social impacts of large dam projects. In T. Dorcey, A. Steiner, M. Acreman, & B. Orlando (Eds.), Large dams: Learning from the past, looking at the future (pp. 41–68). Washington, DC: IUCN & World Bank Group.
Scudder, T. (2005). The future of large dams: Dealing with the social, environmental and political costs . London: Earthscan.
Smyth, E., Steyn, M., Esteves, A. M., Franks, D. M., & Vaz, K. (2015). Five ‘big’ issues for land access, resettlement and livelihood restoration practice: Findings of an international symposium. Impact Assessment and Project Appraisal, 33 (3), 220–225.
Smyth, E., & Vanclay, F. (2017). The social framework for projects: A conceptual but practical model to assist in assessing, planning and managing the social impacts of projects. Impact Assessment and Project Appraisal, 35 (1), 65–80.
State Council. (2006). Regulation on land requisition compensation and resettlement of migrants for large and medium hydropower construction projects . http://www.fao.org/faolex/results/details/en/?details=LEX-FAOC134774 . Accessed 29 May 2020.
Tan, Y., Hugo, G., & Potter, L. (2005). Rural women, displacement and the Three Gorges Project. Development and Change, 36 (4), 711–734.
Tang, S. (2016, March 11). China’s new vision for the next five years. China Today , http://www.china.org.cn/china/NPC_CPPCC_2016/2016-03/11/content_38000088.htm . Accessed 29 May 2020.
Tilt, B. (2014). Dams and development in China: The moral economy of water and power . New York: Columbia University Press.
Urban, F., Siciliano, G., & Nordensvard, J. (2017). China’s dam-builders: Their role in transboundary river management in South-East Asia. International Journal of Water Resources Development, 34 (5), 747–770.
Vanclay, F. (2017). Project-induced displacement and resettlement: From impoverishment risks to an opportunity for development? Impact Assessment and Project Appraisal, 35 (1), 3–21.
World Commision on Dams (WCD). (2000). Dams and development: A new framework for decision-making . London: Earthscan.
Wilmsen, B. (2016a). After the deluge: A longitudinal study of resettlement at the Three Gorges Dam, China. World Development, 84, 41–54.
Wilmsen, B. (2016b). Expanding capitalism in rural China through land acquisition and land reforms. Journal of Contemporary China, 25 (101), 701–717.
Wilmsen, B. (2018a). Damming China’s rivers to expand its cities: the urban livelihoods of rural people displaced by the Three Gorges Project. Urban Geography, 39, 345–366.
Wilmsen, B. (2018b). Is land-based resettlement still appropriate for rural people in China? A longitudinal study of displacement at the Three Gorges Dam. Development and Change, 49 (1), 170–198.
Wilmsen, B., Adjartey, D., & Van Hulten, A. (2019). Challenging the risks-based model of involuntary resettlement using evidence from the Bui Dam, Ghana. International Journal of Water Resources Development, 35 (4), 682–700.
Wilmsen, B., & van Hulten, A. (2017). Following resettled people over time: The value of longitudinal data collection for understanding the livelihood impacts of the Three Gorges Dam. China. Impact Assessment and Project Appraisal, 35 (1), 94–105.
Wilmsen, B., van Hulten, A., Han, X., Adjartey, D. (2020). The environmental and social safeguard policies of the Belt and Road Initiative: The geopolitical implications. In M. Clarke, M. Sussex & N. Bisley (Eds.), The Belt and Road Initiative and the future of regional order in the Indo-Pacific. New York: Rowman and Littlefield.
Wilmsen, B., Webber, M., & Yuefang, D. (2011a). Development for whom? Rural to urban resettlement at the Three Gorges Dam. China. Asian Studies Review, 35 (1), 21–42.
Wilmsen, B., Webber, M., & Duan, Y. (2011b). Involuntary rural resettlement: Resources, strategies, and outcomes at the Three Gorges Dam, China. The Journal of Environment and Development, 20 (4), 355–380.
Wu, N. Z., & Liao, Q. L. (1999). The necessity to relocate the resettlers outside for the consideration of land bearing capacity—Take Yunyang County as a case study. Resources and Environment in the Yangtze Basin, 8 (3), 20–22.
Xinhua. (2016). World’s largest shiplift completes China’s Three Gorges project. China Daily. https://www.chinadaily.com.cn/china/2016-09/19/content_26825380.htm . Accessed 29 May 2020.
Xu, X., Tan, Y., & Yang, G. (2013). Environmental impact assessments of the Three Gorges Project in China: Issues and interventions. Earth-Science Reviews, 124, 115–125.
Yang, Z., Cai, J., Qi, W., Liu, S., & Deng, Y. (2017). The influence of income, lifestyle, and green spaces on interregional migration: Policy implications for China. Population, Space and Place, 23 (2), e1996.
Zhan, S. (2017). Hukou reform and land politics in China: Rise of a tripartite alliance. The China Journal, 78, 25–49.
Zhu, N. (2002). The impacts of income gaps on migration decisions in China. China Economic Review, 13 (2), 213–230.
Download references
Acknowledgements
The authors acknowledge funding from the Australian Research Council, grant DE120101037.
Author information
Authors and affiliations.
La Trobe University, Melbourne, Australia
Brooke Wilmsen & Andrew van Hulten
China Three Gorges University, Yichang, China
Yuefang Duan
You can also search for this author in PubMed Google Scholar
Corresponding author
Correspondence to Brooke Wilmsen .
Editor information
Editors and affiliations.
School of International Development and Global Studies, University of Ottawa, Ottawa, ON, Canada
Jean-François Rousseau
Institute of Chinese Studies, Freie Universität Berlin, Berlin, Germany
Sabrina Habich-Sobiegalla
Rights and permissions
Reprints and permissions
Copyright information
© 2021 The Author(s), under exclusive license to Springer Nature Switzerland AG
About this chapter
Wilmsen, B., van Hulten, A., Duan, Y. (2021). Leaving the Three Gorges After Resettlement: Who Left, Why Did They Leave, and Where Did They Go?. In: Rousseau, JF., Habich-Sobiegalla, S. (eds) The Political Economy of Hydropower in Southwest China and Beyond. International Political Economy Series. Palgrave Macmillan, Cham. https://doi.org/10.1007/978-3-030-59361-2_3
Download citation
DOI : https://doi.org/10.1007/978-3-030-59361-2_3
Published : 16 January 2021
Publisher Name : Palgrave Macmillan, Cham
Print ISBN : 978-3-030-59360-5
Online ISBN : 978-3-030-59361-2
eBook Packages : Political Science and International Studies Political Science and International Studies (R0)
Share this chapter
Anyone you share the following link with will be able to read this content:
Sorry, a shareable link is not currently available for this article.
Provided by the Springer Nature SharedIt content-sharing initiative
- Publish with us
Policies and ethics
- Find a journal
- Track your research
A comprehensive review of production, applications, and the path to a sustainable energy future with hydrogen

First published on 22nd August 2024
Green hydrogen, a versatile and sustainable energy carrier, has garnered increasing attention as a critical element in the global transition to a low-carbon economy. This review article comprehensively examines the production, applications, and potential of green hydrogen, accompanied by the challenges and future prospects associated with its widespread adoption. The production of green hydrogen is a central focus, due to its environmental benefits and distinctive characteristics. The article delves into the various techniques and technologies employed in green hydrogen production, emphasizing the need for cost reduction and increased scale for economic viability. Focusing particularly on applications, the review discusses the diverse sectors where green hydrogen demonstrates immense promise. Challenges and limitations are explored, including the intermittent nature of renewable energy sources, high production costs, and the need for extensive hydrogen infrastructure. The article also highlights the pressing need for innovation in electrolysis technology and materials, emphasizing the potential for cost reduction and increased efficiency. As industries gradually transition to green hydrogen as a cleaner feedstock, its demand and cost-competitiveness are projected to increase. This review article thoroughly evaluates the current status of green hydrogen and provides valuable insights into its potential role in the transition to a sustainable energy system.
1. Introduction
| Type | Name | Country | Power capacity (MW) | Year | Ref. |
|---|---|---|---|---|---|
| Biomass power plant | Alholmens Kraft power plant | Finland | 240 | 2002 | |
| Hydroelectric power | Three Gorges dam | China | 22 | 2003 | |
| On-shore wind farm | Gansu wind farm | China | 7965 | 2009 | |
| Biomass power plant | Ironbridge power plant | United Kingdom | 740 | 2012 | |
| Biomass power plant | Polaniec biomass power plant | Poland | 220 | 2012 | |
| Photovoltaics & hydroelectric power | Longyangxia dam solar park | China | 2130 | 2015 | |
| Parabolic trough and solar power tower (CSP) | Ouarzazate solar power station | Morocco | 580 | 2016 | |
| Photovoltaics | Bhadla solar park | India | 2245 | 2018 | |
| Photovoltaics | Huanghe hydropower hainan solar park | China | 2200 | 2020 |
Taking proactive measures against climate change, as indicated by the International Energy Agency (IEA) study, could bring about $26 trillion in economic benefits and 65 million new jobs by 2030. 20 Hence, renewable energy sources are increasingly gaining traction to achieve environmentally friendly and sustainable energy systems. This is due to their non-carbon, widespread availability, and high-energy-density characteristics. 21–23 Broadly speaking, the utilization of renewable energy stands as the most appealing approach, holding the potential to substantially reduce or even eliminate the reliance on fossil fuels. Renewable energy sources have experienced a significant increase in generation and adoption over the past decade. Some of these sources are even harnessed for large-scale electricity production, as seen in the case of solar energy, 24,25 wind energy, 26–28 biomass energy, 29,30 and ocean energy. 31,32
Hydrogen (H 2 ), a gas that is both colorless and odorless, possesses remarkable flammability. Several sources, such as biomass, natural gas, and water, can be used to obtain hydrogen, which is the lightest and most abundant element in the universe. 33–35 Utilizing H 2 as a fuel source involves the transformation of this gas into electricity within a hydrogen fuel cell (FC). These cells are distinguished by their exceptional efficiency, boasting rates of up to 60%. Moreover, they demonstrate an environmentally friendly character, as they generate no detrimental emissions, yielding only water and heat as by-products. 36,37 H 2 stands as an eco-friendly fuel, emitting no environmentally harmful molecules during combustion or oxidation at lower temperatures. 38,39 H 2 shows significant potential for reducing carbon emissions in the energy sector and achieving net-zero production by 2050. Driven by these compelling attributes of hydrogen, several nations have just unveiled plans and initiatives aimed at establishing sustainable, renewable (green) hydrogen ecosystems. 40–42
H 2 can be generated from both sustainable and non-sustainable origins, resulting in the categorizations of green, blue, and gray hydrogen. 43 These types and their origins are shown in brief in ( Fig. 1 ).
| Types of H and their origin. | ||
The production of H 2 through the utilization of fossil fuels is classified as gray H 2 , denoting its association with environmental consequences and carbon emissions resulting from the combustion of these finite resources. 44 The majority of present-day H 2 production stems from fossil fuels incorporating no carbon dioxide capture. While these stands as the most direct approach to hydrogen generation, its sustainability is questionable. 45 Gray H 2 is acquired through processes that yield greenhouse gas emissions exceeding 36.4 grams of carbon dioxide per megajoule (MJ), regardless of whether these processes rely on renewable or non-renewable resources. 46,47 In the current landscape, the foremost origins of the H 2 supply can be attributed to the exploitation of coal and natural gas. The industrial utilization of H 2 spans across the globe; however, the act of producing H 2 presents a notable concern due to the substantial carbon dioxide emissions it contributes annually. This interplay underscores the delicate balance between the practical applications of H 2 and the environmental ramifications inherent in its generation. 48,49 In summary, the production of gray H 2 from fossil fuels carries significant environmental implications and carbon emissions. While fossil fuels dominate current H 2 production, their sustainability remains uncertain.
The outcome of this process is blue H 2 , which emerges from the utilization of fossil fuels in combination with methods involving carbon utilization, storage, and absorption. 50,51 Blue H 2 is commonly synthesized from natural gas, frequently employing steam reforming techniques coupled with carbon capture and storage. While certain approaches to blue H 2 production involve carbon absorption, it's important to note that this method doesn't inherently eliminate carbon emissions. 52 Producing a substantial quantity of blue H 2 could play a vital role in supporting the expanding worldwide and local H 2 supply chains and their associated fuels. The highest projected efficiency for carbon dioxide absorption stands between 85% to 95%, resulting in a leakage of around 5% to 15% of the total carbon. 53
H 2 derived from sustainable and renewable resources is classified as green H 2 , signifying its origin through environmentally friendly methods that harness sources like solar, wind, or hydropower. 54–56 An increasingly prominent technique within this sector, garnering noteworthy focus in recent times, is the electrolytic generation of H 2 . 57 The production of green H 2 using renewable energy sources is expected to increase rapidly in the near future. Multiple ongoing and forthcoming initiatives are aligned with this trajectory. 58,59 Nonetheless, achieving substantial cost reduction necessitates increased mass production, dedicated research, and comprehensive development efforts. In accordance with this pattern, the scope of projects has experienced exponential expansion in recent times. H 2 generated from renewable sources has the hypothetical to greatly enhance renewable energy output. It is currently technically viable and has the imminent potential to become a prominent global economic contender. 60 Anticipations from experts indicate that, by 2050, the cost of green H 2 will probably fall to a level below $1 per kilogram, thus rendering green H 2 a more competitive option. This underscores the pressing requirement for persistent research and development efforts in the realm of H 2 energy. Such investments are essential because H 2 is forecasted to emerge as the preferred choice for fuel in the forthcoming years, primarily due to its substantial energy content and environmentally advantageous attributes. 61
2. Production methods
Some of the already used methods, such as pyrolysis, have several advantages, including the production of H 2 -rich fuel, rapid and efficient decomposition of feedstock, and great flexibility. However, there are also certain disadvantages, such as the high energy requirements and the potential for tar formation. Gasification offers several advantages, including the capability to convert a wide range of feedstocks, extraordinary productivity, and the potential to generate value-added products alongside H 2 production. Nevertheless, there are also some disadvantages, such as electrode deactivation, substantial energy requirements, and the necessity for exceptionally durable equipment. Reforming offers several advantages, including a high capacity to reform diverse materials, cost-effective construction, rapid response capabilities, and compactness. However, there are also some drawbacks, such as high energy requirements, a significant reduction in electrode lifetime, and the need for catalyst regeneration. The data included in Table 2 .
| Type | Drawbacks | Benefits | Ref. |
|---|---|---|---|
| Pyrolysis | High required energy | High flexibility | |
| Fast and efficient feedstock decomposition | |||
| Possibility of tar formation | H -rich fuel production | ||
| Gasification | Need for high resistant equipment | High productivity | |
| High required energy | Ability to convert a variety of feedstocks | ||
| Deactivation of electrodes | High potential to produce value-added products along with H | ||
| Reforming | Considerable reduction in electrode lifetime | High-speed responding quality | |
| Need for catalyst regeneration | Cheap construction costs | ||
| High energy requirement | High capacity to reform varying materials | ||
| Compactness |
2.1. Steam methane reforming
| Representation of the SMR process. | ||
2.2. Plasma
Plasma technologies work by energizing gas streams through electrical discharge ( Fig. 3 ). This process results in the generation of various components, including positively charged ions, negatively charged electrons, neutrals, reactive and excited species, an electromagnetic field, and photons. In conditions that deviate from normal atmospheric pressure and temperature, these phenomena facilitate the efficient conversion of biomass into H 2 through oxidation. 76,77 Conversion methods utilizing plasma technology hold promise for the production of valuable chemicals in addition to H 2 , and their generation of harmful pollutants is virtually negligible. 78,79 Furthermore, by integrating with complementary processes, these methods can yield a H 2 product of exceptionally high purity. 80
| Representation of the production of green H with plasma route. | ||
Kuo and colleagues 75 conducted a comprehensive analysis by a DC plasma torch reactor to evaluate the suitability of various biomass feedstocks for H 2 production. Their investigation encompassed a diverse range of sources, including pine wood chips, grape marc, forest residues, rice straw, and macroalgae. The chief aim of their research was to discern how the choice of biomass influenced not only H 2 production but also the formation of harmful compounds and the overall gasification yield achieved through plasma technology. Notably, the outcomes revealed a consistent H 2 concentration of 68 mol% in the syngas generated from all the studied biomass sources. Non-woody biomass sources showed a higher presence of sulfur compounds compared to woody sources, which can be explained by the inherent traits of non-woody materials. Among the tested options, pine wood emerged as the most favorable choice due to its exceptional efficiency in plasma gasification and the minimal presence of impurities in the resulting syngas, underlining its potential for sustainable H 2 production.
Wu and colleagues 81 conducted a comprehensive investigation into the presentation of methanol decomposition through a unique liquid-phase discharge setup, designed for enhanced visualization. The use of a high-speed camera in their study gave a detailed understanding of methanol decomposition and liquid-phase discharge processes. By changing the electrode spacing, the researchers were able to create two different plasma discharge modes: discharge (GD) and gliding arc discharge (GAD) glow. GD's current and voltage curves closely resemble the sinusoidal waveform of AC power supplies, with a discharge power range of 130.4 to 460.2. In contrast, GAD exhibited a unique feature of bipolar pulses, characterized by high transient peak currents (ranging from 420.6 to 690.9 mA), resulting in a lower discharge power of 30.7–110.3 W. Initial analyses revealed that GAD's energy consumption was notably lower than that of GD, primarily because of disparities in their discharge characteristics. By optimizing the process, we achieved an energy consumption rate of 1.63 kW h per cubic meter of H 2 for hydrogen production. The result of this approach was a gaseous product with a maximum hydrogen proportion of 63.21%, and carbon monoxide as the primary byproduct at 26.38%. These findings shed light on an efficient and sustainable method for hydrogen production.
Tabu and their team 82 accomplished the development of low-temperature, atmospheric pressure plasma reactors utilizing the principles of gliding arc (glidarc) discharges and transferred arc (transarc). These reactors were meticulously designed, constructed, and meticulously characterized to facilitate the conversion of low-density polyethylene (LDPE), serving as a representative model for plastic waste, into H 2 . Their experimental findings revealed a clear relationship between voltage levels and H 2 production rates and efficiency in both reactors. As voltage levels increased, H 2 production exhibited a steady rise. The transarc reactor achieved a maximum H 2 manufacture of 0.33 mmol g −1 LDPE, while the glidarc reactor surpassed this with a peak hydrogen production of 0.42 mmol g −1 LDPE. The transarc reactor showed increased hydrogen production with a narrower electrode-feedstock spacing. However, the glidarc reactor exhibited greater hydrogen generation when flow rates were moderate. Remarkably, despite their significantly different operational modes, both reactors delivered comparable H 2 production results. These findings represent a substantial step forward in the utilization of plastic waste for H 2 generation, offering valuable insights into the effectiveness of the transarc and glidarc technologies.
Conventional approaches to H 2 production encompass processes like water electrolysis, biomass gasification, coal gasification, and steam methane reforming. However, many of these methods, particularly those relying on fossil fuels, are associated with substantial carbon emissions, which run counter to the aim of achieving carbon neutrality. Future H 2 production should prioritize renewable resources and minimizing carbon emissions. 83–85
2.3. Renewable energy-powered hydrogen generation systems
Water electrolysis, despite being naturally endothermic, needs a higher voltage than the theoretical electrolysis voltage because of ohmic and overpotential loss.
In a study conducted by Gandia et al. 87 they conducted, simulations to explore the production of H 2 through wind energy. Their findings revealed significant temperature fluctuations during transient operation, with notable temperature spikes observed under high-power generation conditions and, conversely, temperature decreases during low-power generation scenarios. Notably, the study identified a safety concern related to gas crossover, specifically the presence of O 2 in the H 2 stream and H 2 in the O 2 stream. The crossover gases reached high concentrations, especially when the gas volume decreased due to low power generation. This was mainly because the current determined the total of hydrogen gas manufactured. This underscores the importance of addressing safety considerations in H 2 production processes. Hence, the variability in the power supply altered the condition of the electrolyzer, impacting the purity of the gas produced. 88 Furthermore, The research by Ursúa et al. ( Fig. 4 ), 86 they found that during the operation of an alkaline water electrolyzer without additional devices, a requirement was established to maintain a minimum power load of 40%. The objective is to maximize the employment of renewable energy resources by evaluating if it's feasible to operate alkaline water electrolyzers below the minimum power load. 86 They aimed to improve the utilization of renewable energy sources. The outcomes of their study revealed that the system could sustain operation for up to 20 minutes under these conditions. Moreover, by implementing these adjustments, they were able to reduce the frequency of operational halts in a water electrolyzer powered by photovoltaic energy by half. Consequently, this approach led to an enhancement in energy efficiency by an additional 6.3%.
| Configurations for the integration of electrolysers with renewable energies in stand-alone systems. | ||
In their extensive research, Stansberry et al. 89 embarked on a series of experiments employing a 60 kW proton exchange membrane (PEM) water electrolyzer driven by a combination of wind power and photovoltaic sources. Within the complex system, the most significant energy loss, marked by the inadvertent release of hydrogen gas, was observed in the pressure swing adsorption dehumidification unit, closely followed by energy losses within auxiliary equipment and the power consumption associated with alternating/direct current (AC/DC) conversion units. The overall efficiency of water electrolysis was greatly affected by the accumulation of these losses, especially at lower electric power levels, resulting in a rated current drop below 50%. These fluctuations in power delivery resulted in similar adverse scenarios for the electrolyzers. As such, it becomes paramount to improve a comprehensive sympathetic of the mechanisms underlying the varying capabilities to support such fluctuating operations. This understanding can be attained by shedding light on the factors that dictate these abilities, which encompass factors like cell structures and the integration of auxiliary equipment. These insights are essential for improving the competence of water electrolysis in renewable energy systems.
Photovoltaic and wind energy production operate in diverse time cycles and exhibit varying power output fluctuations. These traits give rise to several challenges in the operation of electrolyzers. Notably, fluctuating power can lead to electrode degradation owing to abrupt shifts in electrode potential. A significant factor in this degradation is the reverse current generated during operational halts, resulting in a substantial deterioration of electrode performance. 76
2.4. Water splitting by photocatalysis
| h + □ + H O → H + □ + OH | (1) |
| O + 2e + 2H → H O | (2) |
| O + e → O | (3) |
| H O + O → OH + OH + O | (4) |
| h + □ + OH → OH | (5) |
| H + e → H | (6) |
| H + H → H | (7) |
The foundation of photocatalytic H 2 production lies in the semiconductor photocatalyst, which utilizes solar energy to split water. When light of a specific wavelength (a photons with a particular energy) strikes the photocatalyst, it energizes electrons from the valence band to the conduction band (CB). This event results in the creation of electron–hole (e − –h + ) pairs, which play a pivotal role in driving the redox reactions occurring on the surface of the photocatalyst. Basic water splitting illustration is found in ( Fig. 5 ).
| Illustration of the photocatalyst water splitting process, (1) the absorption of light radiation from a light source, (2) the separation of electron–hole pairs, and (3) redox reaction. | ||
Yan and his team, 92 achieved a remarkable milestone by developing a novel Ni 2 P/NiS@polymeric carbon–oxygen semiconductor (PCOS). Their work resulted in a groundbreaking achievement, with a notable production rate of 70.2 μmol h −1 of O 2 and 150.7 μmol h −1 of H 2 produced for every 100 mg of photocatalyst. Interestingly, the reaction solution also exhibited the presence of H 2 peroxide, initially at a rate of approximately 100 μmol h −1 over the first 2 hours. This hydrogen peroxide had a detrimental impact on the photocatalyst's performance. However, the introduction of MnO 2 effectively mitigated this negative effect, resulting in excellent and stable rates of photocatalytic H 2 and O 2 production.
Ruan and colleagues ( Fig. 6 ) 93 introduced a groundbreaking method that marks the inaugural attempt to leverage a straightforward ethylenediaminetetraacetate (EDTA) etching process. Their goal was to enhance the number of active surface sites on photocatalysts and reduce particle size, all while preserving high crystallinity. Among the tested materials, STO-2 demonstrated remarkable performance, achieving the highest activity levels. Specifically, it facilitated H 2 production at an impressive rate of up to 310 μmol g −1 h −1 and O 2 evolution at 155 μmol g −1 h −1 . What makes their work even more intriguing is that the EDTA etching technique holds substantial promise for broader applications. Since EDTA can interact with a wide array of metals, this uncomplicated method has the potential to be further refined for the modification of various photocatalysts, enhancing their performance in a myriad of applications.
| Schematic diagram of photocatalytic water splitting of samples. | ||
Saleh and the research team 94 delved into an exploration of various TiO 2 nanocomposites enriched with two co-catalysts: Cu or Pt nanocrystals in the 3–4 nm range. These nanocomposites were synthesized through different methods, including photo-deposition, hydrothermal, and incipient wet impregnation. The results yielded a noteworthy discovery: the optimal H 2 generation occurred with a mass filling of 0.3 wt% for both co-catalysts. What's particularly remarkable is that, even in the absence of a precious metal like Pt, the Cu/TiO 2 nanocomposites, produced through the photo-deposition method, demonstrated a preliminary degree of 24 mmol h −1 g −1 . This rate was 3.5 times greater than those synthesized using the hydrothermal method and 1.4 times greater than those produced with the impregnation method. Conversely, for Pt co-catalysts, the highest rate was observed in the impregnation-synthesized composites, clocking in at 58 mmol h −1 g −1 , surpassing the rates from the photo-deposition and hydrothermal synthesis methods by 1.6 and 1.1 times, respectively.
From ( Table 3 ). The current analysis underscores that non-green methods of hydrogen production, including SMR and coal gasification, demonstrate superior efficiency and cost-effectiveness when compared to their green counterparts, such as electrolysis powered by renewable energy. Despite their environmental drawbacks, these conventional methods offer a more mature and economically viable pathway for large-scale hydrogen production in the immediate term. However, the urgent need to mitigate climate change and reduce greenhouse gas emissions necessitates a dual focus in future research endeavors.
| Production method | Energy efficiency% | Production cost, € per kg H | Characters |
|---|---|---|---|
| SMR | 70–85 | 0.56–1.12 | High efficiency, low cost, mature technology, large emissions |
| Partial oxidation of methane | 60–78 | 0.78–1.68 | |
| Coal gasification | 50–70 | 0.56–1.12 | |
| Electrolysis of water (fossil energy) | 62–82 | 1.79–3.36 | High power consumption, high cost, high H purity |
| Wind electrolysis of water | — | — | Zero emissions, high cost, low conversion rate |
| Solar electrolysis of water | — | — |
It is imperative to enhance the cost-competitiveness and efficiency of green hydrogen production technologies. Significant advancements are required in areas such as electrolyzer technology, renewable energy integration, and novel catalyst development to bridge the gap between green and non-green hydrogen production. Furthermore, comprehensive cost-benefit analyses and life cycle assessments should be prioritized to ensure that the environmental benefits of green hydrogen are realized without compromising economic feasibility. Therefore, the next frontier in hydrogen research should aim to lower the production costs of green hydrogen while simultaneously improving its efficiency. This dual approach will not only facilitate a more sustainable hydrogen economy but also align with global environmental and economic goals. Only through such concerted efforts can we transition to a truly sustainable and scalable hydrogen infrastructure.
Moreover, the kinetics of hydrogen absorption and desorption is a critical focus area, with researchers aiming to enhance these rates to facilitate rapid and efficient hydrogen storage cycles. This involves exploring nanostructured materials, which can offer increased surface areas and improved kinetics, and composite materials, which can tailor properties through synergistic interactions. Stability, both thermal and chemical, is also crucial to ensure durability over many cycles and to maintain performance without degradation. Safety and cost-effectiveness further underpin the practical deployment of these materials, necessitating that they be non-toxic, non-explosive, and economically viable for large-scale use. As such, the development of hydrogen storage materials is a multifaceted challenge, requiring a comprehensive approach to optimize capacity, kinetics, stability, and safety while maintaining economic feasibility.
The effectiveness of materials in storing H 2 is closely tied to their physical and chemical characteristics, with a particular emphasis on their thermodynamic and kinetic properties. 95 Up to now, the predominant technological challenge in establishing a sustainable H 2 economy has been the creation of effective H 2 storage systems. When evaluating methods and materials for H 2 storage, it's essential to consider various factors, including the design of high-pressure tanks, the densities of H 2 in terms of weight and volume, refueling speed, energy efficiency, cost, durability, adherence to standards, technical readiness, and comprehensive assessments of both life cycle and efficiency. 96 To make H 2 suitable for transportation, it's essential to enhance its energy density. Several methods have been suggested to achieve this, including liquefaction, compression, the formation of metal hydrides, and the utilization of liquid organic transporters such as conversion into energy carriers like methanol and ammonia. 97,98
3.1. Compressed hydrogen
3.2. liquid hydrogen, 3.3. methanol, 3.4. formic acid, 3.5. ammonia.
Furthermore, NH 3 can be effectively broken down into a blend of N 2 and H 2 gases, resulting in the generation of larger quantities of high-purity H 2 while leaving no carbon footprint. This distinguishes it from hydrocarbon-based organic carriers like methane and methanol, which inevitably produce carbon dioxide. NH 3 also offers the advantage of being easier to maintain in a liquid state due to its lower boiling point compared with H 2 or methane. At room temperature, NH 3 can be liquefied with a moderate pressure of 1.0 MPa. 110,111
Economic assessments have demonstrated that NH 3 holds greater promise in comparison to conventional fuels as methanol, liquefied petroleum gas (LPG), natural gas, gasoline, and hydrogen, primarily due to its absence of CO 2 emissions. 112 Furthermore, when compared to liquid H 2 (8.49 MJ L −1 ) and compressed H 2 (5.0 MJ L −1 at 70.0 MPa and 25 °C), liquid NH 3 boasts a greater volumetric energy density, measuring at 10.5 MJ L −1 . 113 NH 3 further distinguishes itself with a superior heat of combustion compared to liquid H 2 at 8.58 MJ L −1 and nearly doubles the value of compressed H 2 at 5.0 MJ L −1 . Additionally, NH 3 is less dense than air (0.769 versus 1.225 kg m −3 at standard temperature and pressure). Under atmospheric conditions, gaseous NH 3 can disperse relatively quickly into the atmosphere, mitigating the potential explosion and fire hazards in case of accidental release. The fire risk is lower for NH 3 than H 2 , mainly because NH 3 has a higher auto-ignition temperature. 114
3.6. Metal hydrides
Selecting suitable metal hydride materials for high efficiency in reversible hydrogen storage and release involves considering several critical factors. First, the hydrogen storage capacity of the material is paramount; it should possess a high gravimetric (wt%) and volumetric capacity to store sufficient hydrogen. For instance, magnesium hydride (MgH 2 ) offers a high hydrogen storage capacity of about 7.6 wt%. Secondly, the thermodynamics of the material, specifically the operating temperatures and pressures for hydrogen absorption (hydrogenation) and desorption (dehydrogenation), must be suitable for practical applications. A moderate enthalpy of formation is essential to balance storage capacity and ease of hydrogen release. Sodium alanate (NaAlH 4 ), which operates at around 150 °C and 5 MPa, exemplifies favorable thermodynamics.
Kinetics is another crucial factor; the material should exhibit fast kinetics for both hydrogen absorption and desorption to minimize energy losses and reduce the time required for charging and discharging. For example, adding Ti-based catalysts to sodium alanate significantly improves its kinetics. Stability over multiple hydrogenation/dehydrogenation cycles is also vital, as the material must resist degradation and maintain its structural integrity and hydrogen storage capacity. LaNi 5 H 6 is noted for its good cycling stability and moderate operating conditions.
Safety and environmental impact are also key considerations. The material should be safe to handle, with minimal risk of toxicity or flammability, and should have a low environmental impact during production, use, and disposal. Magnesium hydride, for instance, is relatively safe and environmentally benign compared to more reactive or toxic materials like lithium hydride. Cost and availability are important practical concerns; the material should be cost-effective and readily available for large-scale applications. MgH 2 , being abundant and inexpensive, is a popular choice for many applications.
Enhancements through additives and composites can significantly improve the performance of metal hydrides, enhancing their kinetics and thermodynamic properties. For example, mixing MgH 2 with transition metal catalysts like Ti or Ni can dramatically enhance its hydrogen absorption and desorption rates. Finally, the suitability of a material depends on the specific application, whether for stationary storage, mobile applications, or portable devices. LaNi 5 H 6 , with its moderate pressure and temperature requirements, is suitable for various applications, while MgH 2 , due to its higher operational temperatures, is more apt for stationary storage.
Gao and colleagues 124 introduced a solid-solution MAX phase TiVAlC catalyst directly into the MgH 2 system, without the need for etching treatment, to enhance H 2 storage performance. At 300 °C, the optimized MgH 2 -10 wt% TiVAlC composite can absorb about 4.82 wt% of H 2 at 175 °C in 900 seconds and release around 6.00 wt% of H 2 in 378 seconds. Impressively, even after undergoing 50 isothermal H 2 absorption/desorption cycles, the composite exhibits exceptional cyclic stability and retains 99.6% of its capacity, which is 6.4 wt%. The abundant electron transfer at the external interfaces with MgH 2 /Mg is what gives the TiVAlC catalyst its remarkable catalytic activity. Abundant electron transfer occurs at internal interfaces (Ti 3 AlC 2 /TiVAlC) due to the presence of an impurity phase, Ti 3 AlC 2 , enhancing electron transfer and showing strong H 2 affinity. This study is the first to explore the impact of impurity phases, which are commonly found in MAX phases, on all catalyst activity. It provides a distinct method for designing composite catalysts that enhance the hydrogen storage capabilities of MgH 2 .
Li and his team 125 developed nanosheets of a medium-entropy alloy called CrCoNi. The addition of these nanosheets greatly boosted MgH 2 's capacity for storing hydrogen at low temperatures. The dehydrogenation temperature of 9 wt% CrCoNi modified MgH 2 decreased by 130 °C from 325 °C to 195 °C, surprisingly. Additionally, the composite of MgH 2 –CrCoNi discharged 4.84 wt% of hydrogen in only 5 minutes at 300 °C and absorbed 3.19 wt% of H 2 in just 30 minutes at 100 °C (at 3.2 MPa). There was a decrease in activation energy by 45 kJ mol −1 for dehydrogenation, and a decrease by 55 kJ mol −1 for rehydrogenation. Through extensive cyclic kinetics analysis, it was discovered that the 9 wt% CrCoNi-doped MgH 2 showed exceptional strength even subsequently 20 cycles, with a mere 0.36 wt% decrease in H 2 capacity. The stability of CrCoNi was confirmed by XRD patterns during the cyclic reaction process. Additionally, there was a uniform dispersion of CrCoNi nanosheets on the surface of MgH 2 , resulting in numerous catalytic active sites and facile diffusion pathways with low energy barriers. Exceptional kinetic performance was achieved due to the synergistic catalysis that facilitated the rapid absorption and release of hydrogen atoms across the Mg/MgH 2 interface.
A novel technique was developed by Zhang and the research team 126 to boost the dehydrogenation and rehydrogenation capabilities of MgH 2 . The introduction of carbon-wrapped Ti and Co bimetallic oxide nanocages (Ti–CoO@C) made this possible. Through a precise hydrothermal method, the nanocages were synthesized and then mixed with MgH 2 using mechanical ball milling. The hydrogen desorption was notably influenced, as MgH 2 with 5 wt% Ti–CoO@C began desorbing hydrogen at 185.6 °C, a considerable 160.2 °C decrease compared to pure MgH 2 . Within a short span of 5 minutes, the composite released an astonishing 6.3 wt% H 2 at 275 °C. The MgH 2 + 5 wt% Ti–CoO@C composite exhibited a significant reduction in activation energy for H 2 desorption/absorption, dropping from 169.19 kJ mol −1 and 83.61 kJ mol −1 for MgH 2 to 137.76 kJ mol −1 and 35.17 kJ mol −1 , respectively. Furthermore, the composite displayed exceptional stability, with no significant decline in performance observed even after 20 cycles. The catalyst's even distribution and the in situ formation of titanium and MgO are responsible for the remarkable hydrogen storage performance. In addition, the promoting effect of Mg 2 Co/Mg 2 CoH 5 functioned as a H 2 pump, thereby contributing to the improved performance. Furthermore, carbon played a vital part in catalyst nanosizing and in reducing the strength of the Mg–H bond in MgH 2 . As a result, the 5 wt% Ti–CoO@C + MgH 2 composite exhibits outstanding hydrogen storage capabilities.
Ali and the research team 129 successfully developed CoTiO 3 through the solid-state method, and this novel material proved highly operative in ornamental the desorption behavior of NaAlH 4 for H 2 storage. The introduction of dissimilar weight percentages of CoTiO 3 (ranging from 5 wt% to 20 wt%) had a profound impact. NaAlH 4 's initial desorption temperature significantly decreased due to the inclusion of CoTiO 3 catalysts. In the first desorption stage, the temperature decreased to about 130–160 °C, and in the second stage, it decreased to around 182–198 °C. These temperatures are much lower compared to untreated milled NaAlH 4 . The composite samples showed significantly faster desorption kinetics at 150 °C. A range of 3.0–3.7 was observed during the release of the NaAlH 4 –CoTiO 3 composite. The activation energies for the two stages of NaAlH 4 desorption were greatly decreased. They were lowered to 85.5 and 91.6 kJ mol −1 , which is a reduction of 30.7 and 35.5 kJ mol −1 compared to untreated milled NaAlH 4 , respectively. The formation of Al–Co and Al–Ti alloys during the desorption of NaAlH 4 –CoTiO 3 is responsible for the remarkable catalytic effect of CoTiO 3 . These discoveries create new possibilities for the advancement of efficient catalysts for NaAlH 4 , showing its potential for H 2 storage purposes.
In a theoretical simulation by Mekky, 130 the research explored the characteristics of pure Na 12 Al 12 H 48 , and their variations with an interstitial doping of C, H, and Ti atoms. These clusters are being considered as a talented system for H 2 storage. The study found that, when compared to the interstitial space-doped clusters, the pure Na 12 Al 12 H 48 clusters exhibited greater stability. The introduction of interstitial space-doped C, Ti, and H atoms into Na 12 Al 12 H 48 did not significantly alter the lattice structure, and, notably, these atoms acted more than catalysts rather than traditional “interstitial space doping” elements. Additionally, the study found that the Na 12 Al 12 H 48 cluster displayed greater stability, but less chemical reactivity compared to the interstitial-doped clusters. When interstitial space-doped C, H, and Ti atoms were added to Na 12 Al 12 H 48 , the lattice structure remained largely unchanged. This confirms that Ti, C, and H atoms play a catalytic role rather than simply being interstitially doped into space.
Urunkar and their team 131 conducted a numerical analysis of a hydride reactor occupied with sodium alanate, specifically examining the absorption process within multiple tubes. They developed a mathematical model for the hydride reactor based on various governing equations and validated it using ANSYS Fluent. In general, water or oil is used in the hydride reactor to transfer heat while absorbing H 2 . The study replaced traditional heat transfer fluid with nanofluid for its better heat exchange properties. The research yielded results across several parameters, including the choice of nanoparticle material, nanoparticle concentration, H 2 supply pressure, and the inlet temperature of the heat exchange fluid. The absorption rate of the CuO/HTF nanofluid showed significant improvement, specifically at a 5 vol% concentration, surpassing other concentrations and selected nanofluids. This improvement translated to a 14% reduction in H 2 absorption time under specific conditions. Moreover, the CuO/HTF nanofluid with a 5 vol% concentration exhibited superior thermodynamic performance in comparison to other nanofluids, resulting in a 10% increase in heat exchange rate for the hydride reactor. The study found that the CuO/HTF nanofluid with a 5 vol% concentration performed better than the other nanofluids in the hydride reactor. This highlights the benefits of using nanofluids in this application.
The evaluation of various storage methods for green hydrogen reveals a diverse array of options, each with distinct advantages and challenges. Compressed hydrogen and liquid hydrogen offer straightforward and mature technologies but are hindered by high energy requirements and safety concerns related to pressurization and cryogenic temperatures. Chemical manufacturing of hydrogen carriers such as ammonia, methanol, and formic acid presents a promising alternative, providing a more stable and potentially safer means of storage and transportation. However, these methods require further optimization to improve the efficiency of hydrogen release and to reduce associated carbon emissions. On the other hand, metal hydrides, including sodium alanate and magnesium hydride, demonstrate significant potential due to their high hydrogen storage densities and relatively moderate operating conditions. Nevertheless, the commercialization of metal hydride storage is currently limited by issues related to material cost, kinetics, and cyclic stability.
It is clear that while several methods show promise, no single storage technology currently meets all the criteria for widespread adoption. Therefore, ongoing research is essential to address the technical and economic barriers associated with each storage method. Future studies should focus on enhancing the efficiency of hydrogen release, reducing material costs, and improving the safety and feasibility of large-scale deployment. By advancing these areas, the development of an optimal hydrogen storage solution can be accelerated, thereby facilitating the broader adoption of green hydrogen as a key component of the global energy transition.
4. Applications
4.1. domestic uses.
Hydrogen has 2.4 times more energy per unit mass than methane. However, due to its low density, its lower heating value (LHV) per unit volume is three times lower than methane. This results in a reduction of the energy content in the gas blend as the hydrogen concentration increases. From a safety perspective, higher hydrogen concentrations raise the risk of fire and explosion. Hydrogen has a much broader flammability range (5.3 times) and detonation limit range (7.1 times) compared to methane. Additionally, it has a significantly lower ignition energy (14.5 times lower), making it more easily ignitable and increasing the fire risk.
Utilizing current pipeline systems to blend hydrogen with natural gas ( Table 4 ) offers the most affordable means of transporting significant quantities of hydrogen over long distances without requiring new infrastructure. Nonetheless, because hydrogen molecules are smaller and have unique physical characteristics, including lower density and viscosity, the mixture exhibits behavior distinct from that of pure natural gas. 139,140 This introduces potential safety hazards for pipelines designed specifically for natural gas. To keep the energy output consistent, the mixture with hydrogen may require higher flow rates, leading to increased operating pressures that could surpass the design limits of the compressors and pipelines originally meant for natural gas. Hence, it is essential to consider redesigning these systems to safely transport the hydrogen blend and to identify any risks and operational challenges associated with varying hydrogen concentrations. It is crucial to maintain a uniform mixture of the blended gas along the entire pipeline. Significant density differences between the gases can cause them to separate, leading to varied flow behaviors and leak issues. This separation can result in inconsistent energy distribution and operational challenges in the pipeline. 134
| Project | Country | Network | Electrolyser capacity | Hydrogen blend % |
|---|---|---|---|---|
| HyP SA | Australia | Distribution | 1.2 MW | 5% |
| ATCO-CEIH | Australia | Distribution | 0.15 MW | 5–25% |
| HyDeploy | UK | Distribution | 0.5 MW | 20% |
| Jupiter 1000 | France | Transmission | 1.0 MW | 6% |
M. Ozturk et al. ( Fig. 7 ), 141 conducted an experimental investigation to analyze the impact of adding hydrogen to natural gas on emissions and combustion performance. They burned natural gas and various natural gas-hydrogen blends (with 10%, 20%, and 30% hydrogen by volume) in identical gas stoves and measured emissions of CO, CO 2 , and NO x . The results showed that increasing the hydrogen content improved combustion efficiency from 39.32% to 44.4%. Higher hydrogen ratios reduced CO 2 and CO emissions, but NO x emissions varied. A life cycle analysis assessed the environmental impact of the different blending scenarios. With a blend containing 30% hydrogen, the global warming potential decreased from 6.233 to 6.123 kg CO 2 equivalents per kg blend , and the acidification potential dropped from 0.0507 to 0.04928 kg SO 2 equivalents per kg blend compared to pure natural gas. However, there were slight increases in human toxicity, abiotic depletion, and ozone depletion potentials per kg blend, rising from 5.30 to 5.52 kg 1,4-dichlorobenzene (DCB) equivalents, 0.0000107 to 0.00005921 kg Sb equivalents, and 3.17 × 10 −8 to 5.38 × 10 −8 kg CFC-11 equivalents, respectively.
| Illustration of the benefit from blending green H with natural gas. | ||
4.2. Steel manufacturing
| Fe O + 3H → 2Fe + 3H O | (8) |
It was clear now that hydrogen metallurgy offers several advantages. Firstly, it produces H 2 O as a reduction product, reducing reliance on fossil fuels like coal and coke and decreasing CO 2 emissions. Additionally, H 2 serves as a superior reductant compared to CO, thanks to its higher calorific value, lower density, enhanced penetration, and faster reduction rate. The availability of abundant raw materials for H 2 production ensures a readily available supply. Moreover, H 2 metallurgy can stimulate the rapid growth of DRI processes by substituting natural gas with H 2 , which is valuable in localities with limited natural gas resources, such as China. In general, H 2 metallurgy plays a role in the sustainable development of iron and steel enterprises.
4.3. Chemical manufacturing (methanol, methane, green ammonia, formic acid)
| Illustration of the manufacturing of different organic materials using carbon capture and green hydrogen production. | ||
| Showing the different chemical products that can be generated by green H . | ||
| Visual representation of the chemical structure of (a) methanol, (b) ammonia, (c) methane, and (d) formic acid. | ||
Dongliang and colleagues 165 introduced an innovative approach for H 2 production coupled with CO 2 application in the coal-to-methanol (CTM) process. They termed this new approach the GH-CTM process, designed to enhance material integration, carbon efficiency, and methanol yield. Through comprehensive process modeling, parameter optimization, and simulations, the results demonstrated remarkable improvements compared to the conventional CTM process. The GH-CTM process exhibited a 10.52% higher energy efficiency, an 85.64% reduction in CO 2 emissions, and a remarkable 124.67% increase in methanol production. In addition, the proposed process had significantly slowed production costs, 23.95% less than the traditional CTM process. Notably, the payback period for investment in the GH-CTM process was substantially shorter, at 2.8 years, compared to the CTM process's 7.2 years. Moreover, the GH-CTM process experienced a 47.37% increase in internal rate of return compared to the traditional CTM process. This new approach shows potential for introducing green H 2 , utilizing CO 2 , and transforming coal into valuable chemicals sustainably.
A preliminary assessment by Sollai and their team 166 looked into a power-to-fuel plant setup for generating 500 kg h −1 of renewable methanol using green H 2 and captured CO 2 . They developed a comprehensive process model employing the Aspen Plus tool, which simulated all aspects of the plant and the system as a whole. Once the process was optimized, a comprehensive economic analysis was performed, considering operating and capital costs derived from real-world experience at a commercial scale, with a projected operational lifetime of 20 years. Through the analysis, it was determined that the LCoM is 960 € per t, which translates to around 175 € per MW h. While the study showed that, as of the present, the technology isn't yet economically competitive, with the LCoM exceedingly double the prevailing international methanol price of 450 € per t, it does indicate a potential shift towards competitiveness in the medium-term future, largely driven by evolving European policies. Additionally, the research revealed that LCoM is particularly influenced by factors such as electricity prices, electrolyzer capital costs, and the plant's capacity factor.
| (9) |
As outlined by MacFarlane et al. , 168 various approaches for green ammonia production can be categorized: First-generation green ammonia involves capturing carbon emissions post-ammonia production and storing it, resulting in what is referred to as “blue ammonia”. Second-generation green ammonia focuses on producing ammonia from environmentally friendly feedstocks, namely N 2 and H 2 . This approach aims to transform the traditional Haber–Bosch process into a sustainable source. Third-generation green ammonia entails departing from the conservative Haber–Bosch process and adopting alternative methods that prioritize high stability, sustainability, and the use of renewable sources for ammonia production.
Currently, various methods exist for the indirect generation of environmentally friendly ammonia, such as microbial electrolysis, 169 photosynthesis, 170 dark fermentation, 171 and electrolysis. 172 Electrochemical techniques have garnered significant attention in numerous nations. 173
An enhanced optimization-based simulation model was introduced by Zhao and their team 174 to simulate the long-term sustainability of green manufacturing. They investigated the effect of significant institutional incentives and the collaborative effects of O 2 on investments. According to the study, the estimated levelized cost of ammonia is about 820 USD per t, which is nearly twice the current market price. Several factors were identified as pivotal in green ammonia investments, including the operational rate, the electrical efficiency of electrolyzers, electricity costs, and ammonia pricing. China's energy transition was greatly influenced by carbon pricing and VAT exemptions. To bridge the gap, a subsidy of about 450 USD per t would be needed based on the current pricing, but this could be lowered by 100 USD per t through the implementation of O 2 synergy. Comparatively, green NH 3 production exhibited both environmental and economic advantages when contrasted with inter-regional power transmission. The study thus advocates a balanced approach, leveraging both options to address integrating O 2 manufacturing into H 2 production and renewable power curtailment processes. By mitigating renewable power curtailment, this research aims to encouragement the increase of the H 2 economy in China.
Bouaboula and the research team 176 developed a new Techno-Economic (TE) modeling method. Their goal was to optimize the operation and design of a pilot-scale Green Ammonia plant. The intermittent nature of renewable energy sources is taken into account in this novel TE model. In order to deal with this, we examined multiple site locations that had consistent meteorological data each year. Furthermore, the model includes a unique Energy Management Strategy (EMS) to ensure a continuous power supply for the Haber–Bosch (HB) reactor. The EMS ensures the smooth distribution of power from renewable sources to charge and discharge Energy Storage Systems (ESS). Two main Key Performance Indicators (KPIs) were used to evaluating the plant's performance: Levelized Cost of Ammonia (LCOA) and HB Load Factor (LF). The findings indicated that the implemented EMS effectively reduced the fluctuations in RE sources by optimally distributing power across different time slots. Consequently, the HB LF rose by 56% to 65%, based on the particular RE setup. The increase in LF resulted in lower plant costs due to higher production yield outweighing investment and operational expenses. The PV/Battery scenario, consisting of 6 MW of PV and 11 MW h of battery capacity, was identified as the most efficient plant configuration, with a LCOA of $774 per t NH 3 . By 2050, the estimated cost of NH 3 could decrease to $250 per ton according to a forecast. Furthermore, it suggests that green ammonia is expected to be economically competitive with conventional fossil fuel approaches by 2030.
Pignataro et al. 179 presented three management strategies (MSs) for controlling the H 2 storage tank and methanation unit in the power-to-gas system. The most influential operational variables were determined through a systematic comparison of these MSs, and their impact on system performance was evaluated. The first strategy, denoted as MSA, stood out as the most straightforward of the three. When the produced H 2 falls within the operational range, MSB closely resembled MSA in its behavior when operational constraints were breached. The control algorithm of MSC was similar to MSB, but the storage tank supplied different amounts of additional H 2 during “in-range” methanation operations. While the methanation unit was running, we considered a scenario where the setpoint for methanation matched the flow rate from the electrolysis system (ES). The findings indicated that MSA and MSB exhibited similarities in the methanation unit and CH 4 production utilization factor. Despite this, MSB demonstrated greater efficiency in handling methanation unit shutdowns, albeit with the drawback of needing a bigger storage system. On the other hand, MSC demonstrated the highest CH 4 production but had more shutdowns and used a smaller storage system. Nonetheless, the results consistently showed a low average state of charge (SOC) for the storage in all MSs, suggesting that the system components may not have been sized optimally. Further investigation is needed to explore how resizing different subsystems impacts system performance and cost. Ultimately, the selection of the management strategy varies on the goal and feasibility of utilizing excess H 2 in the power-to-methane system.
In a comprehensive study, Garcia-Luna et al. 180 focused on integrating waste biomass oxycombustion with a power-to-methane system. Their approach primarily relies on using photovoltaic solar energy to drive PEM electrolysis and produce H 2 and O 2 . The gases are utilized in a sub-critical steam power cycle for waste combustion. Depending on the operational strategy, an air separation process utilizing cryogenic distillation can generate an extra O 2 . Following purification and compression, the CO 2 stream is directed towards the methanation reactor. The researchers created a quasi-stationary model to simulate the entire plant and assess integration efficiency under different operational conditions. According to their study, the entire plant integration shows high efficiency, with a CO 2 reduction associated efficiency penalty of approximately 6% points on average per year. The system reduces emissions by using waste biomass as the primary fuel source, resulting in a −610 kg CO 2 per MW h reduction compared to biomass plants without CO 2 capture. Furthermore, a comprehensive annual techno-economic study shows an average levelized electricity cost of €56 per MW h and an average green CH 4 production cost of €12 per MW h. The results support the implementation of this system in both new and retrofitted biomass power plants because the CO 2 capture cost is around 65.66 € per ton of CO 2 .
Gong and his team 184 developed an advanced integrated system that merges methanol selective oxidation reaction and the H 2 evolution reaction. By incorporating a power management system, this system operates on a UDC RF-Pulsed-TENG. At the cathode, green H 2 is produced in this setup, while simultaneously generating the high-value chemical product, FA, at the anode. Applying a constant voltage of 1.8 V to the electrochemical cell after power management resulted in 1.68 times increase in the green H 2 production rate. The entire system produces green H 2 at a rate of 14.69 μL min −1 with 100% Faraday efficiency. Additionally, it allows for the simultaneous and quick generation of pure green H 2 and valuable FA using clean energy sources.
4.4. Hydrogen fuel cells
| SOFCs | MCFCs | PAFCs | AFCs | PEMFCs | |
|---|---|---|---|---|---|
| Electrolyte | Ceramics | Molten carbonate | Phosphoric acid | Potassium hydroxide | Polymeric membrane |
| Charge carriers | O | CO3 | H | OH | H |
| Operating temperature | 500 to 1000 °C | 600 to 700 °C | 150 to 220 °C | 50 to 200 °C | −40 to 120 °C (150 to180 °C in high temp. PEMFCs) |
| Electrical efficiency | Up to 65% | Up to 60% | Up to 45% | Up to 70% | Up to 65–72% |
| Primary fuel | H , biogas, or methane | H , biogas, or CH | H or reformed H | H or cracked ammonia | H , reformed H , methanol in direct methanol fuel cells |
| Primary applications | Stationary | Stationary | Stationary | Portable and stationary | Portable, transportation, and small-scale stationary |
| Power delivery (2019) | 78.1 MW | 10.2 MW | 106.7 MW | 0 MW | 934.2 MW |
5. Economics
The concept of the H 2 economy is not far-fetched. Presently, gray and blue H 2 are priced between $1.20 and $2.40 per kilogram, subject to the expense of carbon capture and storage. The cost of green hydrogen is approximately $4.85 per kilogram, taking into account an electricity cost of $53 per MW h and an efficiency of 65% at nominal capacity based on the lower heating value. However, it is anticipated that declining renewable electricity costs, enhanced electrolyzer efficiency, and reduced capital expenses will bring the cost of green H 2 to below $2.00 per kilogram by 2030, making it competitive with gray H 2 across various sectors, including industry. 195 The refining sector is projected to see a rise in demand for H 2 in the next decade, reaching approximately 41 million metric tons per year. 196 Also, the demand for methanol and ammonia is projected to experience substantial growth in the foreseeable future, driven by their usage in agriculture and their role as efficient energy carriers. 197
Several critical factors determine the economic viability of green H 2 production plants. Firstly, it is essential to have a substantial H 2 demand to justify the investment in such facilities. The industrial sector, particularly in applications such as steel production and chemicals, presents a significant opportunity for the utilization of green H 2 . Moreover, the economic feasibility is further enhanced when electricity prices are low, as the energy-intensive electrolysis process relies on affordable power sources. Additionally, the presence of high carbon taxes incentivizes industries to transition towards cleaner energy sources, making green H 2 a cost-effective solution for reducing emissions.
However, there are numerous challenges and opportunities associated with green H 2 production. One of the foremost challenges is the integration of these facilities with the existing energy grid. It can be challenging to balance intermittent renewable energy sources, such as solar and wind, with the steady demand for H 2 . Effective grid integration and energy storage solutions are critical to address this issue. Moreover, transportation and storage of H 2 , whether in gaseous or liquid form, pose logistical challenges. Infrastructure development is required to facilitate the efficient distribution and utilization of green hydrogen.
Lastly, policy support is paramount for the growth of the green H 2 sector. Governments can incentivize investment through subsidies and regulations that promote cleaner energy sources. By addressing these challenges and capitalizing on the opportunities, green H 2 production can become a transformative force in promoting sustainable energy solutions and reducing carbon emissions.
6. Limitations and future outlooks
Despite these challenges, the outlook for green hydrogen integration into large-scale projects is promising, aligning with the vision for a sustainable future by 2050. Technological advancements and increased production scales are expected to lower the cost of green H 2 . As renewable energy becomes more competitive, the production costs of green H 2 will benefit from reduced energy expenses. Research and development efforts are anticipated to yield more efficient and cost-effective electrolysis technologies, with breakthroughs in catalyst materials and cell designs significantly enhancing production efficiency. Establishing hydrogen infrastructure, such as pipelines and storage solutions, will facilitate the broad adoption of green H 2 across various industries, including transportation and power generation. Supportive government policies, including subsidies and carbon pricing mechanisms, are increasingly recognizing the role of green H 2 in decarbonizing industries, encouraging investment and growth in this sector. Regions rich in renewable energy are exploring the potential for exporting green H 2 , creating new economic opportunities and fostering international cooperation. Industries like chemicals and steel are progressively transitioning to green H 2 as a cleaner feedstock, driving demand and further reducing costs through economies of scale.
7. Conclusion
Data availability, conflicts of interest.
- G. Kalt, et al. , Conceptualizing energy services: A review of energy and well-being along the Energy Service Cascade, Energy Res. Social Sci. , 2019, 53 , 47–58 CrossRef .
- A. Vahidi and A. Sciarretta, Energy saving potentials of connected and automated vehicles, Transport. Res. C Emerg. Technol. , 2018, 95 , 822–843 CrossRef .
- E. M. Oziolor, et al. , Adaptive introgression enables evolutionary rescue from extreme environmental pollution, Science , 2019, 364 (6439), 455–457 CrossRef CAS PubMed .
- S. Wei, W. Jiandong and H. Saleem, The impact of renewable energy transition, green growth, green trade and green innovation on environmental quality: Evidence from top 10 green future countries, Front. Environ. Sci. , 2023, 10 , 1076859 CrossRef .
- I. Youm, et al. , Renewable energy activities in Senegal: a review, Renew. Sustain. Energy Rev. , 2000, 4 (1), 75–89 CrossRef .
- G. Hiemstra-van der Horst and A. J. Hovorka, Fuelwood: the “other” renewable energy source for Africa?, Biomass Bioenergy , 2009, 33 (11), 1605–1616 CrossRef .
- D. Hall, Cooling the greenhouse with bioenergy, Nature , 1991, 353 (6339), 11–12 CrossRef .
- C. Global, Emissions in 2019–Analysis , IEA, 2020 Search PubMed .
- M. Child, et al. , Sustainability guardrails for energy scenarios of the global energy transition, Renew. Sustain. Energy Rev. , 2018, 91 , 321–334 CrossRef .
- V. M. Maestre Muñoz, A. Ortiz Sainz de Aja, and I. Ortiz Uribe, Challenges and Prospects of Renewable Hydrogen-Based Strategies for Full Decarbonization of Stationary Power Applications , 2021 Search PubMed .
- T. Abbas, et al. , Biomass combined heat and power generation for Anticosti Island: A case study, J. Energy Power Eng. , 2020, 8 (03), 64 CrossRef .
- B. R. Kumar, Case 16: Three Gorges Dam—The World's Largest Hydroelectric Plant, in Project Finance: Structuring, Valuation and Risk Management for Major Projects , Springer, 2022, p. 183–186 Search PubMed .
- H.-Y. Wang, et al. , Optimal wind energy generation considering climatic variables by Deep Belief network (DBN) model based on modified coot optimization algorithm (MCOA), Sustain. Energy Technol. Assessments , 2022, 53 , 102744 CrossRef .
- M. Sutcu, et al. , Decision Making Of Suitable Bioenergy Power Plant Location: A Case Study. in ICRMAT . 2020 Search PubMed .
- T. Simla and W. Stanek, Influence of the wind energy sector on thermal power plants in the Polish energy system, Renewable Energy , 2020, 161 , 928–938 CrossRef .
- Z. Yang, et al. , Sizing utility-scale photovoltaic power generation for integration into a hydropower plant considering the effects of climate change: a case study in the Longyangxia of China, Energy , 2021, 236 , 121519 CrossRef .
- S. A. Awuku, et al. , Promoting the Solar Industry in Ghana through Effective Public-Private Partnership (PPP): Some Lessons from South Africa and Morocco, Energies , 2021, 15 (1), 17 CrossRef .
- B. R. Kumar, Case 21: Bhadla Solar Park, in Project Finance: Structuring, Valuation and Risk Management for Major Projects , Springer, 2022, p. 205–208 Search PubMed .
- K. Beladjine, F. Sadji and R. Beladjine, China Experience in Renewable Energies, Prospects , 2022, 60 (01), 700–718 Search PubMed .
- I. E. Agency, World Energy Investment 2022 , OECD Publishing, 2022 Search PubMed .
- M. Yue, et al. , Hydrogen energy systems: A critical review of technologies, applications, trends and challenges, Renew. Sustain. Energy Rev. , 2021, 146 , 111180 CrossRef .
- S. Bellani, M. R. Antognazza and F. Bonaccorso, Carbon-Based Photocathode Materials for Solar Hydrogen Production, Adv. Mater. , 2019, 31 (9), 1801446 CrossRef PubMed .
- Y. Wang, et al. , Non-Noble Metal-Based Catalysts Applied to Hydrogen Evolution from Hydrolysis of Boron Hydrides, Small Struct. , 2021, 2 (7), 2000135 CrossRef CAS .
- D. J. Veerendra Kumar, et al. , Performance evaluation of 1.1 mw grid-connected solar photovoltaic power plant in louisiana, Energies , 2022, 15 (9), 3420 CrossRef CAS .
- D. F. Duvenhage, et al. , Optimising the concentrating solar power potential in South Africa through an improved GIS analysis, Energies , 2020, 13 (12), 3258 CrossRef .
- J. Marchand, et al. , Emt real-time simulation model of a 2 gw offshore renewable energy hub integrating electrolysers, Energies , 2021, 14 (24), 8547 CrossRef .
- Y. Himri, et al. , Overview of the Role of Energy Resources in Algeria's Energy Transition, Energies , 2022, 15 (13), 4731 CrossRef .
- Y. Yu, et al. , Study on the Motion Characteristics of 10 MW Superconducting Floating Offshore Wind Turbine Considering 2nd Order Wave Effect, Energies , 2021, 14 (19), 6070 CrossRef .
- Y. Baba, A. H. Pandyaswargo and H. Onoda, An analysis of the current status of woody biomass gasification power generation in japan, Energies , 2020, 13 (18), 4903 CrossRef CAS .
- F. Battista, N. Frison and D. Bolzonella, Energy and nutrients' recovery in anaerobic digestion of agricultural biomass: An Italian perspective for future applications, Energies , 2019, 12 (17), 3287 CrossRef CAS .
- E. P. Garduño-Ruiz, et al. , Criteria for optimal site selection for ocean thermal energy conversion (Otec) plants in Mexico, Energies , 2021, 14 (8), 2121 CrossRef .
- K.-W. Ng, W.-H. Lam and K.-C. Ng, 2002–2012: 10 Years of Research Progress in Horizontal-Axis Marine Current Turbines, Energies , 2013, 6 (3), 1497–1526 CrossRef .
- V. Panchenko, et al. , Prospects for the production of green hydrogen: Review of countries with high potential, Int. J. Hydrogen Energy , 2023, 48 (12), 4551–4571 CrossRef CAS .
- M. A. Salam, et al. , A review of hydrogen production via biomass gasification and its prospect in Bangladesh, Int. J. Hydrogen Energy , 2018, 43 (32), 14944–14973 CrossRef CAS .
- A. M. Nasrabadi and M. Korpeh, Techno-economic analysis and optimization of a proposed solar-wind-driven multigeneration system; case study of Iran, Int. J. Hydrogen Energy , 2023, 48 (36), 13343–13361 CrossRef CAS .
- Y. Hu, et al. , Experimental evaluation of methanol steam reforming reactor heated by catalyst combustion for kW-class SOFC, Int. J. Hydrogen Energy , 2023, 48 (12), 4649–4664 CrossRef CAS .
- C. T. Rodrigues, et al. , An autonomous fuel cell: Methanol and dimethyl ether steam reforming direct fed to fuel cell, Int. J. Hydrogen Energy , 2023, 48 (10), 4052–4063 CrossRef CAS .
- A. V. Vorontsov and P. G. Smirniotis, Advancements in hydrogen energy research with the assistance of computational chemistry, Int. J. Hydrogen Energy , 2023, 14978–14999 CrossRef CAS .
- W. Zhou, et al. , Energy-saving cathodic H 2 production enabled by non-oxygen evolution anodic reactions: a critical review on fundamental principles and applications, Int. J. Hydrogen Energy , 2023, 15748–15770 CrossRef CAS .
- X. Ren, et al. , Challenges towards hydrogen economy in China, Int. J. Hydrogen Energy , 2020, 45 (59), 34326–34345 CrossRef CAS .
- M. S. Ahmad, M. S. Ali and N. Abd Rahim, Hydrogen energy vision 2060: Hydrogen as energy Carrier in Malaysian primary energy mix–Developing P2G case, Energy Strategy Rev. , 2021, 35 , 100632 CrossRef .
- P. Colbertaldo, et al. , Impact of hydrogen energy storage on California electric power system: Towards 100% renewable electricity, Int. J. Hydrogen Energy , 2019, 44 (19), 9558–9576 CrossRef CAS .
- H. Zhang, et al. , Material challenges in green hydrogen ecosystem, Coord. Chem. Rev. , 2023, 494 , 215272 CrossRef CAS .
- M.-N. N. Shafiqah, et al. , Advanced catalysts and effect of operating parameters in ethanol dry reforming for hydrogen generation. A review, Environ. Chem. Lett. , 2022, 20 (3), 1695–1718 CrossRef CAS .
- C. Park, et al. , Economic valuation of green hydrogen charging compared to gray hydrogen charging: The case of South Korea, Int. J. Hydrogen Energy , 2022, 47 (32), 14393–14403 CrossRef CAS .
- M. Hirscher, et al. , Materials for hydrogen-based energy storage – past, recent progress and future outlook, J. Alloys Compd. , 2020, 827 , 153548 CrossRef CAS .
- F. Qureshi, et al. , Current trends in hydrogen production, storage and applications in India: A review, Sustain. Energy Technol. Assessments , 2022, 53 , 102677 CrossRef .
- T. Liu, K. Yang and Z. Jin, Promotion of the excited electron transfer over MoO 3 @Cu 3 P p–n heterojunction for photocatalytic hydrogen production under visible light irradiation, Mol. Catal. , 2021, 510 , 111691 CrossRef CAS .
- T. Van de Graaf, et al. , The new oil? The geopolitics and international governance of hydrogen, Energy Res. Social Sci. , 2020, 70 , 101667 CrossRef PubMed .
- M. Noussan, et al. , The role of green and blue hydrogen in the energy transition—A technological and geopolitical perspective, Sustainability , 2021, 13 (1), 298 CrossRef CAS .
- J. Lin, et al. , Phyto-mediated synthesis of nanoparticles and their applications on hydrogen generation on NaBH4, biological activities and photodegradation on azo dyes: Development of machine learning model, Food Chem. Toxicol. , 2022, 163 , 112972 CrossRef CAS PubMed .
- A. N. Antzaras and A. A. Lemonidou, Recent advances on materials and processes for intensified production of blue hydrogen, Renew. Sustain. Energy Rev. , 2022, 155 , 111917 CrossRef CAS .
- C. Bauer, et al. , On the climate impacts of blue hydrogen production, Sustain. Energy Fuels , 2022, 6 (1), 66–75 RSC .
- W. Su, et al. , Hydrogen production and heavy metal immobilization using hyperaccumulators in supercritical water gasification, J. Hazard. Mater. , 2021, 402 , 123541 CrossRef CAS PubMed .
- W. Su, et al. , Supercritical water gasification of hyperaccumulators for hydrogen production and heavy metal immobilization with alkali metal catalysts, Environ. Res. , 2022, 214 , 114093 CrossRef CAS .
- S. Atilhan, et al. , Green hydrogen as an alternative fuel for the shipping industry, Curr. Opin. Chem. Eng. , 2021, 31 , 100668 CrossRef .
- R. d'Amore-Domenech, Ó. Santiago and T. J. Leo, Multicriteria analysis of seawater electrolysis technologies for green hydrogen production at sea, Renew. Sustain. Energy Rev. , 2020, 133 , 110166 CrossRef .
- E. R. Sadik-Zada, Political Economy of Green Hydrogen Rollout: A Global Perspective, Sustainability , 2021, 13 (23), 13464 CrossRef CAS .
- Z. Xu, et al. , High temperature hydrothermal etching of g-C3N4 for synthesis of N doped carbon quantum dots-supported CdS photocatalyst to enhance visible light driven hydrogen generation, Mol. Catal. , 2022, 517 , 111900 CrossRef CAS .
- H. Zhao, et al. , Raw biomass electroreforming coupled to green hydrogen generation, Nat. Commun. , 2021, 12 (1), 2008 CrossRef CAS PubMed .
- R. Rahimpour and A. Basile, Special Issue “Novel Catalysts Development for Hydrogen Production , Elsevier, 2023, p. 6157 Search PubMed .
- A. Inayat, et al. , A comprehensive review on advanced thermochemical processes for bio-hydrogen production via microwave and plasma technologies, Biomass Convers. Biorefin. , 2020, 1–10 Search PubMed .
- S. Balusamy, Development of Biofuel from Nigella Sativa Biomass and its Suitability for Energy Application , 2020 Search PubMed .
- D. Mohan, C. U. Pittman Jr and P. H. Steele, Pyrolysis of wood/biomass for bio-oil: a critical review, Energy Fuel. , 2006, 20 (3), 848–889 CrossRef CAS .
- M. Danthurebandara, et al. , Environmental and economic performance of plasma gasification in Enhanced Landfill Mining, Waste Manage. , 2015, 45 , 458–467 CrossRef CAS PubMed .
- V. Zhovtyansky and V. Valinčius, Efficiency of plasma gasification technologies for hazardous waste treatment, Gasification for Low-Grade Feedstock , 2018, p. 165–189 Search PubMed .
- M. Hlina, et al. , Plasma gasification of wood and production of gas with low content of tar, Czech J. Phys. , 2006, 56 , B1179–B1184 CrossRef .
- M. Jasiński, et al. , Hydrogen production via methane reforming using various microwave plasma sources, Chem. Listy , 2008, 102 (16), S1332–S1337 Search PubMed .
- C. M. Kalamaras and A. M. Efstathiou. Hydrogen production technologies: current state and future developments, in Conference papers in science , Hindawi, 2013 Search PubMed .
- C. Du, J. Mo and H. Li, Renewable hydrogen production by alcohols reforming using plasma and plasma-catalytic technologies: challenges and opportunities, Chem. Rev. , 2015, 115 (3), 1503–1542 CrossRef CAS PubMed .
- S. A. Bhat and J. Sadhukhan, Process intensification aspects for steam methane reforming: An overview, AIChE J. , 2009, 55 (2), 408–422 CrossRef CAS .
- M. Balat and E. Kirtay, Major technical barriers to a “hydrogen economy”, Energy Sources, Part A , 2010, 32 (9), 863–876 CrossRef CAS .
- G. W. Crabtree, M. S. Dresselhaus and M. V. Buchanan, The hydrogen economy, Phys. Today , 2004, 57 (12), 39–44 CrossRef CAS .
- G. W. Crabtree and M. S. Dresselhaus, The hydrogen fuel alternative, MRS Bull. , 2008, 33 (4), 421–428 CrossRef CAS .
- P.-C. Kuo, et al. , Plasma gasification performances of various raw and torrefied biomass materials using different gasifying agents, Bioresour. Technol. , 2020, 314 , 123740 CrossRef CAS PubMed .
- A. A. Haleem, et al. , A new accelerated durability test protocol for water oxidation electrocatalysts of renewable energy powered alkaline water electrolyzers, Electrochemistry , 2021, 89 (2), 186–191 CrossRef .
- G. Petitpas, et al. , A comparative study of non-thermal plasma assisted reforming technologies, Int. J. Hydrogen Energy , 2007, 32 (14), 2848–2867 CrossRef CAS .
- J. Makavana, et al. , Development and performance evaluation of batch type biomass pyrolyser for agricultural residue, Biomass Convers. Biorefin. , 2020, 1–8 Search PubMed .
- S. Pang, Advances in thermochemical conversion of woody biomass to energy, fuels and chemicals, Biotechnol. Adv. , 2019, 37 (4), 589–597 CrossRef CAS PubMed .
- M. Saidi, M. H. Gohari and A. T. Ramezani, Hydrogen production from waste gasification followed by membrane filtration: a review, Environ. Chem. Lett. , 2020, 18 , 1529–1556 CrossRef CAS .
- T. Wu, et al. , Plasma bubble characteristics and hydrogen production performance of methanol decomposition by liquid phase discharge, Energy , 2023, 273 , 127252 CrossRef CAS .
- B. Tabu, et al. , Nonthermal atmospheric plasma reactors for hydrogen production from low-density polyethylene, Int. J. Hydrogen Energy , 2022, 47 (94), 39743–39757 CrossRef CAS .
- Y. Zhang, et al. , Simultaneously efficient solar light harvesting and charge transfer of hollow octahedral Cu2S/CdS p–n heterostructures for remarkable photocatalytic hydrogen generation, Trans. Tianjin Univ. , 2021, 27 (4), 348–357 CrossRef CAS .
- Y. Tian, et al. , Thiophene-Conjugated Porous C3N4 Nanosheets for Boosted Photocatalytic Nicotinamide Cofactor Regeneration to Facilitate Solar-to-Chemical Enzymatic Reactions, Trans. Tianjin Univ. , 2021, 27 (1), 42–54 CrossRef CAS .
- R. G. Lemus and J. M. M. Duart, Updated hydrogen production costs and parities for conventional and renewable technologies, Int. J. Hydrogen Energy , 2010, 35 (9), 3929–3936 CrossRef CAS .
- A. Ursúa, et al. , Integration of commercial alkaline water electrolysers with renewable energies: Limitations and improvements, Int. J. Hydrogen Energy , 2016, 41 (30), 12852–12861 CrossRef .
- L. M. Gandía, et al. , Renewable hydrogen production: performance of an alkaline water electrolyzer working under emulated wind conditions, Energy Fuel. , 2007, 21 (3), 1699–1706 CrossRef .
- A. Ursúa, et al. , Stand-alone operation of an alkaline water electrolyser fed by wind and photovoltaic systems, Int. J. Hydrogen Energy , 2013, 38 (35), 14952–14967 CrossRef .
- J. M. Stansberry and J. Brouwer, Experimental dynamic dispatch of a 60 kW proton exchange membrane electrolyzer in power-to-gas application, Int. J. Hydrogen Energy , 2020, 45 (16), 9305–9316 CrossRef CAS .
- H. Zhang, H. Wang and J. Xuan, Rational design of photoelectrochemical cells towards bias-free water splitting: Thermodynamic and kinetic insights, J. Power Sources , 2020, 462 , 228113 CrossRef CAS .
- D. Zheng, et al. , Nanocatalysts in photocatalytic water splitting for green hydrogen generation: Challenges and opportunities, J. Cleaner Prod. , 2023, 414 , 137700 CrossRef CAS .
- X. Yan, et al. , An electron-hole rich dual-site nickel catalyst for efficient photocatalytic overall water splitting, Nat. Commun. , 2023, 14 (1), 1741 CrossRef CAS PubMed .
- J. Ruan, T. Zhong and Y. Guo, Enhanced water splitting over ethylenediaminetetraacetate treated SrTiO3 photocatalysts with high crystallinity, reduced size, and surface nanostructure, J. Colloid Interface Sci. , 2023, 650 , 1424–1433 CrossRef CAS PubMed .
- M. Saleh, et al. , Enhancing photocatalytic water splitting: Comparative study of TiO2 decorated nanocrystals (Pt and Cu) using different synthesis methods, Fuel , 2023, 354 , 129248 CrossRef CAS .
- Q. Lai, et al. , Hydrogen storage materials for mobile and stationary applications: current state of the art, ChemSusChem , 2015, 8 (17), 2789–2825 CrossRef CAS PubMed .
- Y. Zhang, et al. , Solidified Hydrogen Storage (Solid-HyStore) via Clathrate Hydrates, Chem. Eng. J. , 2022, 431 , 133702 CrossRef CAS .
- Z. Zhang, et al. , Heterostructured VF4@Ti3C2 catalyst improving reversible hydrogen storage properties of Mg(BH4)2, Chem. Eng. J. , 2023, 460 , 141690 CrossRef CAS .
- J. Liu, et al. , High performance stainless-steel supported Pd membranes with a finger-like and gap structure and its application in NH3 decomposition membrane reactor, Chem. Eng. J. , 2020, 388 , 124245 CrossRef CAS .
- V. Nicolas, et al. , Numerical simulation of a thermally driven hydrogen compressor as a performance optimization tool, Appl. Energy , 2022, 323 , 119628 CrossRef CAS .
- H. Nazir, et al. , Is the H2 economy realizable in the foreseeable future? Part II: H2 storage, transportation, and distribution, Int. J. Hydrogen Energy , 2020, 45 (41), 20693–20708 CrossRef CAS .
- A. Goeppert, et al. , Recycling of carbon dioxide to methanol and derived products-closing the loop, Chem. Soc. Rev. , 2014, 43 (23), 7995–8048 RSC .
- Y. Shen, et al. , Hydrogen generation from methanol at near-room temperature, Chem. Sci. , 2017, 8 (11), 7498–7504 RSC .
- M. Bui, et al. , Carbon capture and storage (CCS): the way forward, Energy Environ. Sci. , 2018, 11 (5), 1062–1176 RSC .
- S. Enthaler, J. von Langermann and T. Schmidt, Carbon dioxide and formic acid—the couple for environmental-friendly hydrogen storage?, Energy Environ. Sci. , 2010, 3 (9), 1207–1217 RSC .
- D. A. Bulushev and J. R. Ross, Towards sustainable production of formic acid, ChemSusChem , 2018, 11 (5), 821–836 CrossRef CAS PubMed .
- K. C. Ott, Final Report for the DOE Chemical Hydrogen Storage Center of Excellence , Los Alamos National Laboratory, 2012 Search PubMed .
- X. Yang, et al. , Stable electrolysis of ammonia on platinum enhanced by methanol in non-aqueous electrolyte for an in-situ hydrogen production, Chem. Eng. J. , 2022, 442 , 136167 CrossRef CAS .
- M. Aziz, A. T. Wijayanta and A. B. D. Nandiyanto, Ammonia as Effective Hydrogen Storage: A Review on Production, Storage and Utilization, Energies , 2020, 13 (12), 3062 CrossRef CAS .
- K. E. Lamb, M. D. Dolan and D. F. Kennedy, Ammonia for hydrogen storage; A review of catalytic ammonia decomposition and hydrogen separation and purification, Int. J. Hydrogen Energy , 2019, 44 (7), 3580–3593 CrossRef CAS .
- F. Schüth, et al. , Ammonia as a possible element in an energy infrastructure: Catalysts for ammonia decomposition, Energy Environ. Sci. , 2012, 5 (4), 6278–6289 RSC .
- A. Klerke, et al. , Ammonia for hydrogen storage: challenges and opportunities, J. Mater. Chem. , 2008, 18 (20), 2304–2310 RSC .
- D. Lim, et al. , Life cycle techno-economic and carbon footprint analysis of H2 production via NH3 decomposition: A Case study for the Republic of Korea, Energy Convers. Manage. , 2021, 250 , 114881 CrossRef CAS .
- F. Jiao and B. Xu, Electrochemical Ammonia Synthesis and Ammonia Fuel Cells, Adv. Mater. , 2019, 31 (31), 1805173 CrossRef .
- S. Ramalingam, M. DhakshinaMoorthy and S. Subramanian, Effect of natural antioxidant additive on hydrogen-enriched biodiesel operated compression ignition engine, Int. J. Hydrogen Energy , 2022, 47 (48), 20771–20783 CrossRef CAS .
- B. P. Tarasov, et al. , Metal hydride–Graphene composites for hydrogen based energy storage, J. Alloys Compd. , 2022, 896 , 162881 CrossRef CAS .
- A. W. van den Berg and C. O. Areán, Materials for hydrogen storage: current research trends and perspectives, Chem. Commun. , 2008,(6), 668–681 RSC .
- G. Sandrock, A panoramic overview of hydrogen storage alloys from a gas reaction point of view, J. Alloys Compd. , 1999, 293–295 , 877–888 CrossRef CAS .
- Y. Liu, et al. , Nanostructured light metal hydride: Fabrication strategies and hydrogen storage performance, Renew. Sustain. Energy Rev. , 2023, 184 , 113560 CrossRef CAS .
- S. Weitemeyer, et al. , Integration of Renewable Energy Sources in future power systems: The role of storage, Renewable Energy , 2015, 75 , 14–20 CrossRef .
- M. V. Lototskyy, et al. , Metal hydride hydrogen compressors: A review, Int. J. Hydrogen Energy , 2014, 39 (11), 5818–5851 CrossRef CAS .
- A. V. Rusanov, V. V. Solovey and M. V. Lototskyy, Thermodynamic features of metal hydride thermal sorption compressors and perspectives of their application in hydrogen liquefaction systems, J. Phys. Energy , 2020, 2 , 021007 CrossRef CAS .
- M. Song, et al. , Recent advances of magnesium hydride as an energy storage material, J. Mater. Sci. Technol. , 2023, 149 , 99–111 CrossRef CAS .
- P. Thongtan, et al. , MgH2-based hydrogen storage tank: Kinetics, reversibility, and MWCNTs content, J. Phys. Chem. Solids , 2022, 163 , 110578 CrossRef CAS .
- H. Gao, et al. , Solid-solution MAX phase TiVAlC assisted with impurity for enhancing hydrogen storage performance of magnesium hydride, J. Colloid Interface Sci. , 2023, 652 , 979–988 CrossRef CAS PubMed .
- S. Li, et al. , Enhanced hydrogen storage performance of magnesium hydride catalyzed by medium-entropy alloy CrCoNi nanosheets, Int. J. Hydrogen Energy , 2023 Search PubMed .
- L. Zhang, et al. , Carbon-wrapped Ti-Co bimetallic oxide nanocages: Novel and efficient catalysts for hydrogen storage in magnesium hydride, J. Alloys Compd. , 2023, 952 , 170002 CrossRef CAS .
- R. Jiang, et al. , Remarkable hydrogen absorption/desorption behaviors and mechanism of sodium alanates in-situ doped with Ti-based 2D MXene, Mater. Chem. Phys. , 2020, 242 , 122529 CrossRef CAS .
- N. A. Ali and M. Ismail, Modification of NaAlH4 properties using catalysts for solid-state hydrogen storage: A review, Int. J. Hydrogen Energy , 2021, 46 (1), 766–782 CrossRef CAS .
- N. A. Ali, et al. , Enhanced hydrogen storage properties of NaAlH4 with the addition of CoTiO3 synthesised via a solid-state method, J. Alloys Compd. , 2023, 934 , 167932 CrossRef CAS .
- A.-b. H. Mekky, Electronic structure and stability of a pure sodium alanate clusters Na12Al12H48, and the interstitial space-doped with Ti, C and H atoms, as a promising hydrogen storage system: Density functional theory, Int. J. Hydrogen Energy , 2023, 48 (53), 20430–20440 CrossRef CAS .
- R. U. Urunkar and S. D. Patil, Performance analysis of sodium alanate hydride reactor with different nanofluids, Int. J. Hydrogen Energy , 2023 Search PubMed .
- E. Taibi, et al. , Hydrogen from Renewable Power: Technology Outlook for the Energy Transition , 2018 Search PubMed .
- R. Shinnar, The hydrogen economy, fuel cells, and electric cars, Technol. Soc. , 2003, 25 (4), 455–476 CrossRef .
- M. Kong, et al. , Investigation of Mixing Behavior of Hydrogen Blended to Natural Gas in Gas Network, Sustainability , 2021, 13 (8), 4255 CrossRef CAS .
- R. D. F.-G. Gaz, et al. , Technical and Economic Conditions for Injecting Hydrogen into Natural Gas Networks-Final Report June 2019 , 2019 Search PubMed .
- A. G. Australia, Clean energy Innovation Hub lessons. Arena Insights Forum 2019: 2e8 , 2019 Search PubMed .
- T. Isaac, HyDeploy: The UK's first hydrogen blending deployment project, Clean Energy , 2019, 3 (2), 114–125 CrossRef .
- B. Neal, et al. , Rationale, design and baseline characteristics of the CANagliflozin cardioVascular Assessment Study–Renal (CANVAS-R): A randomized, placebo-controlled trial, Diabetes Obes. Metabol. , 2017, 19 (3), 387–393 CrossRef CAS .
- Y. Zhao, V. McDonell and S. Samuelsen, Influence of hydrogen addition to pipeline natural gas on the combustion performance of a cooktop burner, Int. J. Hydrogen Energy , 2019, 44 (23), 12239–12253 CrossRef CAS .
- D. Krieg, Konzept und Kosten eines Pipelinesystems zur Versorgung des deutschen Straßenverkehrs mit Wasserstoff , 2012, Forschungszentrum Jülich, vol. 144 Search PubMed .
- M. Ozturk, et al. , An experimental study on the environmental impact of hydrogen and natural gas blend burning, Chemosphere , 2023, 329 , 138671 CrossRef CAS PubMed .
- M. Ozturk and I. Dincer, System development and assessment for green hydrogen generation and blending with natural gas, Energy , 2022, 261 , 125233 CrossRef CAS .
- D. Kushnir, et al. , Adopting hydrogen direct reduction for the Swedish steel industry: A technological innovation system (TIS) study, J. Cleaner Prod. , 2020, 242 , 118185 CrossRef CAS .
- A. Hasanbeigi, M. Arens and L. Price, Alternative emerging ironmaking technologies for energy-efficiency and carbon dioxide emissions reduction: A technical review, Renew. Sustain. Energy Rev. , 2014, 33 , 645–658 CrossRef CAS .
- X. Tan, et al. , Energy-saving and emission-reduction technology selection and CO2 emission reduction potential of China's iron and steel industry under energy substitution policy, J. Cleaner Prod. , 2019, 222 , 823–834 CrossRef CAS .
- Z.-j. Liu, J.-l. Zhang and T.-j. Yang, Low Carbon Operation of Super-Large Blast Furnaces in China, ISIJ Int. , 2015, 55 (6), 1146–1156 CrossRef CAS .
- D. Spreitzer and J. Schenk, Reduction of iron oxides with hydrogen—a review, Steel Res. Int. , 2019, 90 (10), 1900108 CrossRef .
- S. Zheng, Basic research on hydrogen metallurgy and new ironmaking idea-process, China Metall. , 2012, 22 , 1–6 CrossRef CAS .
- G. Wang, et al. , Effect of blast furnace gas recycling with hydrogen injection on low carbon development of Chinese ironmaking, Metall. , 2019, 29 (10), 1 Search PubMed .
- K. Cao, et al. , H2-rich reduction kinetics of iron ore sinter, Chin. J. Process Eng. , 2015, 15 (6), 1024–1028 CAS .
- M.-H. Bai, et al. , Reduction behavior and kinetics of iron ore pellets under H2–N2 atmosphere, ISIJ Int. , 2018, 58 (6), 1034–1041 CrossRef CAS .
- Y. Man and J. Feng, Effect of gas composition on reduction behavior in red mud and iron ore pellets, Powder Technol. , 2016, 301 , 674–678 CrossRef CAS .
- Q. Lyu, et al. , Effect of hydrogen addition on reduction behavior of iron oxides in gas-injection blast furnace, Thermochim. Acta , 2017, 648 , 79–90 CrossRef .
- S. K. Kuila, R. Chatterjee and D. Ghosh, Kinetics of hydrogen reduction of magnetite ore fines, Int. J. Hydrogen Energy , 2016, 41 (22), 9256–9266 CrossRef CAS .
- D. Spreitzer and J. Schenk, Iron ore reduction by hydrogen using a laboratory scale fluidized bed reactor: Kinetic investigation—Experimental setup and method for determination, Metall. Mater. Trans. B , 2019, 50 , 2471–2484 CrossRef CAS .
- J. Chen, S. Yang and Y. Qian, A novel path for carbon-rich resource utilization with lower emission and higher efficiency: An integrated process of coal gasification and coking to methanol production, Energy , 2019, 177 , 304–318 CrossRef CAS .
- D. Xiang, et al. , Techno-economic analysis of the coal-to-olefins process in comparison with the oil-to-olefins process, Appl. Energy , 2014, 113 , 639–647 CrossRef CAS .
- Q. Chen, et al. , Feasibility analysis of nuclear–coal hybrid energy systems from the perspective of low-carbon development, Appl. Energy , 2015, 158 , 619–630 CrossRef CAS .
- D. Xiang, et al. , Highly efficient carbon utilization of coal-to-methanol process integrated with chemical looping hydrogen and air separation technology: Process modeling and parameter optimization, J. Cleaner Prod. , 2020, 258 , 120910 CrossRef CAS .
- Y. Jin, Y. Zhou and S. Hu, Discussion on development of coal chemical industry using low-carbon concept, Huagong Xuebao/CIESC J. , 2012, 63 (1), 3–8 CAS .
- X. Tang, B. Zhang, X. Wei and M. Höök, Employment impacts of petroleum industry in China: an input-output analysis, Int. J. Global Energy Issues , 2013, 36 (2–4), 116–129 CrossRef .
- G. Leonzio, Methanol Synthesis: Optimal Solution for a Better Efficiency of the Process, Processes , 2018, 6 (3), 20 CrossRef .
- G. A. Olah, A. Goeppert and G. K. S. Prakash, Chemical Recycling of Carbon Dioxide to Methanol and Dimethyl Ether: From Greenhouse Gas to Renewable, Environmentally Carbon Neutral Fuels and Synthetic Hydrocarbons, J. Org. Chem. , 2009, 74 (2), 487–498 CrossRef CAS .
- M. Kauw, R. M. J. Benders and C. Visser, Green methanol from hydrogen and carbon dioxide using geothermal energy and/or hydropower in Iceland or excess renewable electricity in Germany, Energy , 2015, 90 , 208–217 CrossRef CAS .
- W. Dongliang, et al. , Green hydrogen coupling with CO2 utilization of coal-to-methanol for high methanol productivity and low CO2 emission, Energy , 2021, 231 , 120970 CrossRef .
- S. Sollai, et al. , Renewable methanol production from green hydrogen and captured CO2: A techno-economic assessment, J. CO2 Util. , 2023, 68 , 102345 CrossRef CAS .
- M. Hocking, Ammonia, nitric acid and their derivatives, in Modern Chemical Technology and Emission Control , Springer, 1985, p. 205–233 Search PubMed .
- D. R. MacFarlane, et al. , A roadmap to the ammonia economy, Joule , 2020, 4 (6), 1186–1205 CrossRef CAS .
- P. Dange, et al. , Recent developments in microbial electrolysis cell-based biohydrogen production utilizing wastewater as a feedstock, Sustainability , 2021, 13 (16), 8796 CrossRef CAS .
- S. Kubicek and O. Spadiut, semi-artificial photosynthesis for green hydrogen production–overview, challenges and possibilities, Symposium Energieinnovation, 16.-18.02.2022 , Graz, Austria, 2022 Search PubMed .
- S. Dahiya, et al. , Renewable hydrogen production by dark-fermentation: Current status, challenges and perspectives, Bioresour. Technol. , 2021, 321 , 124354 CrossRef CAS .
- S. Anwar, et al. , Recent development in electrocatalysts for hydrogen production through water electrolysis, Int. J. Hydrogen Energy , 2021, 46 (63), 32284–32317 CrossRef CAS .
- G. Chehade and I. Dincer, Progress in green ammonia production as potential carbon-free fuel, Fuel , 2021, 299 , 120845 CrossRef CAS .
- H. Zhao, L. M. Kamp and Z. Lukszo, The potential of green ammonia production to reduce renewable power curtailment and encourage the energy transition in China, Int. J. Hydrogen Energy , 2022, 47 (44), 18935–18954 CrossRef CAS .
- H. Ishaq, M. F. Shehzad and C. Crawford, Transient modeling of a green ammonia production system to support sustainable development, Int. J. Hydrogen Energy , 2023 Search PubMed .
- H. Bouaboula, et al. , Addressing sustainable energy intermittence for green ammonia production, Energy Rep. , 2023, 9 , 4507–4517 CrossRef .
- A. Nemmour, et al. , Green hydrogen-based E-fuels (E-methane, E-methanol, E-ammonia) to support clean energy transition: A literature review, Int. J. Hydrogen Energy , 2023, 48 (75), 29011–29033 CrossRef CAS .
- L. Guerra, et al. , Methane production by a combined Sabatier reaction/water electrolysis process, J. Environ. Chem. Eng. , 2018, 6 (1), 671–676 CrossRef CAS .
- V. Pignataro, et al. , Impact of management strategy on green methane production from wind energy, E3S Web Conf. , 2023, 414 , 01005 CrossRef CAS .
- S. García-Luna and C. Ortiz, Conceptual assessment of sustainable methane production from oxycombustion CO2 capture in waste-to-energy power plants, Energy Convers. Manage. , 2023, 292 , 117348 CrossRef .
- J. Chao and B. J. Zwolinski, Ideal gas thermodynamic properties of methanoic and ethanoic acids, J. Phys. Chem. Ref. Data , 1978, 7 (1), 363–377 CrossRef CAS .
- M. E. M. Berger, et al. , Simple and recyclable ionic liquid based system for the selective decomposition of formic acid to hydrogen and carbon dioxide, Green Chem. , 2011, 13 (6), 1411–1415 RSC .
- J. Hietala, et al. , Formic acid, Ullmann’s encyclopedia of industrial chemistry , 2016, 1, p. 1–22 Search PubMed .
- L. Gong, et al. , Power management and system optimization for high efficiency self-powered electrolytic hydrogen and formic acid production, Nano Energy , 2023, 107 , 108124 CrossRef CAS .
- J. M. Thomas, et al. , Decarbonising energy: The developing international activity in hydrogen technologies and fuel cells, J. Energy Chem. , 2020, 51 , 405–415 CrossRef PubMed .
- L. Fan, Z. Tu and S. H. Chan, Recent development of hydrogen and fuel cell technologies: A review, Energy Rep. , 2021, 7 , 8421–8446 CrossRef .
- B. Paul and J. Andrews, PEM unitised reversible/regenerative hydrogen fuel cell systems: State of the art and technical challenges, Renew. Sustain. Energy Rev. , 2017, 79 , 585–599 CrossRef .
- M. C. Argyrou, P. Christodoulides and S. A. Kalogirou, Energy storage for electricity generation and related processes: Technologies appraisal and grid scale applications, Renew. Sustain. Energy Rev. , 2018, 94 , 804–821 CrossRef .
- U. K. Zore, et al. , A review on recent advances in hydrogen energy, fuel cell, biofuel and fuel refining via ultrasound process intensification, Ultrason. Sonochem. , 2021, 73 , 105536 CrossRef CAS PubMed .
- M. F. Orhan and B. S. Babu, Investigation of an integrated hydrogen production system based on nuclear and renewable energy sources: Comparative evaluation of hydrogen production options with a regenerative fuel cell system, Energy , 2015, 88 , 801–820 CrossRef CAS .
- Y. Yu, et al. , Comparison of degradation behaviors for open-ended and closed proton exchange membrane fuel cells during startup and shutdown cycles, J. Power Sources , 2011, 196 (11), 5077–5083 CrossRef CAS .
- J. O. M. Bockris, A Hydrogen Economy, Science , 1972, 176 (4041), 1323 CrossRef CAS PubMed .
- M. D. Conrad and J. E. Ness, Commonwealth of the Northern Mariana Islands Strategic Energy Plan , National Renewable Energy Lab.(NREL), Golden, CO (United States), 2013 Search PubMed .
- B. Pivovar, N. Rustagi and S. Satyapal, Hydrogen at Scale (H2@Scale): Key to a Clean, Economic, and Sustainable Energy System, Electrochem. Soc. Interfac. , 2018, 27 (1), 47 CrossRef CAS .
- I. Irena, Green Hydrogen Cost Reduction: Scaling up Electrolysers to Meet the 1.5 C Climate Goal . Abu Dhabi: International Renewable Energy Agency, 2020 Search PubMed .
- I. E. Agency, The Future of Hydrogen . 2019 Search PubMed .
- H. Council, Hydrogen Scaling up: a Sustainable Pathway for the Global Energy Transition . 2017 Search PubMed .
Information
- Author Services
Initiatives
You are accessing a machine-readable page. In order to be human-readable, please install an RSS reader.
All articles published by MDPI are made immediately available worldwide under an open access license. No special permission is required to reuse all or part of the article published by MDPI, including figures and tables. For articles published under an open access Creative Common CC BY license, any part of the article may be reused without permission provided that the original article is clearly cited. For more information, please refer to https://www.mdpi.com/openaccess .
Feature papers represent the most advanced research with significant potential for high impact in the field. A Feature Paper should be a substantial original Article that involves several techniques or approaches, provides an outlook for future research directions and describes possible research applications.
Feature papers are submitted upon individual invitation or recommendation by the scientific editors and must receive positive feedback from the reviewers.
Editor’s Choice articles are based on recommendations by the scientific editors of MDPI journals from around the world. Editors select a small number of articles recently published in the journal that they believe will be particularly interesting to readers, or important in the respective research area. The aim is to provide a snapshot of some of the most exciting work published in the various research areas of the journal.
Original Submission Date Received: .
- Active Journals
- Find a Journal
- Proceedings Series
- For Authors
- For Reviewers
- For Editors
- For Librarians
- For Publishers
- For Societies
- For Conference Organizers
- Open Access Policy
- Institutional Open Access Program
- Special Issues Guidelines
- Editorial Process
- Research and Publication Ethics
- Article Processing Charges
- Testimonials
- Preprints.org
- SciProfiles
- Encyclopedia
Article Menu

- Subscribe SciFeed
- Recommended Articles
- Google Scholar
- on Google Scholar
- Table of Contents
Find support for a specific problem in the support section of our website.
Please let us know what you think of our products and services.
Visit our dedicated information section to learn more about MDPI.
JSmol Viewer
Identification and deformation characteristics of active landslides at large hydropower stations at the early impoundment stage: a case study of the lianghekou reservoir area in sichuan province, southwest china.

1. Introduction
2. study area, 3. data and methodology, 3.2. methods, 3.2.1. identification of active landslides, 3.2.2. temporal analysis of deformation in active landslides, 3.2.3. pearson correlation analysis, 4.1. active landslide identification results, 4.2. deformation characteristics of typical active landslides, 4.2.1. boluzi landslide, 4.2.2. waduo landslide, 4.3. landslide deformation correlation with reservoir water level and rainfall, 5. discussion, 5.1. effect of the sar geometry, 5.2. response of landslide deformation to reservoir water level, 5.3. response of landslide deformation to rainfall, 5.4. limitations and prospect, 6. conclusions, author contributions, data availability statement, acknowledgments, conflicts of interest.
- Tang, H.; Wasowski, J.; Juang, C.H. Geohazards in the three Gorges Reservoir Area, China Lessons learned from decades of research. Eng. Geol. 2019 , 261 , 105267. [ Google Scholar ] [ CrossRef ]
- Hu, X.; Wu, S.; Zhang, G.; Zheng, W.; Liu, C.; He, C.; Liu, Z.; Guo, X.; Zhang, H. Landslide displacement prediction using kinematics-based random forests method: A case study in Jinping Reservoir Area, China. Eng. Geol. 2021 , 283 , 105975. [ Google Scholar ] [ CrossRef ]
- Zhao, S.; Zeng, R.; Zhang, H.; Meng, X.; Zhang, Z.; Meng, X.; Wang, H.; Zhang, Y.; Liu, J. Impact of Water Level Fluctuations on Landslide Deformation at Longyangxia Reservoir, Qinghai Province, China. Remote Sens. 2022 , 14 , 212. [ Google Scholar ] [ CrossRef ]
- Zhang, C.; Yin, Y.; Yan, H.; Li, H.; Dai, Z.; Zhang, N. Reactivation characteristics and hydrological inducing factors of a massive ancient landslide in the three Gorges Reservoir, China. Eng. Geol. 2021 , 292 , 106273. [ Google Scholar ] [ CrossRef ]
- Tang, M.; Xu, Q.; Yang, H.; Li, S.; Iqbal, J.; Fu, X.; Huang, X.; Cheng, W. Activity law and hydraulics mechanism of landslides with different sliding surface and permeability in the Three Gorges Reservoir Area, China. Eng. Geol. 2019 , 260 , 105212. [ Google Scholar ] [ CrossRef ]
- Jones, F.O. Landslide Conditions along the Ferry County Highway Parallelling Lake Roosevelt from Kettle Falls to the Mouth of the Spokane River, Washington ; US Geological Survey: Reston, VA, USA, 1954. [ Google Scholar ]
- Nakamura, K. On reservoir landslide. Bull. Soil Water Conserv. 1990 , 10 , 53–64. [ Google Scholar ] [ CrossRef ]
- Yin, Y.; Huang, B.; Wang, W.; Wei, Y.; Ma, X.; Ma, F.; Zhao, C. Reservoir-induced landslides and risk control in Three Gorges Project on Yangtze River, China. J. Rock Mech. Geotech. Eng. 2016 , 8 , 577–595. [ Google Scholar ] [ CrossRef ]
- Zhou, J.; Chen, M.; Qu, J.; Hu, Y.; Xia, M.; Jiang, N.; Li, H.; Fan, G. Research and Prospect on Disaster-causing Mechanism and Prevention-control Technology of Reservoir Landslides. Adv. Eng. Sci. Adv. Eng. Sci. 2023 , 55 , 110–128. [ Google Scholar ] [ CrossRef ]
- Li, S.; Xu, Q.; Tang, M.; Iqbal, J.; Liu, J.; Zhu, X.; Liu, F.; Zhu, D. Characterizing the spatial distribution and fundamental controls of landslides in the three gorges reservoir area, China. Bull. Eng. Geol. Environ. 2019 , 78 , 4275–4290. [ Google Scholar ] [ CrossRef ]
- Tang, F.; Qi, S.; Guo, S.; Zou, Y.; Li, Y.; Lu, X.; Zheng, B.; Song, S.; Hou, X. Spatio-temporal distribution pattern and susceptibility of reservoir-induced landslides in Xiluodu Hydropower Station. J. Eng. Geol. 2022 , 30 , 609–620. [ Google Scholar ] [ CrossRef ]
- Li, L.; Wen, B.; Yao, X.; Zhou, Z.; Zhu, Y. InSAR-based method for monitoring the long-time evolutions and spatial-temporal distributions of unstable slopes with the impact of water-level fluctuation: A case study in the Xiluodu reservoir. Remote Sens. Environ. 2023 , 295 , 113686. [ Google Scholar ] [ CrossRef ]
- Dai, K.; Shen, Y.; Wu, M.; Feng, W.; Dong, X.; Zhuo, G.; Yi, X. Identification of potential landslides in Baihetan Dam area before the impoundment by combining InSAR and UAV survey. Acta Geod. Cartogr. Sin. 2022 , 51 , 2069–2082. [ Google Scholar ] [ CrossRef ]
- Dai, K.; Chen, C.; Shi, X.; Wu, M.; Feng, W.; Xu, Q.; Liang, R.; Zhuo, G.; Li, Z. Dynamic landslides susceptibility evaluation in Baihetan Dam area during extensive impoundment by integrating geological model and InSAR observations. Int. J. Appl. Earth Obs. Geoinf. 2023 , 116 , 103157. [ Google Scholar ] [ CrossRef ]
- Wu, T.; Xie, X.; Wu, H.; Zeng, H.; Zhu, X. A Quantitative Analysis Method of Regional Rainfall-Induced Landslide Deformation Response Variation Based on a Time-Domain Correlation Model. Land 2022 , 11 , 703. [ Google Scholar ] [ CrossRef ]
- Shi, X.; Wang, J.; Jiang, M.; Zhang, S.; Wu, Y.; Zhong, Y. Extreme rainfall-related accelerations in landslides in Danba County, Sichuan Province, as detected by InSAR. Int. J. Appl. Earth Obs. Geoinf. 2022 , 115 , 103109. [ Google Scholar ] [ CrossRef ]
- Tufano, R.; Cesarano, M.; De Vita, P. Probabilistic approaches for assessing rainfall thresholds triggering shallow landslides. The study case of peri-Vesuvian area (Southern Italy). Ital. J. Eng. Geol. Environ. 2019 , 105–110. [ Google Scholar ] [ CrossRef ]
- Xu, Q.; Zhu, X.; Li, W.; Dong, X.; Dai, K.; Jiang, Y.; Lu, H.; Guo, C. Technical progress of space-air-ground collaborative monitoring of landslide. Acta Geod. Cartogr. Sin. 2022 , 51 , 1416–1436. [ Google Scholar ] [ CrossRef ]
- Xu, Q. Understanding and Consideration of Related Issues in Early Identification of Potential Geohazards. Geom. Inf. Sci. Wuhan Univ. 2020 , 45 , 1651–1659. [ Google Scholar ] [ CrossRef ]
- Xu, Q.; Dong, X.; Li, W. Integrated Space-Air-Ground Early Detection, Monitoring and Warning System for Potential Catastrophic Geohazards. Geom. Inf. Sci. Wuhan Univ. 2019 , 44 , 957–966. [ Google Scholar ] [ CrossRef ]
- Lu, H.; Li, W.; Xu, Q.; Dong, X.; Dai, C.; Wang, D. Early Detection of Landslides in the Upstream and Downstream Areas of the Baige Landslide, the Jinsha River Based on Optical Remote Sensing and InSAR Technologies. Geom. Inf. Sci. Wuhan Univ. 2019 , 44 , 1342–1354. [ Google Scholar ] [ CrossRef ]
- Chen, B.; Li, W.; Lu, H.; Fu, H.; Zhou, S.; Huang, W. Deformation Analysis of Jungong Ancient Landslide Based on SBAS-InSAR Technology in the Yellow River Mainstream. Geom. Inf. Sci. Wuhan Univ. 2024 , 49 , 1407–1421. [ Google Scholar ] [ CrossRef ]
- Feng, W.; Dun, J.; Yi, X.; Zhang, G. Deformation analysis of Woda village old landslide in Jinsha river basin using SBAS-InSARtechnology. J. Eng. Geol. 2020 , 28 , 384–393. [ Google Scholar ] [ CrossRef ]
- Zhang, Z.; Xu, S.; Deng, M.; Zeng, Y.; Li, C.; Yao, J. Analysis of Deformation Characteristics of Muchang Ancient Landslide Based on SBAS-InSAR Technology. Sci. Technol. Eng. 2023 , 23 , 1414–1423. [ Google Scholar ] [ CrossRef ]
- Ferretti, A.; Prati, C.; Rocca, F. Permanent scatterers in SAR interferometry. IEEE Trans. Geosci. Remote Sens. 2001 , 39 , 8–20. [ Google Scholar ] [ CrossRef ]
- Berardino, P.; Fornaro, G.; Lanari, R.; Sansosti, E. A new algorithm for surface deformation monitoring based on small baseline differential SAR interferograms. IEEE Trans. Geosci. Remote Sens. 2002 , 40 , 2375–2383. [ Google Scholar ] [ CrossRef ]
- Dai, K.; Liu, G.; Li, Z.; Ma, D.; Wang, X.; Zhang, B.; Tang, J.; Li, G. Monitoring Highway Stability in Permafrost Regions with X-band Temporary Scatterers Stacking InSAR. Sensors 2018 , 18 , 1876. [ Google Scholar ] [ CrossRef ] [ PubMed ]
- Liu, B.; Ge, D.; Wang, S.; Li, M.; Zhang, L.; Wang, Y.; Wu, Q. Combining Application of TOPS and ScanSAR InSAR in Large-Scale Geohazards Identification. Geom. Inf. Sci. Wuhan Univ. 2020 , 45 , 1756–1762. [ Google Scholar ] [ CrossRef ]
- Xu, Q.; Pu, C.; Zhao, K.; He, P.; Zhang, H.; Liu, J. Time Series InSAR Monitoring and Analysis of Spatiotemporal Evolution Characteristics of Land Subsidence in Yan’an New District. Geom. Inf. Sci. Wuhan Univ. 2021 , 46 , 957–969. [ Google Scholar ] [ CrossRef ]
- Li, W.; Xu, Q.; Lu, H.; Dong, X.; Zhu, Y. Tracking the Deformation History of Large-Scale Rocky Landslides and Its Enlightenment. Geom. Inf. Sci. Wuhan Univ. 2019 , 44 , 1043–1053. [ Google Scholar ] [ CrossRef ]
- Liu, X.; Yang, Z.; Guo, C.; Shen, W.; Su, F. Study of Slow-moving Landslide Characteristics Based on the SBAS-InSAR in the Xianshuihe Fault Zone. Geoscience 2017 , 31 , 965–977. [ Google Scholar ] [ CrossRef ]
- Yao, J.; Lan, H.; Li, L.; Cao, Y.; Wu, Y.; Zhang, Y.; Zhou, C. Characteristics of a rapid landsliding area along Jinsha River revealed by multi-temporal remote sensing and its risks to Sichuan-Tibet railway. Landslides 2022 , 19 , 703–718. [ Google Scholar ] [ CrossRef ]
- Junhui, S.; Manfu, G.; Mingliang, L.; Yuefei, H.U.; Jinlin, Z. Development regularity of landslides in Yalong River reservoir area of Lianghekou hydropower station. Hydrogeol. Eng. Geol. 2007 , 34 , 6–9. [ Google Scholar ] [ CrossRef ]
- Wang, Y.; Dong, J.; Zhang, L.; Deng, S.; Zhang, G.; Liao, M.; Gong, J. Automatic detection and update of landslide inventory before and after impoundments at the Lianghekou reservoir using Sentinel-1 InSAR. Int. J. Appl. Earth Obs. Geoinf. 2023 , 118 , 103224. [ Google Scholar ] [ CrossRef ]
- Li, W.; Zhan, W.; Lu, H.; Xu, Q.; Pei, X.; Wang, D.; Huang, R.; Ge, D. Precursors to large rockslides visible on optical remote-sensing images and their implications for landslide early detection. Landslides 2023 , 20 , 1–12. [ Google Scholar ] [ CrossRef ]
- Gao, H.; YIin, K. Discuss on the correlations between landslides and rainfall and threshold for landslide early-warning and prediction. Rock Soil Mech. 2007 , 28 , 1055–1060. [ Google Scholar ] [ CrossRef ]
- Tomás, R.; Li, Z.; Lopez-Sanchez, J.M.; Liu, P.; Singleton, A. Using wavelet tools to analyse seasonal variations from InSAR time-series data: A case study of the Huangtupo landslide. Landslides 2016 , 13 , 437–450. [ Google Scholar ] [ CrossRef ]
- Lu, H.; Li, W.; Xu, Q.; Yu, W.; Zhou, S.; Li, Z.; Zhan, W.; Li, W.; Xu, S.; Zhang, P.; et al. Active landslide detection using integrated remote sensing technologies for a wide region and multiple stages: A case study in southwestern China. Sci. Total Environ. 2024 , 931 , 172709. [ Google Scholar ] [ CrossRef ] [ PubMed ]
- Shan, Y.; Xu, Z.; Zhou, S.; Lu, H.; Yu, W.; Li, Z.; Cao, X.; Li, P.; Li, W. Landslide Hazard Assessment Combined with InSAR Deformation: A Case Study in the Zagunao River Basin, Sichuan Province, Southwestern China. Remote Sens. 2024 , 16 , 99. [ Google Scholar ] [ CrossRef ]
- Zhou, S.; Chen, B.; Lu, H.; Shan, Y.; Li, Z.; Li, P.; Cao, X.; Li, W. Analysis of the Spatial Distribution and Deformation Types of Active Landslides in the Upper Jinsha River, China, Using Integrated Remote Sensing Technologies. Remote Sens. 2024 , 16 , 100. [ Google Scholar ] [ CrossRef ]
- Liao, K.; Wu, Y.; Miao, F.; Li, L.; Xue, Y. Time-varying reliability analysis of Majiagou landslide based on weakening of hydro-fluctuation belt under wetting-drying cycles. Landslides 2021 , 18 , 267–280. [ Google Scholar ] [ CrossRef ]
- Yang, Z.; Li, X.; Zhao, Q.; Zhang, Y.; Liu, X. Key influencing factors based distribution regularity and deformation and failure response of colluvial landslides in Three Gorges Reservoir area. J. Eng. Geol. 2021 , 29 , 617–627. [ Google Scholar ] [ CrossRef ]
- Zhang, X.; Yu, W.; Pun, M.-O.; Shi, W. Cross-domain landslide mapping from large-scale remote sensing images using prototype-guided domain-aware progressive representation learning. ISPRS J. Photogramm. Remote Sens. 2023 , 197 , 1–17. [ Google Scholar ] [ CrossRef ]
- Cojean, R.; Cai, Y.J. Analysis and modeling of slope stability in the Three-Gorges Dam reservoir (China)—The case of Huangtupo landslide. J. Mountain Sci. 2011 , 8 , 166–175. [ Google Scholar ] [ CrossRef ]
- Li, C.; Long, J.; Jiang, X.; Fu, Z. Advance and prospect of formation mechanism for reservoir landslides. Bull. Geol. Sci. Technol. 2020 , 39 , 67–77. [ Google Scholar ] [ CrossRef ]
Click here to enlarge figure
| SAR Sensor | Sentinel-1A | |
|---|---|---|
| Orbital direction | Ascending/descending | |
| Image mode | IW | |
| Polarization | VV | |
| Wavelength | C-band (5.6 cm) | |
| Resolution (azimuth/range) | 5 m × 20 m | |
| Revisit period | 12 days | |
| Azimuth angle | −12.8°/192.74° | |
| Angle of incidence | 36.94°/39.60° | |
| Collection date | 24 January 2017 to 12 March 2024 | |
| 19 June 2018 to 7 March 2024 | ||
| Scenes | 401/306 | |
| Image coverage | Ascending track: | Path 26: Frame 93/Frame 98 |
| Descending track: | Path 135: Frame 488/Frame 493 | |
| River | Total Landslides | Percentage of Landslides | Distribution | Right Bank | Left Bank |
|---|---|---|---|---|---|
| Xianshui R. | 47 | 62.7% | Mainly on the right bank | 34 | 13 |
| Yalong R. | 26 | 34.7% | Evenly distributed on the two banks | 11 | 15 |
| Qingda R. | 2 | 2.6% | Mainly distributed on the left bank | 0 | 2 |
| The statements, opinions and data contained in all publications are solely those of the individual author(s) and contributor(s) and not of MDPI and/or the editor(s). MDPI and/or the editor(s) disclaim responsibility for any injury to people or property resulting from any ideas, methods, instructions or products referred to in the content. |
Share and Cite
Li, X.; Li, W.; Wu, Z.; Xu, Q.; Zheng, D.; Dong, X.; Lu, H.; Shan, Y.; Zhou, S.; Yu, W.; et al. Identification and Deformation Characteristics of Active Landslides at Large Hydropower Stations at the Early Impoundment Stage: A Case Study of the Lianghekou Reservoir Area in Sichuan Province, Southwest China. Remote Sens. 2024 , 16 , 3175. https://doi.org/10.3390/rs16173175
Li X, Li W, Wu Z, Xu Q, Zheng D, Dong X, Lu H, Shan Y, Zhou S, Yu W, et al. Identification and Deformation Characteristics of Active Landslides at Large Hydropower Stations at the Early Impoundment Stage: A Case Study of the Lianghekou Reservoir Area in Sichuan Province, Southwest China. Remote Sensing . 2024; 16(17):3175. https://doi.org/10.3390/rs16173175
Li, Xueqing, Weile Li, Zhanglei Wu, Qiang Xu, Da Zheng, Xiujun Dong, Huiyan Lu, Yunfeng Shan, Shengsen Zhou, Wenlong Yu, and et al. 2024. "Identification and Deformation Characteristics of Active Landslides at Large Hydropower Stations at the Early Impoundment Stage: A Case Study of the Lianghekou Reservoir Area in Sichuan Province, Southwest China" Remote Sensing 16, no. 17: 3175. https://doi.org/10.3390/rs16173175
Article Metrics
Article access statistics, further information, mdpi initiatives, follow mdpi.
Subscribe to receive issue release notifications and newsletters from MDPI journals
IMAGES
VIDEO
COMMENTS
Learn about the world's largest hydroelectric facility, its construction, and its environmental and social impacts. The web page covers the history, design, features, and challenges of the Three Gorges Dam project.
Learn about the benefits and disadvantages of the Three Gorges Dam project in China, a large scale development project that aims to create jobs, electricity, tourism and more. Watch a video and read a summary of the case study.
The Three Gorges Dam (TGD) locates at the outlet of the upper Yangtze river, approximately 40 km upstream of the Yichang hydrological station. The storage capacity of TGR is about 393 × 10 8 m 3 , corresponding to its normal impoundment water level of 175 m.
The dam allows the navigation of oceangoing freighters and generates hydroelectric power. It was also intended to provide protection from floods, but efficacy on this point is unclear and has been debated. While the construction of the Three Gorges Dam was an engineering feat, it has also been fraught with controversy: construction of the dam ...
Yang, Y., Zhang, M., Zhu, L. et al. Influence of Large Reservoir Operation on Water-Levels and Flows in Reaches below Dam: Case Study of the Three Gorges Reservoir. Sci Rep 7, 15640 (2017 ...
This paper adopted a case study approach to investigate the sustainable development practice in the Three Gorges Project. The case study shows that under the guidance of the State Council, the China Three Gorges Corporation has devoted to manage environmental, economic and social sustainability issues of the Three Gorges Project across various ...
The Three Gorges Dam (TGD) and associated infrastructure is the largest integrated water project built in the history of the world. It has also been one of the most contro-versial due to its massive environmental, economic, and social impacts. The very first volume of The World's Water, published more than a decade ago, reviewed the plans ...
A large-scale coupled hydrological-hydrodynamic-dam operation model is developed to evaluate the flood control, hydropower and water supply impacts of the Three Gorges Reservoir. The paper compares the model results with historical data and other studies and discusses the challenges and opportunities of dam operation.
After the operation of the Three Gorges Dam at full capacity at the end of 2008, new environmental and ecological issues are emerging. ... A Case Study of China's Three Gorges Project. New York: ME Sharpe. Google Scholar. Meng QH, Fu BJ, and Yang LZ ( 2001) Effects of land use on soil erosion and nutrient loss in the Three Gorges Reservoir ...
The official figure for the Three Gorges Dam stands at 1.13 million; however, at least another 4 million people are being resettled in Chongqing Municipality so that their agricultural practices do not contribute to soil erosion in the dam's catchment (Webber 2012, p.85), so the aggregate figure at Three Gorges is probably closer to 6 million.
The Three Gorges Dam is the largest hydroelectric dam in the world, providing energy production, flood control, and navigation to China's Yangtze River area. In its full completion with 26 turbines, it has a full power capacity that exceeds 22,000 MWe. Intended to help reduce China's energy reliance on burning coal, the energy from Three Gorges ...
The Three Gorges dam under construction on the Chang Jiang (Yangtze) will, if completed, be China's, and the world's, largest dam. Approximately twice ... Exam Hint: This is a complex case study so you need to put the essential facts on case study summary cards under headings such as for and against the Megadam. Learn a simple sketch
Learn about the benefits and challenges of the world's largest river management scheme on the Yangtze River. The dam provides flood control, electricity, navigation, and water supply, but also displaces people, causes landslides, and affects ecosystems.
Three Gorges Dam - Hydroelectricity, Environmental Impact, Controversy: First discussed in the 1920s by Chinese Nationalist Party leaders, the idea for the Three Gorges Dam was given new impetus in 1953 when Chinese leader Mao Zedong ordered feasibility studies of a number of sites. Detailed planning for the project began in 1955. Its proponents insisted it would control disastrous flooding ...
The Three Gorges Dam (TGD), the largest hydropower project in the world, was constructed on the Yangtze River in China. The resulting Three Gorges Reservoir (TGR), the world's largest manmade reservoir, extends 660 km along the waterway of the Yangtze River, with an average width of 1-2 km. ... so a more comprehensive and multiseason case ...
The Three Gorges Dam (simplified Chinese: 三峡大坝; traditional Chinese: 三峽大壩; pinyin: Sānxiá Dàbà) is a hydroelectric gravity dam that spans the Yangtze River near Sandouping in Yiling District, Yichang, Hubei province, central China, downstream of the Three Gorges.The world's largest power station in terms of installed capacity (22,500 MW), [5] [6] the Three Gorges Dam ...
The debate over the world's largest dam, the Three Gorges Dam (TGD) (Figure 1), highlights many of the controversies relating to dam construction (see Edmonds 1991), but in this case the dam proponents prevailed, and the huge structure is now in place. Many ecologists and other scientists have expressed concern
NATIONAL CENTER FOR CASE STUDY TEACHING IN SCIENCE Background With the recent increased focus on renewable energy sources, hydroelectric dams are being constructed at a record ... China, before damming (left, 17 April 1987) and the Three Gorges Dam and reservoir after damming (right, 9 May 2004). Data available from the U. S. Geological Survey ...
The three gorges dam refers to 120-mile stretch of limestone cliff along the upper reaches of Yangtzi River. The dam has a height of 185 m and is 2309 m wide. The dam has created the Three Gorges Reservoir which has a surface area of 400 square miles and extends upstream from the dam in 600 km.
With the recent worldwide focus on renewable energy sources, Hydroelectric dams that control the flow of a river are being built faster than ever before. One of the prime examples of this, is the Three Gorges Dam - now the largest power station in the world. The Three Gorges dam originally began construction in 1992, on a chokepoint of the ...
A-Level documentary film Produced by Fred Wheeler & Narrated by Nick Paine. (AS-Level Geography | Energy Case Study: The Three Gorges Dam.)We do not own all ...
Since the construction and impoundment of the Three Gorges Dam project on the Yangtze River (since 2003), experimental impoundment at an elevation of 175 m above sea level began in the TGRA in 2008. ... Fei M. 2016. A case study of pillar-shaped rock mass failure in the Three Gorges Reservoir Area, China. QJEGH. 49:195-202. doi: 10.1144 ...
The Three Gorges Dam is the world's largest dam. Since the founding of the PRC, the Three Gorges Dam was seen by the CCP as a critical nation-building project that would, amongst other things, provide a sustainable source of energy to drive industrialisation, facilitate navigation and water management in central China, and showcase China's emergence as an economic and technological superpower.
GCSE case study: Three Gorges Dam. 5 terms. Imogen583. Preview. chapter 13. 14 terms. carter_hall55. Preview. Ravenstein Theroy. 9 terms. avery612009. Preview. Atmosphere and Climate Change. 20 terms. ... Advantages - How does the Three Gorges Dam help the economy? Gorge. What is this? 1.1. Disadvantages - How many people had to resettle ( in ...
They focused on a case study for the city of Zonguldak, aiming to use the natural gas reserves more efficiently and environmentally. The study primarily investigates blending natural gas with 20% hydrogen by volume. ... B. R. Kumar, Case 16: Three Gorges Dam—The World's Largest Hydroelectric Plant, in Project Finance: Structuring, ...
Subsequent research should incorporate additional case studies to provide a comprehensive analysis of landslide activity in the reservoir area. 6. Conclusions ... Cojean, R.; Cai, Y.J. Analysis and modeling of slope stability in the Three-Gorges Dam reservoir (China)—The case of Huangtupo landslide. J. Mountain Sci. 2011, 8, 166-175 ...