Want to create or adapt books like this? Learn more about how Pressbooks supports open publishing practices.

14.2 Incorporating Effective Visuals into a Presentation
Learning objectives.
- Recognize the characteristics of effective visual aids.
- Analyze different types of visual aids and appropriate ways to use them.
- Determine how to create original visual aids and how to locate visual aids created by others.
Good communication is a multisensory experience. Children first learning how to read often gravitate toward books with engaging pictures. As adults, we graduate to denser books without pictures, yet we still visualize ideas to help us understand the text. Advertisers favor visual media—television, magazines, and billboards—because they are the best way to hook an audience. Websites rely on color, graphics, icons, and a clear system of visual organization to engage Internet surfers.
Bringing visuals into a presentation adds color, literally and figuratively. There is an art to doing it well. This section covers how to use different kinds of visual aids effectively.
Using Visual Aids: The Basics
Good writers make conscious choices. They understand their purpose and audience. Every decision they make on the page, from organizing an essay to choosing a word with just the right connotations, is made with their purpose and audience in mind.
The same principle applies to visual communication. As a presenter, you choose the following:
- When to show images or video for maximum impact
- Which images will best produce the effect you want
- When to present information using a table, chart, or other graphic
- How much text to include in slides or informational graphics
- How to organize graphics so they present information clearly
Your goal is to use visual media to support and enhance your presentation. At the same time, you must make sure these media do not distract your audience or interfere with getting your point across. Your ideas, not your visuals, should be the focus.
As you develop the visual side of your presentation, you will follow a process much like the process you follow when you write. You will brainstorm ideas, form an organizational plan, develop drafts, and then refine and edit your work. The following sections provide guidelines to help you make good decisions throughout the process.
What Makes Visual Aids Effective?
To help you get a sense of what makes visual media work, think about what does not work. Try to recall occasions when you have witnessed the following visual media failures:
- Websites crammed with so many images, flashing phrases, and clashing colors that they are almost unreadable
- Assembly instructions with illustrations or diagrams that are impossible to follow
- Photographs that are obviously (and badly) altered with photo-editing software
- Distracting typos or other errors in signs, advertisements, or headlines
- Tables, charts, or graphs with tiny, dense text or missing labels
In each case, the problem is that the media creator did not think carefully enough about the purpose and audience. The purpose of images, color, or flashing text on a website is to attract attention. Overusing these elements defeats the purpose because the viewer may become overwhelmed or distracted. Tables, charts, and graphs are intended to simplify complex information, but without clear labels and legible text, they will confuse the audience.
In contrast, effective visual elements are chosen or created with the purpose and audience in mind. Although a photo shoot for a magazine article might result in dozens of images, editors choose those few that work best with the article. Web designers and video game creators have an audience test their products before they are released, to ensure that people will understand how to use them. Understanding the function of different visual aids will help you use them with purpose.
Types of Visual Aids
Visual aids fall into two main categories—images and informational graphics. Images include photographs, illustrations and clip art, and video footage. Informational graphics include tables, charts, bar graphs, and line graphs.
These visual aids serve two purposes: to add emotional impact to your presentation and to organize information more clearly. With that in mind, read to find out how specific types of visual aids achieve those purposes.
Photographs
A striking photograph can capture your audience’s attention far more successfully than words can. Consider including photographs at the beginning or end of your presentation to emphasize your main ideas or to accompany a particularly important point in the body of your presentation. Remember that, as with other types of graphics, less is often more. Two or three well-chosen photographs are more effective than a dozen mediocre ones.
When you choose photographs, ask yourself these questions:
- What purpose does this image serve? Will it surprise the audience? Will it provoke a strong emotional response? Does it support an important point?
- Will this photograph be more effective if shown with only a caption, or does it need additional text?
- Will the audience understand what is happening in the photograph? Is the meaning immediately evident, or does the photo need some context?
- Would editing the image make it more effective? Consider using image-editing software to crop the photo, change the brightness, or make other cosmetic changes. (Do not go overboard, though. A slightly imperfect but authentic image is preferable to one that has been obviously altered.)
To illustrate the sense of helplessness people felt in the midst of tragedy, a student could use a photograph that shows fear, weariness, or defeat on the face of the photograph’s subject.
Figure 14.3

Neil Moralee – On The Scrap Heap . – CC BY-NC-ND 2.0.
Illustrations
Illustrations, such as editorial or political cartoons, serve much the same purpose as photographs. Because an illustration does not capture a moment in time the way a photo does, it may have less impact. However, depending on your topic and the effect you want to achieve, illustrations can still be very useful. Use the same criteria for choosing photographs to help you choose illustrations.
Figure 14.4

Humor Blog – Political Cartoon about Budget Cuts – CC BY 2.0.
The style of an illustration or photograph affects viewers just as the content does. Keep this in mind if you are working with the stock images available in office software programs. Many of these images have a comical tone. This may be fine for some topics—for instance, a presentation on television shows for children. However, if you need to project a more serious tone, make sure you choose images to suit that purpose. Many free (or reasonably priced) image banks are available online.
Video Footage
Even more than photographs, video footage can create a sense of immediacy, especially if your video includes sound. Showing a brief video clip can help your audience feel as if they are present at an important event, connect with a person being interviewed, or better understand a process. Again, ask yourself the following questions to ensure you are using the footage well:
- What purpose does this video serve? (Never rely on video clips just to fill time.)
- How much footage should be shown to achieve your purpose?
- What will need to be explained, before or after showing the video, to ensure that your audience understands its significance?
- Will it be necessary to edit the video to stay within time requirements or to focus on the most important parts?
Informational graphics, such as tables, charts, and graphs, do not provoke the same response that images do. Nevertheless, these graphics can have a powerful impact. Their primary purpose is to organize and simplify information.
Tables are effective when you must classify information and organize it in categories. Tables are an especially good choice when you are presenting qualitative data that are not strictly numerical. Table 14.1 “Example of Qualitative Data Table” was created for a presentation discussing the subprime mortgage crisis. It presents information about people who have held powerful positions both in the government and at one of the investment banking firms involved in the subprime mortgage market.
Table 14.1 Example of Qualitative Data Table
| Name | Role(s) at Goldman Sachs | Years Active | Government Role(s) | Years Active |
|---|---|---|---|---|
| Henry Paulson | Chief operating officer | 1994–98 | US secretary of the treasury | 2006–9 |
| Chief executive officer | 1998–2006 | |||
| Robert Rubin | Vice chairman and co-chief operating officer | 1987–90 | Assistant to the president for economic policy and director, National Economic Council | 1993–95 |
| Co-chairman and co-senior partner | 1990–92 | US secretary of the treasury | 1995–99 | |
| Stephen Friedman | Co-chief operating officer | 1987–90 | Assistant to the president for economic policy and director, National Economic Council | 2002–5 |
| Co-chairman | 1990–92 | |||
| Chairman | 1992–94 |
Sources: http://www.rollingstone.com/politics/news/%3Bkw=%5B3351,11459%5D ; http://www.nytimes.com/2008/10/19/business/19gold.html ; http://topics.nytimes.com/top/reference/timestopics/people/p/henry_m_jr_paulson/index.html?inline=nyt-per ; http://topics.nytimes.com/top/reference/timestopics/people/r/robert_e_rubin/index.html?inline=nyt-per , http://www.nytimes.com/2002/12/13/us/man-in-the-news-economic-adviser-from-other-side-of-the-deficit-stephen-friedman.html ; http://news.bbc.co.uk/2/hi/business/342086.stm .
If you are working with numerical information, consider whether a pie chart, bar graph, or line graph might be an effective way to present the content. A table can help you organize numerical information, but it is not the most effective way to emphasize contrasting data or to show changes over time.
Pie charts are useful for showing numerical information in percentages. For example, you can use a pie chart to represent presidential election results by showing what percentage of voters voted for the Democratic presidential candidate, the Republican candidate, and candidates from other political parties.
Figure 14.5

Source: http://www.fec.gov/pubrec/fe2008/2008presgeresults.pdf
Bar graphs work well when you want to show similarities and differences in numerical data. Horizontal or vertical bars help viewers compare data from different groups, different time periods, and so forth. For instance, the bar graph in Figure 14.6 allows the viewer to compare data on the five countries that have won the most Olympic medals since the modern games began in 1924: Norway, the United States, the former Soviet Union, Germany, and Austria. Bar graphs can effectively show trends or patterns in data as well.
Figure 14.6

Source: http://www.nbcolympics.com/medals/all-time-standings/index.html
Line Graphs
Like bar graphs, line graphs show trends in data. Line graphs are usually used to show trends in data over time. For example, the line graph in Figure 14.7 shows changes in the Dow Jones Industrial Average—an economic index based on trading information about thirty large, US-based public companies. This graph shows where the Dow closed at the end of each business day over a period of five days.
Figure 14.7

Source: http://www.google.com/finance/historical?cid=983582&startdate=May+17%2C+2010&enddate=May+21%2C+2010
In this exercise, you will begin to refine your ideas for incorporating media into your presentation. Complete the following steps on your own sheet of paper.
- Revisit the list you brainstormed for Note 14.12 “Exercise 3” in Chapter 14 “Creating Presentations: Sharing Your Ideas” , Section 14.1 “Organizing a Visual Presentation” and the annotated outline you developed for Note 14.17 “Exercise 4” .
- Analyze the two different types of visual aids: images and informational graphics. Identify at least two places in your presentation where you might incorporate visual aids.
- Evaluate the purpose of the visual aid. Does it create emotional impact, or does it organize information? Is the visual effective?
- Determine whether you will be able to create the visual aid yourself or will need to find it.
Creating Original Visual Aids
You will include original visual aids in your presentation to add interest, present complex information or data more clearly, or appeal to your audience’s emotions. You may wish to create some visual aids by hand—for instance, by mounting photographs on poster board for display. More likely, however, you will use computer-generated graphics.
Computer-generated visual aids are easy to create once you learn how to use certain office software. They also offer greater versatility. You can print hard copies and display them large or include them in a handout for your audience. Or, if you are working with presentation software, you can simply insert the graphics in your slides.
Regardless of how you proceed, keep the following guidelines in mind:
- Create visual aids with purpose. Think carefully about how they will enhance your message, and choose a form that is appropriate for your content.
- Strive for quality. You do not need the skills of a professional photographer or designer, but do take time to make sure your visual aids are neat, attractive, and legible. Proofread for errors, too.
Using Software to Create Visual Aids
You can use standard office software to create simple graphics easily. The following guidelines describe how to work with word-processing software and presentation software.
Working with Photographs
Most personal computers come equipped with some basic image-editing software, and many people choose to purchase more advanced programs as well. You can upload photographs from a digital camera (or in some cases, a cell phone) or scan and upload printed photographs. The images can then be edited and incorporated into your presentation. Be sure to save all of your images in one folder for easy access.
Creating Tables
To create a table within a word-processing document consult your software program’s help feature or an online tutorial. Once you have created the table, you can edit and make any additional changes. Be sure that the table has no more than six to seven rows or columns because you do not want to compromise the size of the text or the readability. Aligning with precision will help your table look less crowded. Also, the row and column titles should spell out their contents.
Creating Graphs
Figure 14.8

Pie charts and bar and line graphs can also be created using standard office software. Although you can create these graphics within a document, you will need to work with both your word-processing application and your spreadsheet application to do so. The graph should visually explain the data using colors, titles, and labels. The use of color will help the audience distinguish information; however, avoid colors that are hard on the eyes, such as lime green or hot pink. The title should clearly state what the graph explains. Lastly, avoid using acronyms in the titles and other labels.
Creating Graphics in an Electronic Presentation
If you plan to work only with hard copy graphics during your presentation, you may choose to create them as word-processing documents. However, if you are using presentation software, you will need to choose one of the following options:
- Create your graphics using the presentation software program.
- Create your graphics within another program and import them.
Standard office presentation software allows you to create informational graphics in much the same way you would create them within a word-processing application. Keep the formatting palette, a menu option that allows you to customize the graphic, open while you use the software. The formatting menu provides options for inserting other types of graphics, such as pictures and video. You may insert pictures from an image bank available within the program, or insert images or video from your own desktop files. Shape your use of multimedia in accordance with the message your presentation is trying to convey, the purpose, and your audience.
Creating Visual Aids by Hand
Most of the time, using computer-generated graphics is more efficient than creating them by hand. Using office software programs helps give your graphics a polished appearance while also teaching you skills that are useful in a variety of jobs. However, it may make sense to use hand-created visual aids in some cases—for instance, when showing a 3-D model would be effective. If you follow this route, be sure to devote extra time to making sure your visual aids are neat, legible, and professional.
Flip charts are inexpensive and quick visual aids used during face-to-face presentations. The flip chart can be prepared before, as well as during, the presentation. Each sheet of paper should contain one theme, idea, or sketch and must be penned in large letters to be seen by audience members farthest away from the speaker.
Writing Captions
Any media you incorporate should include a caption or other explanatory text. A caption is a brief, one- to two-sentence description or explanation of a visual image. Make sure your captions are clear, accurate, and to the point. Use full sentences when you write them.
Captions should always be used with photographs, and in some cases, they can be useful for clarifying informational graphics, which represent qualitative data visually. However, informational graphics may not require a caption if the title and labels are sufficiently clear. For other visual media, such as video footage, providing explanatory text before or after the footage will suffice. The important thing is to make sure you always include some explanation of the media.
In this exercise, you will begin to develop visual aids for your presentation. Complete the steps in this exercise—and enjoy the chance to be creative. Working with visuals can be a pleasant way to take a break from the demands of writing.
- Revisit the ideas you developed in Note 14.24 “Exercise 1” . Choose at least two ideas that you can create. ( Note: If you are using software to develop a slideshow presentation, count this as one of your self-created visual aids. Include at least one other self-created visual aid, such as an original photograph, within your slideshow.)
- Get creative! Take your photographs, construct a 3-D model, create informational graphics, or work on your presentation slides. Develop good working drafts.
- After you have completed drafts of your visual aids, set them aside for a while. Then revisit them with a critical eye. First, check any text included with the graphic. Make sure your facts are correct, your words are clear and concise, and your language is free of errors.
- Next, evaluate how well your aids work visually. Are they large enough to be seen and read from a distance? Are captions and labels easy to find? Are photographs of reasonably high quality? Ask someone else for feedback, too.
- Begin making any needed changes. As you proceed through the rest of this section, continue to revisit your work to improve it as needed.
Collaboration
Please share the first version of your visual aids with a classmate. Examine what they have produced. On a separate piece of paper, note both the elements that catch your attention and those that would benefit from clarification. Return and compare notes.
Testing and Evaluating Visual Aids
Regardless of how you create your visual aids, be sure to test-drive them before you deliver your presentation. Edit and proofread them, and if possible, show them to someone who can give you objective feedback. Use the following checklist.
Checklist 14.1
Visual Aid Evaluation Checklist
- Visual aids are clearly integrated with the content of the presentation
- Photographs and illustrations suit the overall tone of the presentation
- Images and text are large and clear enough for the viewer to see or read
- Images are shown with explanatory text or a caption
- Informational graphics include clear, easy-to-read labels and headings
- Text within informational graphics is easy to read (Watch out for wordiness and crowded text or a font that is too small and hard to read.)
- Formatting choices (color, different fonts, etc.) organize information effectively
- Any text within graphics is free of errors
- Hyperlinks within slides function properly
- Display text for hyperlinks is concise and informative (Never paste a link into a slide without modifying the display text.)
Writing at Work
Office software includes many options for personalizing a presentation. For instance, you can choose or create a theme and color scheme, modify how one slide transitions to the next, or even include sound effects. With so many options, students and employees sometimes get carried away. The result can seem amateurish and detract from, rather than enhance, your presentation.
Remember, you are delivering a presentation, not producing a movie. Use the customization options to help give your presentations a consistent, polished, appearance. However, do not let these special effects detract from the substance of your slides.
Using Existing Visual Media
Depending on your topic, you may be able to find images and other graphics you can use instead of creating your own. For instance, you might use photographs from a reputable news source or informational graphics created by a government agency. If you plan to use visual aids created by others, keep the following guidelines in mind:
- Set a purpose before you begin your search. You will search more efficiently if you start with a general idea of what you are looking for—a line graph of unemployment rates for the past twelve months, for example, or a video clip of the most recent State of the Union address.
- Filter out visual aids that are not relevant. You may come across eye-catching graphics and be tempted to use them even if they are only loosely related to your topic, simply because they are attention getting. Resist the temptation. If the graphic is not clearly connected to your point, it does not belong in your presentation.
- Read carefully. In addition to reading labels, headings, and captions, read any text that accompanies the visual. Make sure you understand the visual in its original context. For informational graphics, make sure you understand exactly what information is being represented. (This may seem obvious, but it is easy to misread graphic information. Take the time to examine it carefully.)
- Evaluate sources carefully and record source information. When you look for visual media to complement your presentation, you are conducting research. Apply the same standards you used for your research paper. Choose reliable sources, such as reputable news organizations, government and nonprofit organizations, and educational institutions. Verify data in additional sources. Finally, be sure to document all source information as you proceed.
Searching Efficiently for Visual Media
You will probably find it most efficient to use the Internet to search for visual aids. Many students begin by typing keywords into a search engine to locate related images. However, this search technique is not necessarily efficient, for several reasons:
- It often pulls up hundreds or even thousands of images, which may be only loosely related to your search terms.
- It can sometimes be difficult to understand the image in its original context.
- It can be hard to find copyright information about how you may use the image.
A more efficient strategy is to identify a few sources that are likely to have what you are looking for, and then search within those sites. For instance, if you need a table showing average life expectancy in different countries, you might begin with the website of the World Health Organization. If you hope to find images related to current events, news publications are an obvious choice. The Library of Congress website includes many media related to American history, culture, and politics.
Searching this way has the following advantages:
- You will often find what you are looking for faster because you are not wasting time scrolling through many irrelevant results.
- If you have chosen your sources well, you can be reasonably certain that you are getting accurate, up-to-date information.
- Images and informational graphics produced by reputable sources are likely to be high quality—easy to read and well designed.
If you do choose to use a search engine to help you locate visual media, make sure you use it wisely. Begin with a clear idea of what you are looking for. Use the advanced search settings to narrow your search. When you locate a relevant image, do not download it immediately. Read the page or site to make sure you understand the image in context. Finally, read the site’s copyright or terms of use policy—usually found at the bottom of the home page—to make sure you may use the material.
If you are unable to find what you are looking for on the Internet consider using print sources of visual media. You may choose to mount these for display or scan them and incorporate the files into an electronic presentation. (Scanning printed pages may lower the quality of the image. However, if you are skilled at using photo-editing software, you may be able to improve the quality of the scanned image.)
Inserting Hyperlinks in an Electronic Presentation
If you are working with images, audio, or video footage available online, you may wish to insert a link within your presentation. Then, during your presentation, you can simply click the link to open the website in a separate window and toggle between windows to return to your presentation slides.
To insert a hyperlink within your presentation, click on insert in the toolbar and then select hyperlink from the menu. Doing so will open a dialogue box where you can paste your link and modify the accompanying display text shown on your slide.
Copyright and Fair Use
Before you download (or scan) any visual media, make sure you have the right to use it. Most websites state their copyright and terms of use policy on their home page. In general, you may not use other people’s visual media for any commercial purpose without contacting the copyright holder to obtain permission and pay any specified fees.
Copyright restrictions are somewhat more ambiguous when you wish to download visual media for educational uses. Some educational uses of copyrighted materials are generally considered fair use —meaning that it is legally and ethically acceptable to use the material in your work. However, do not assume that because you are using the media for an educational purpose, you are automatically in the clear. Make sure your work meets the guidelines in the following checklist. If it does, you can be reasonably confident that it would be considered fair use in a court of law and always give credit to the source.
Checklist 14.2
Media Fair Use Checklist
- You are using the media for educational purposes only.
- You will make the work available only for a short period and to a limited audience. For instance, showing a copyrighted image in a classroom presentation is acceptable. Posting a presentation with copyrighted images online is problematic. In addition, avoid any uses that would allow other people to easily access and reproduce the work.
- You have used only as much of the work as needed for your purposes. For video and audio footage, limit your use to no more than 10 percent of the media—five minutes of an hour-long television show, for example. Image use is harder to quantify, but you should avoid using many images from the same source.
- You are using the media to support your own ideas, not replace them. Your use should include some commentary or place the media in context. It should be a supporting player in your presentation—not the star of the show.
- You have obtained the material legally. Purchase the media if necessary rather than using illegally pirated material.
- Your use of the media will not affect the copyright holder or benefit you financially.
By following these guidelines, you are respecting the copyright holder’s right to control the distribution of the work and to profit from it.
In some fields, such as teaching, job applicants often submit a professional portfolio to a prospective employer. Recent college graduates may include relevant course work in their portfolios or in applications to graduate school. What should you do if your course work uses copyrighted visual media?
This use of media is acceptable according to fair use guidelines. Even though you are using the work for your personal professional advancement, it is not considered an infringement on copyright as long as you follow the additional guidelines listed in the previous checklist.
Crediting Sources
As you conduct your research, make sure you document sources as you proceed. Follow the guidelines when you download images, video, or other media from the Internet or capture media from other sources. Keep track of where you accessed the media and where you can find additional information about it. You may also provide a references page at the end of the presentation to cite not only media and images but also the information in the text of your presentation. See Chapter 13 “APA and MLA Documentation and Formatting” for more information on creating a reference page.
Write captions or other explanatory text for visual media created by others, just as you would for media you created. Doing so helps keep your audience informed. It also helps ensure that you are following fair use guidelines by presenting the media with your commentary, interpretation, or analysis. In your caption or elsewhere in your presentation, note the source of any media you did not create yourself. You do not need to provide a full bibliographical citation, but do give credit where it is due.
In this exercise, you will locate visual aids created by others and continue developing the work you began earlier. Complete these steps.
1. Revisit the ideas you developed in Note 14.24 “Exercise 1” . Choose at least two ideas for which it would make more sense to find the visual aid than to create it yourself. 2. Use the search tips provided in this section to locate at least two visual aids from reputable sources that you can use. Prepare them for your presentation by adding clarifying text as needed. Be sure to credit your source. 3. Incorporate the visual aids you created in Note 14.26 “Exercise 2” and Note 14.32 “Exercise 3” into your presentation. This may involve preparing physical copies for display or inserting graphic files into an electronic presentation.
4. Take some time now to review how you will integrate the visual and verbal components of your presentation.
- If you are working with presentation software, refine your slides. Make sure the visual approach is consistent and suits your topic. Give your text a final proofread.
- If you are not using presentation software, review the annotated outline you created in Note 14.24 “Exercise 1” . Update it as needed to reflect your current plan. Also, determine how you will physically set up your visual aids.
Key Takeaways
- Visual aids are most effective when they are chosen with the purpose and audience in mind. They serve to add emotional impact to a presentation and to organize information more clearly.
- Visual aids should always be clearly related to the presenter’s ideas. Captions, labels, and other explanatory text help make the connection clear for the audience.
- Like writing, developing the visual components of a presentation is a process. It involves generating ideas, working with them in a draft format, and then revising and editing one’s work.
- Visual aids can be divided into two broad categories—image-based media and informational graphics.
- Widely available software programs make it relatively easy to create visual aids electronically, such as photo images, charts, and graphs.
- When using visual aids created by others, it is important to apply good research skills, follow guidelines for fair use, and credit sources appropriately.
Writing for Success Copyright © 2015 by University of Minnesota is licensed under a Creative Commons Attribution-NonCommercial-ShareAlike 4.0 International License , except where otherwise noted.

VisualStory®
- Duarte DataStory®
- Presentation Principles™
Slide:ology®
- Slide Design
Speaker Coaching
- Presenting Virtually™
- Illuminate™
- Adaptive Listening™
- Team training
- Learning journeys
- Brand and product storytelling
- Keynotes and events
- Sales enablement
- Communication systems
- Accelerator Lab™
- Our culture
- Our leaders
- Case studies
- Media mentions
Guides and tools
- Learner support
The ultimate guide to contrast: What your presentation is missing

Phoebe Perelman
Got a big presentation coming up ? If you’ve ever taken Nancy Duarte’s highly-rated workshop Resonate ®, you’ll discover that the secret to a standout presentation or speech is creating tension in your content. She coined this as contrast , and officially, the structure to model your presentations is called a Presentation Sparkline™.
Contrast is your secret weapon for an unforgettable presentation. By weaving contrast into your:
- Slide design
- Narrative structure
- And vocal delivery
You can give presentations that grab attention and resonate deeply with your audience. Depending on your call to action , it can also make your presentation persuasive, getting your audience to do whatever it is you’re hoping they do. Let’s dive into why contrast is so powerful and how to use it effectively.
What is contrast?
Contrast is when you create an intentional rhythm in your presentation content. Largely unveiled in Nancy’s TED Talk , she goes into the secret structure that makes the best speeches great, and she identifies it as employing contrast in a speech or presentation.
It can be represented as ebbs and flows, highs and lows, arguments and counterarguments, solutions and problems. In a nutshell, contrast places opposing elements together to highlight their differences, making it a versatile tool beyond aesthetics alone.
A review of common presentations
Let’s talk about common presentations, and how they often don’t use contrast. You’ve seen these in the corporate world or a timeshare presentation. You’ll learn why they are unsuccessful at moving audiences to action or keeping them engaged.
The report presentation
Every presentation follows a “shape.” Let’s look at a report. Its presentation shape looks something like this:

The bottom line represents “what is,” and the top line represents “what could be.” In a typical report, you spend the majority of your time talking about the current status of things. The good, the bad, and the ugly. Then you might suggest a recommendation at the end that could change what the future looks like.
The problem with a report is that it’s boring, and usually, it takes time to “get to the point.” It doesn’t keep your audience engaged, and if you’re presenting to the C-suite , they are annoyed, unengaged, and ready to move on to their next meeting.
The sales pitch presentation
Now let’s look at a pitch. It could be a sales pitch or an investor pitch . Its presentation shape looks something like this:

In a typical pitch, you open with the status of things, then spend most of your time talking about how amazing the future will be once you adopt this new idea, product, or service.
The problem with a pitch is that it sounds too good to be true. You spend the whole presentation talking about how your idea is the best thing since sliced bread. Your audience’s guard is up, they’re trying to find the loopholes or the problems (because you didn’t provide any) and they’re trying to figure out “your angle.”
Why should you use contrast?
Both types of these common presentations have failed at employing contrast. There’s not enough to keep your audience engaged or to build trust.
That’s why the best presentations employ contrast, and their shape looks something like this:

Here’s why contrast works:
1. Contrast captures attention
Our brains are wired to notice differences. In an over-stimulating world, we’re constantly filtering information and determining what’s meaningful and what’s not. Naturally, anything that stands out from — or contrasts — the status quo grabs our attention.
2. Contrast clarifies messages and guides the audience
Your presentation is taking your audience on a journey. You’re the storyteller, and your audience is the hero . When used strategically, contrast helps guide your audience through your presentation, clarifying the most important points, emphasizing your message, and making it easier to grasp.
3. Contrast engages emotions
Contrasting content (like addressing challenges and rewards or a personal story illustrating what’s possible despite hardship) can evoke strong emotions , making your presentation more engaging, authentic, and relatable.
Now that you know a bit about why contrast works, let’s cover how it works. Visual contrast is up first.
Visual contrast: Techniques and examples
Visual contrast entails using colors, sizes, shapes, and fonts to make specific elements and pieces of information stand out. Here are some ways to integrate contrast visually into your presentation slides:
1. Visual contrast technique: Color
High contrast colors.
Use colors that stand out against each other to highlight key points. Think black-and-white schemes or complementary colors.
Accent colors
Use a distinct color to emphasize critical elements like call-to-action buttons or important data points.
2. Visual contrast technique: Size and scale
Varying sizes.
Play with different sizes for text and images to create a visual hierarchy. Larger elements naturally draw the eye in first.
Proportional emphasis
Highlight significant data or quotes by enlarging them compared to other content.
3. Visual contrast technique: Font styles
Combine different fonts and styles (like bold and italics) to differentiate headings from body text or to emphasize key phrases/terms.
Disclaimer: While using a few different colors, sizes, and fonts is an effective use of contrast, it’s important to maintain a sense of overall consistency to avoid a chaotic or busy look. Something that you can learn more thoroughly in a slide design workshop like Slide:ology ® or Slide Design .
4. Visual contrast technique: Images and text
Alternating elements.
Balance text with impactful images, icons, or graphics. This adds visual interest and makes it easier for the audience to digest (compared to crowded, text-only slides). For example, infographics can help audience members process complex content.
Industry leaders like Apple are no strangers to using contrast in presentations. Apple’s product launches often consist of bold text on clean backgrounds and the strategic use of color to help emphasize their messages.

Example slide from an Apple product presentation displaying contrast.
Many TED Talk speakers also nail visual contrast. The speakers who use simple, clear slides with bold visuals and minimal text keep the focus on their spoken words and create a powerful visual and auditory experience.
Narrative contrast: Techniques and examples
Like visual contrast, narrative contrast involves juxtaposing dissimilar elements, but instead of visual elements, these include ideas, emotions, or scenarios. Let’s explore how you can integrate contrast into your presentation content.
- Current vs. future state : Contrast the current situation with the potential future state. This fluctuation between “what is” and “what could be” illustrates the existing gaps and the potential of your proposal (and it’s the crux of Nancy Duarte’s world-renowned Duarte Method™).
- Problem vs. solution : Oscillate back and forth between a problem or challenge the audience faces, and how your solution addresses each of their concerns.
- Stories vs. data : Balance qualitative content (stories, examples, and anecdotes) with quantitative content (hard data and metrics). This way, you’ll appeal to the audience’s minds and hearts.

Have you ever watched Dreamforce keynotes ? (We make their presentation visuals by the way.) They’re great examples of how corporate presenters can infuse narrative contrast. Salesforce speakers always address the current business landscape before conveying how their innovative products and solutions meet the moment, using a mix of customer testimonials, bold visuals, and clear data points to motivate the audience to listen and act.
Narrative contrast comes in many forms. Whatever type you choose, leverage it to build and release tension, ebbing and flowing back and forth between two opposing states.
Vocal contrast: Enhancing delivery
Now it’s time to cover how contrast impacts your presentation delivery . Here are some tips on how to incorporate vocal contrast to ensure your message is received effectively:
Contrast your pitch to keep the audience engaged
No one wants to listen to a robot: A monotonous voice will lose the audience’s attention. Fluctuating your vocal pitch keeps the audience engaged. Use a higher pitch to convey curiosity or to add some humor. Then use a lower your pitch during more serious moments or declarative statements. This is called vocal variety .
Contrast your pacing to help the audience grasp the message
In addition to changing your pitch to emphasize a point, you can also adjust your pace . Slow down to highlight an important point and give the audience time to absorb the information. Increase your pace to convey excitement, urgency, or overwhelm. In other words, use the speed of your speech to convey the emotion you want your audience to feel.
Contrast your volume to convey the tone
Use varying levels of volume to complement your message. Speaking louder can help you command the room, conveying confidence, authority, and energy. Lowering your volume, on the other hand, can create a sense of intimacy or warmth, drawing the audience in during more reflective or emotional moments. What type of tone (or tones) do you need to set, and when? Once identified, use your voice accordingly.

Pause to give the audience time to process:
White space is to slide design as pausing is to presentation delivery: Necessary for breathing room and audience comprehension. Pause after a significant point so the audience has a moment to process. There is no need to fill every second of space with your voice — embrace the pause so your message can sink in.
When I think about skilled speakers , Steve Jobs comes to mind. Jobs was an expert at using vocal contrast. He varied his pitch, tone, and pace to emphasize key points and take the audience on a journey, often using dramatic pauses to build anticipation before revealing new products .
Final tips for incorporating contrast
Here are a few final tidbits to keep in mind during your contrast-infusing endeavors.
1. Know your audience
Before you start thinking about contrast, analyze your audience . Consider their dreams, fears, and objections. Then, you’ll be in the right state of mind to identify the content that they need to hear.
For example, analytical audiences may prefer more data, while emotionally driven audiences may respond better to stories. Although it’s important to strike a balance, it’s also important to lean into what the audience needs most. Download our Audience Needs Map ™to help you get started!

2. Organize your narrative
Start with a clear understanding of your key messages and build around them. Then, identify all the potential forms of contrast in your story — the problems and solutions, the before’s and after’s, the metrics and the stories. Use the Presentation Sparkline ™ structure to fluctuate between what is and what could be throughout your entire presentation to maintain engagement.
3. Design with accessibility in mind
Although you may want to introduce high-contrast colors to highlight important elements, use a consistent color scheme and don’t go overboard with the color wheel. Ensure text is legible against backgrounds by choosing colors with sufficient contrast and utilizing a color contrast checker to be safe. It’s always a good idea to brush up on accessibility best practices to ensure you’re using contrast accessibly.
4. Practice delivering
Like any skill, developing public speaking prowess and dynamic stage presence takes practice . Practice varying your pitch, pace, tone, and volume by reading children’s books, newspaper headlines, or using previous presentations. Find the most important word in a sentence and practice verbally punching it. Record yourself and listen back. Do it again. The more you practice, the more awareness you’ll build, and the more naturally vocal contrast will come.
If you really want to nail your delivery, hire a speaker coach or take our public speaking workshop, Captivate ™. Both are great resources to get you stage-ready if you have a high-stakes moment coming up!
Master contrast with Duarte
Incorporating visual, narrative, and vocal contrast into your business presentations can significantly enhance their impact.
Remember, a great presentation is not just about sharing information; it’s about creating an experience that resonates with your audience. With the power of contrast, you can turn even the most complex topic into a captivating story, ensuring your message is not only heard but also remembered.
If you want to learn how to master contrast in your next presentation, train yourself and your team with our Resonate® workshop . You’ll get to work hands-on on a presentation or speech you’d like to deliver and come out with a well-structured presentation full of contrast.

Check out these related courses
Adaptive Listening™
Build trust and traction
Uncover a better way to listen that goes beyond active listening and paying attention. Learn about the way you prefer to listen, and adapt to meet the needs of others.
Captivate™
Improve your public speaking
Overcome bad habits, conquer fears, and increase your confidence in any speaking setting. Discover your strengths and build on them to improve your delivery.
Structure and storyboard a talk
Analyze your audience and organize your ideas into a story structure that will move them. Transform content into visual concepts and build a storyboard for your presentation.
Illuminate™
Drive strategic change
Craft an effective communication strategy that sparks and sustains change with empathetic speeches, stories, ceremonies, and symbols that motivate and inspire teams.
Personalized help for speakers
Up-level your speaking skills with one-on-one support. We’ll help you rehearse your talk, polish your presence, and transform your message delivery.
Craft a persuasive talk
Learn how the world’s greatest speakers use story to persuade. Develop a story structure that powerfully expresses your ideas, applying the principles of empathy, contrast, and variety.
Presentation Principles™
Learn presentation basics
Follow a step-by-step method to write compelling stories, amplify ideas visually, and present with confidence while learning at your own pace.
Turn ideas into visuals
Use visual thinking and design principles to transform information into effective and memorable graphics for presentations.
Create “skimmable” documents
Build helpful pre-reads and impactful leave-behinds with presentation software to support knowledge sharing and decision-making.
Check out these related resources

The secret to writing a call to action in a persuasive speech
Struggling to write a call-to-action for your speech or presentation? Make sure you address the 4 audience types so your CTAs are met with success.

The secret structure of great talks
From the “I have a dream” speech to Steve Jobs’ iPhone launch, many great talks have a common structure that helps their message resonate with listeners. Watch Nancy Duarte’s TEDx Talk that’s garnered over 3 million views.

Presentation formats guide
Get tips on how to determine your presentation format. This guide will help you consider audience size, presentation setting, and the delivery method that best suits your communication needs.

The top 5 presentation mistakes everyone makes
We all know what it’s like to sit through a bad presentation … too long, too boring, indecipherable. The thing is, when we take the stage ourselves, many of us fall into the same presentation mistakes.

Your top 6 storytelling questions (Answered by an expert storyteller)
Can you “over story” in a business setting? Can you be clunky in your story deliver? Find common storytelling questions and answers in this deep-dive on storytelling.

Everything you need to know about using speaker notes in PowerPoint®
Learn all the Powerpoint hacks with speaker notes from an expert presentation designer. Easily design and prepare for your next presentation with ease.
Introduction to Web Accessibility
WebAIM Training
Contrast and Color Accessibility Understanding WCAG 2 Contrast and Color Requirements
You are here: Home > Articles > Contrast and Color Accessibility
Introduction
Contrast and color use are vital to accessibility. Users, including users with visual disabilities, must be able to perceive content on the page. There is a great deal of fine print and complexity within the Web Content Accessibility Guidelines (WCAG) 2 that can easily confuse web content creators and web accessibility evaluators. This article pulls together the terms and principles needed to understand WCAG 2 requirements for contrast and color.
Defining Colors
Colors can be defined in a few ways. For example, this shade of blue may commonly be defined in three different ways in webpage styles:
- rgb (97, 97, 255) : The amount of red, green, and blue that form a color are each presented as a number between 0 and 255.
- #6161FF : This is a "hexadecimal" format where the red/green/blue values are presented as a combination of six letters or numbers. Typically called "Hex," this is a very common format in webpages.
- hsl (240, 100%, 69%) : Hue, saturation, and lightness map more closely to the way people perceive colors. Changing the "lightness" of a color will change its contrast ratio to another color.
Alpha, which is the opacity or transparency of a color, will also impact contrast. Alpha is presented as a number between 0 (completely transparent) and 1 (completely opaque). Reducing the alpha for an element will reduce its contrast because you are allowing an underlying color to bleed through.
WCAG 2 "Contrast Ratio"
In WCAG 2, contrast is a measure of the difference in perceived "luminance" or brightness between two colors (the phrase "color contrast" is never used in WCAG). This brightness difference is expressed as a ratio ranging from 1:1 (e.g. white on white) to 21:1 (e.g., black on a white). To give a frame of reference, on a white background:
- Pure red (#FF0000) has a ratio of 4:1. I am red text.
- Pure green (#00FF00) has a very low ratio of 1.4:1. I am green text.
- Pure blue (#000FF) has a contrast ratio of 8.6:1. I am blue text .
If text and background colors are swapped, the contrast ratio remains the same.
Three success criteria in WCAG 2 address contrast:
1.4.3 Contrast (Minimum)
1.4.6 contrast (enhanced).
- 1.4.11 Non-text Contrast .
One additional success criterion, 1.4.1 Use of Color , references the contrast ratio as part of the requirement for links that are differentiated by color alone.
We will review these four success criteria in detail.
This Level AA requirement reads:
The visual presentation of text and images of text has a contrast ratio of at least 4.5:1, except for the following: Large Text: Large-scale text and images of large-scale text have a contrast ratio of at least 3:1; Incidental: Text or images of text that are part of an inactive user interface component, that are pure decoration, that are not visible to anyone, or that are part of a picture that contains significant other visual content, have no contrast requirement. Logotypes: Text that is part of a logo or brand name has no contrast requirement.
Here are some examples of text with almost exactly 4.5:1 contrast.
- Gray (#767676) on white
- Purple (#CC21CC) white
- Blue (#000063) on gray (#808080)
- Red (#E60000) on yellow (#FFFF47)
For many of us, some of these combinations are not very readable. That is why 4.5:1 is the minimum required by WCAG..
You cannot round a contrast ratio up to 4.5:1. For example, #777777—a commonly-used shade of gray with a 4.47:1 contrast ratio—does not meet this requirement
Images of text
These contrast requirements also apply to text within a graphic, called "images of text" in WCAG 2.
The white text in the image below has insufficient contrast.

Outline and halo
Text effects, like outlines, can impact perceived contrast. WCAG 2 states that the color of a text outline or border can be used as the text or foreground color when measuring contrast.

A text glow/halo around the letters can be used as the background color.

There are three exceptions to the 4.5:1 contrast requirement: large text, incidental text, and logotypes.
Large text is easier to read, so the contrast requirement is reduced to 3:1. WCAG defines large text as text that is 18pt and larger, or 14pt and larger if it is bold.
For example:
- Gray (#949494) 18 point text on white
- Purple (#C86ff1) 14 point + bold text on white
- In web pages, pixels are much more common for text size than points. 18 points maps to 24 pixels and 14 points to approximately 18.67 pixels.
- In CSS, bold text typically has font-weight:bold , or font-weight:700 or greater.
Images of text have the same requirements, but it can be difficult or impossible to measure text size or font weight in an image.
WCAG 2.0 defines four types of "incidental" text that are not required to meet the contrast requirements.
- Inactive: An inactive element, like a disabled Submit button ( Submit ), is identified visually by its lower-contrast state.
- Pure decoration: Decorative text that is not meant to be read. An example of this might be a picture of a bookshelf on a library homepage. The titles of the books are not meant to be read by the user.
- Not visible to anyone: Text that is meant to be hidden, like an invisible skip link would not need to meet any contrast requirements until it becomes visible.
- Part of a picture that contains significant other visual content: Text that is not an important part of the information in the image, like a name tag on the shirt of a person in a photo of a party, does not need to meet any contrast requirements.
As a rule of thumb, text that would be part of the image's alternative text should probably meet contrast requirements while text that would not be added to alternative text can usually be considered incidental.
Text that is part of a logo or brand name has no contrast requirement. If we look back at the example of an image of text used earlier, the amazon music logo would be exempt.
Not mentioned
A couple important contrast considerations are not mentioned in 1.4.3.
Gradients, background images, and transparencies
Text over gradients, semi-transparent colors, and background images still need to meet contrast requirements, but WCAG does not provide any guidance on how to measure their contrast. We recommend usually testing the area where contrast is lowest.
Color changes on hover, focus, etc.
Text sometimes changes color while the user interacts with it using a mouse or keyboard. CSS can be used to define hover, focus, or active states for interactive elements. There is no mention of special consideration for these changes in text color, so text in all these states must meet the same contrast requirements (and must be evaluated independently).
The only difference between this Level AAA success criterion and Level AA 1.4.3 is that contrast requirements are more stringent. It requires 7:1 contrast for normal text and 4.5:1 for large text. Although higher contrast is often recommended, Level AA conformance is the requirement within common laws and standards, so we focus on 1.4.3 requirements throughout this article.
1.4.11 Non-text Contrast
WCAG 2.1, published in June 2018, moves contrast requirements beyond text. 1.4.11 Non-text Contrast (Level AA) reads:
The visual presentation of the following have a contrast ratio of at least 3:1 against adjacent color(s): User Interface Components: Visual information required to identify user interface components and states, except for inactive components or where the appearance of the component is determined by the user agent and not modified by the author; Graphical Objects: Parts of graphics required to understand the content, except when a particular presentation of graphics is essential to the information being conveyed.
There is one notable difference in how contrast requirements are applied. Contrast requirements in WCAG 2.0 are between text and background, but 1.4.11 requires contrast of at least 3:1 against adjacent color(s) " which means you may need to measure contrast in more than one place. A non-text element may have different contrast on one side than the other (like a wedge in a pie chart), or it may contain different-colored components that need 3:1 contrast with each other.
A triangle-shaped icon with an exclamation mark is used to alert the user to something important.

This graphic is composed of two important shapes—the exclamation mark and the triangle (usually reserved for alerts like these). That means there are 2 contrast ratios to consider:
- The contrast ratio between the white exclamation mark and the red triangle, which is over 3:1
- The contrast ratio between the red triangle and the gray background, which is less than 3:1.
This icon does not meet 1.4.11.
User Interface Components
There are two types of non-text elements that 1.4.11 says must have 3:1 contrast. The first are "User Interface Components," which are controls for distinct functions. For example, in a group of linked social media icons, each icon is a distinct user interface component.

Each state of the component must also have 3:1 contrast. States are temporary changes in a component, usually because of a user interaction, such as hovering with a mouse or tabbing with a keyboard.
When a user hovers over a custom checkbox, it turns bright blue (#00B0F0).
This checkbox has 2.5:1 contrast in the hover state, so it fails.
Except when "determined by user agent"
If you use the default styles provided by the browser, then these contrast requirements do not apply.
In Chrome, the default border for a text box has 2.4:1 contrast:
This outline is well below the 3:1 threshold, but since this color was "determined" by the browser and was not customized by the author, it is exempt. Because of the low default contrast, we recommend using CSS to increase the contrast for text boxes and other form inputs.
The most common example of a low contrast "state" is the an outline that appears when an element has keyboard focus. For example, a bright blue outline would be fairly distinctive on a white background but less visible against some colors, and can be almost invisible against a bright blue background.

This bright blue outline was a common for several years, especially in Chrome. Now, the keyboard outline in Chrome and Edge has both a dark and white line, giving it good contrast against any background. Firefox and IE use a dotted black line, which will have low contrast on a dark background. Instead of worrying about changing browser support, use the CSS :focus and outline properties to customize a focus indicator that always has at least 3:1 contrast while also matching your site design and aesthetics. While designing or testing these outlines, pay close attention to areas like headers and footers that often have different background colors.
If there is no visible indication of keyboard focus, this is a failure of 2.4.7 – Focus Visible (Level AA) .
Graphical Objects
The second type of non-text element covered in this success criterion are "graphical objects". There are a couple key terms within this definition.
"Required to understand the content"
For something to be defined as a graphical object that needs 3:1 contrast, it must be "required to understand the content."
A Twitter icon that is a link would need 3:1 contrast. But if the link also includes the word "Twitter" (with at least a 4.5:1 contrast ratio), then the icon is no longer required to understand the content, so it does not have any contrast requirement.
"…except when a particular presentation is essential"
Certain types of images may need to be presented in lower contrast so they don't lose meaning or purpose. A heat map must use low-contrast colors so that underlying page is still visible.

Real-life imagery, like photos and screenshots, also fall into this category. So do logos.
1.4.1 Use of Color
WCAG 2 does not prohibit any specific color or color combination, such as red and green. The previous success criteria require that text and non-text elements have sufficient contrast. Success Criterion 1.4.1, a Level A requirement, prohibits using color alone to present meaningful content or instructions. It reads:
Color is not used as the only visual means of conveying information, indicating an action, prompting a response, or distinguishing a visual element.
In this table of school assignments, the only indication that an assignment is missing or late is a background color. This is inaccessible to someone who is blind, and it may be confusing or inaccessible to someone who is colorblind or overrides page colors. This fails 1.4.3.

One way to address this is to add a second column for the status of the assignment (missing, complete, or late). You can still use color to reinforce information as long as color is not the only way this status is presented. In fact, it makes the information more accessible to users who can see the color difference.

Form instructions and errors
Color is often used in forms to identify required fields and form errors.
For example, a required field that is left empty may be given a red border.

The red border is not enough on its own. The form field will also need an icon,
or an inline error message:

Color-only identification of links
WCAG 2 contrast and color rules overlap in one place: when color is used as the only way to identify a link. This does not apply to every link on a page. For example, links in the header of a webpage are understood to be links based on their position in the page, the use of whitespace, and often by a distinct font. This requirement refers to places where body text and link text appear together and where color alone is used to identify links (meaning the underline has been removed). For optimal accessibility and usability, maintain the underline on links. Otherwise two conditions must be met:
- 3:1 contrast between the body text and the link text.
- A "visual cue" (not just a color change) that appears on keyboard focus (we also recommend mouse hover). The most common way to meet this is to underline the link on hover and focus.
These requirements are in addition to the 1.4.3 text contrast requirement of 4.5:1. Meeting all three of these requirements simultaneously can be difficult.
A form ends with a line of text that reads: "By submitting this form, you agree to our Terms of Use." The dark gray (#2E2E2E) body text has 13.6:1 contrast on a white background. The blue (#0079AD) "Terms of Use" link has 4.8:1 contrast, so text meets the contrast requirements.
...but there is only 2.8:1 contrast between the body text and the link text. A slightly lighter shade of blue (#0081B8) would provide just over 3:1 contrast between the link and the body text:
... but now it has less than 4.5:1 contrast with the background! With these text and background colors, it is impossible to use non-underlined links and also meet the WCAG guidelines.
This becomes increasingly difficult if the links change color on hover or focus each of the colors in these states must also have at least a 4.5:1 contrast ratio difference with the background. WCAG 2.0 and Link Colors on the WebAIM blog explores the WCAG requirements for link colors in more depth.
.css-1qrtm5m{display:block;margin-bottom:8px;text-transform:uppercase;font-size:14px;line-height:1.5714285714285714;-webkit-letter-spacing:-0.35px;-moz-letter-spacing:-0.35px;-ms-letter-spacing:-0.35px;letter-spacing:-0.35px;font-weight:300;color:#606F7B;}@media (min-width:600px){.css-1qrtm5m{font-size:16px;line-height:1.625;-webkit-letter-spacing:-0.5px;-moz-letter-spacing:-0.5px;-ms-letter-spacing:-0.5px;letter-spacing:-0.5px;}} Best Practices The #1 rule for improving your presentation slides
by Tom Rielly • May 12, 2020

When giving presentations, either on a video conference call or in person, your slides, videos and graphics (or lack of them) can be an important element in helping you tell your story or express your idea. This is the first of a series of blog posts that will give you tips and tricks on how to perfect your visual presentations.
Your job as a presenter is to build your idea -- step-by-step -- in the minds of your audience members. One tool to do that is presentation graphics, such as slides and videos.
Why graphics for your presentation?
A common mistake is using slides or videos as a crutch, even if they don’t actually add anything to your presentation. Not all presentations need graphics. Lots of presentations work wonderfully with just one person standing on a stage telling a story, as demonstrated by many TED Talks.
You should only use slides if they serve a purpose: conveying scientific information, art, and things that are hard to explain without pictures. Once you have decided on using slides, you will have a number of decisions to make. We’ll help you with the basics of making a presentation that is, above all, clear and easy to understand. The most important thing to remember here is: less is more.
Less is so much more
You want to aim for the fewest number of slides, the fewest number of photos, the fewest words per slide, the least cluttered slides and the most white space on your slides. This is the most violated slide rule, but it is the secret to success. Take a look at these examples.

As you can see in the above example, you don’t need fancy backgrounds or extra words to convey a simple concept. If you take “Everything you need to know about Turtles”, and delete “everything you need to know about” leaving just “turtles”, the slide has become much easier for your audience to read, and tells the story with economy.

The above example demonstrates that a single image that fills the entire screen is far more powerful than a slide cluttered with images. A slide with too many images may be detrimental to your presentation. The audience will spend more mental energy trying to sort through the clutter than listening to your presentation. If you need multiple images, then put each one on its own slide. Make each image high-resolution and have it fill the entire screen. If the photos are not the same dimensions as the screen, put them on a black background. Don’t use other colors, especially white.

Your slides will be much more effective if you use the fewest words, characters, and pictures needed to tell your story. Long paragraphs make the audience strain to read them, which means they are not paying attention to you. Your audience may even get stressed if you move on to your next slide before they’ve finished reading your paragraph. The best way to make sure the attention stays on you is to limit word count to no more than 10 words per slide. As presentation expert Nancy Duarte says “any slide with more than 10 words is a document.” If you really do need a longer explanation of something, handouts or follow-up emails are the way to go.
Following a “less is more” approach is one of the simplest things you can do to improve your presentation visuals and the impact of your presentation overall. Make sure your visuals add to your presentation rather than distract from it and get your message across.
Ready to learn more about how to make your presentation even better? Get TED Masterclass and develop your ideas into TED-style talks.
© 2024 TED Conferences, LLC. All rights reserved. Please note that the TED Talks Usage policy does not apply to this content and is not subject to our creative commons license.
9 Ways to Turn Text-Heavy Slides into Stunning Visual Presentation
Let’s assume a scenario where you are asked to prepare and deliver a presentation on a crucial topic related to your business. And, you go the extra mile to leave no stone unturned in preparing an information-rich PPT. You put forth the greatest possible effort in structuring and organizing the content and improving the aesthetics of the presentation. Despite a tough grind, you end up with a disastrous presentation! Down in the dumps?
If you don’t want this scenario to come true, ensure that you have not made your slides a dump yard of text for the sake of sharing a lot of information with the audience in a short amount of time. If you present with slides loaded with text, the audience will pay more attention to reading the content instead of focussing on what you’re saying. Moreover, it will make it difficult for viewers to understand the information.
So, here we have provided some tips to convert your text-heavy slides into visually impressive, meaningful slides. Read on!
1. convert data tables into graphs or charts.

Illustrating the data related to market share, revenue generation from different regions/business units, business/market trends, comparison of data within one set or different sets, etc., through a table won’t make much impact. However, presenting the same information through diagrams & charts, and graphs will not only add a visual appeal but will also make it look organized and structured.
Useful Template: Diagrams & Charts
2. Showcase Processes through Diagrams

Instead of writing each step of a process in detail in your presentation, you can use diagrams to depict it beautifully and make it easy to understand for the audience.
- For showcasing linear processes, you can use process diagrams depicting each step in a separate box and direction of flow through arrows. You can write brief content in the boxes to explain each step.
- You can use cycle diagrams to illustrate cyclical processes.
- Multi-staged processes can be showcased through stage diagrams.
- The main process and its sub-processes can be better portrayed through tree diagrams.
Useful Template: Process Diagrams
3. Display Mission, Vision, Achievements, and Other Key Information through Infographics

If you want the audience to retain crucial information for a longer time, represent it through infographics. It will help you build an emotional connection with them.
- For describing people of the team or management team of the organization, success journey, customer services and feedback, etc., you can use silhouettes and slideman infographics.
- Icons are the best way to demonstrate more information with less text.
4. Convert Long Paragraphs into Bullets

Break long paragraphs into small, readable, and understandable bullet points. You can use graphical bullets, such as arrow bullets and circle bullet points, instead of traditional ones for creating a long-lasting impression on the minds of the audience. Further, bullet points make it easy for the audience to scan and interpret the information quickly. As a rule of thumb, there should not be more than 6 bullet points on a slide and not more than 6 words in any bullet point.
5. Present Location-Specific Information through Maps

The location-specific business information, such as headquarters and branches of office in various regions of a country, areas with the highest customer base and market share, business expansion plans in new markets, revenue generation from different sales territories, etc., can be better explained through maps instead of plain text.
6. Represent Relationships Using Different Shapes

Consider using different shapes to depict relationships between various data, stages, and processes. For instance, use Venn diagrams to illustrate overlapping relationships, arrows to represent sequential relationships, flowcharts to portray logical relationships, pyramids to demonstrate hierarchical relationships, etc.
Useful Template: Shapes
7. Demonstrate Strategies and Tasks with Striking Visuals

The information about the history of an event or company, goals to be achieved, tasks and milestones of a project with their deadlines, etc., can be depicted with the minimal text through timelines.
Furthermore, the strategies to accomplish the set goals, hurdles and challenges in achieving a milestone, and other such information can be represented using roadmaps .
8. Move Text into the Speaker Notes
Sometimes, speakers add content for their own cues (which are actually not meant to be read by the audience), thus making the slides packed with text. This is not a good practice.
You can remove all the unnecessary data and information from the slides and put them in the Speaker Notes section at the bottom of each PowerPoint slide. It will let you not miss any important point while delivering the presentation. At the same time, it will help the audience focus on the relevant information on the slide.
9. Remove the Text that is Not Relevant to the Core Message
To make your slides crisp and concise, remove all the information that doesn’t add value to the core message. Include only those points that support the goal of your presentation and are absolutely required to make your audience understand the concept .
Hope you find this blog post helpful. We would like to know more tips from you. So, share your thoughts with us in the “Comment” section and share the post on Facebook and Twitter.
Leave a Response Cancel reply
Save my name, email, and website in this browser for the next time I comment.
Please enter an answer in digits: nineteen + four =

Ashish Arora
You might also like.

12 Ways to Make an Engaging Slide Deck and Captivate Your Audience

A Complete Guide to Writing a Clear and Concise Problem Statement

Dashboard Presentations: Data Visualization Made Simpler

How to Make a SIPOC Diagram for Presentations?

Engage your audience with powerful visual presentations.
Visual tools are critical to have in any presentation as they’re one of the key presentation aids that will help enhance your overall presentation .
We’ll give you tips on how to develop a sense of good presentation design whether you’re using PowerPoint, Prezi, Google Slides or any presentation software under the sun. The secret to creating a great presentation does not lie in a superior software, but understanding a few universal design concepts that can applied for all types of visual presentations.
Don’t be afraid to use a few presentation templates – there are ways to make the presentation ideas in those templates your own ideas and advance it in several different ways. Let’s make your next presentation on point and designed beautifully.
Presentations Are The Visual Communication Tool To Your Story

In the age of information, people remember facts faster through stories. Keep your bullet points and information short. You can use a rule of thumb to not put more than a paragraph and 3 points per slide to start.
Make your presentation the visual component of your story, but not something your audience has to read. Something that is short and succinct on screen will capture your audience’s attention and make sure they retain the main points of your message.
This does not mean incomplete slides. A common mistake presenters make is putting too little information on a slide in the name of simplicity when in fact they’re leaving out the main context.
A well designed visual presentation has a great story behind it and a well rehearsed voice telling it as well. Engaging the audience is also a great way to associate meaning or connection to the content of your slide decks. Ask questions and tell stories while showing off a great visual presentation! Think of writing the copy like writing for social media – you only have a certain amount of characters to use and a short audience attention span.
General Tips For Visual Presentations
Before you begin creating your presentation, you first need to know what makes effective presentations – storytelling. Such presentations target the audience’s emotions leading to a stronger connection to the audience member and the main point of the presentation.
Below are some storytelling tips for your slides, but remember to keep the presentation itself simple and practice makes perfect. And again, these are more for your spoken component that accompanies the visual component. These tips can be useful because they can be applied to all your presentations in general.
Step 1 is to ask yourself who your audience is and how to convey the key message you have in mind to them. Once you settle on your message, you can start designing your slides with that direction in mind.
You may wonder how to connect with an audience with your slides. Look to your own experiences, your own speaking style and tailor your message to what you know. Not many people want to hear others recite facts with no real meaning driving the story. Ask yourself, “Why does this matter to the audience and why should they care?”.
There is a lot of trust that can be built when the audience has a genuine connection to the presenter. Overall, if you have something that can solve a problem or teach someone complex things, that is enough to form a connection with your audience.
Think of the last app you used, the last email you read or perhaps the last business you purchased from. What was the content or visual elements that pulled you in?
Are you making a PowerPoint, Prezi or other form of visual presentation but it’s taking too much of your time? Enlist the help of Presentation Geeks and consider outsourcing your presentation design . Outsourcing your presentation slides allows you to free more of your time while still getting the results of an interesting presentation. You’ll have the support of expert slide designers who know what presentation visuals work and don’t work thanks to years of presentation feedback and background knowledge.
Color Design Tips For Presentation Slides
When designing your presentation, make sure you take into consideration the colors you’re using. We’ve listed a few background color combinations you might want to consider when developing the overall slide deck and the font to use.
Color Wheel Alignments:
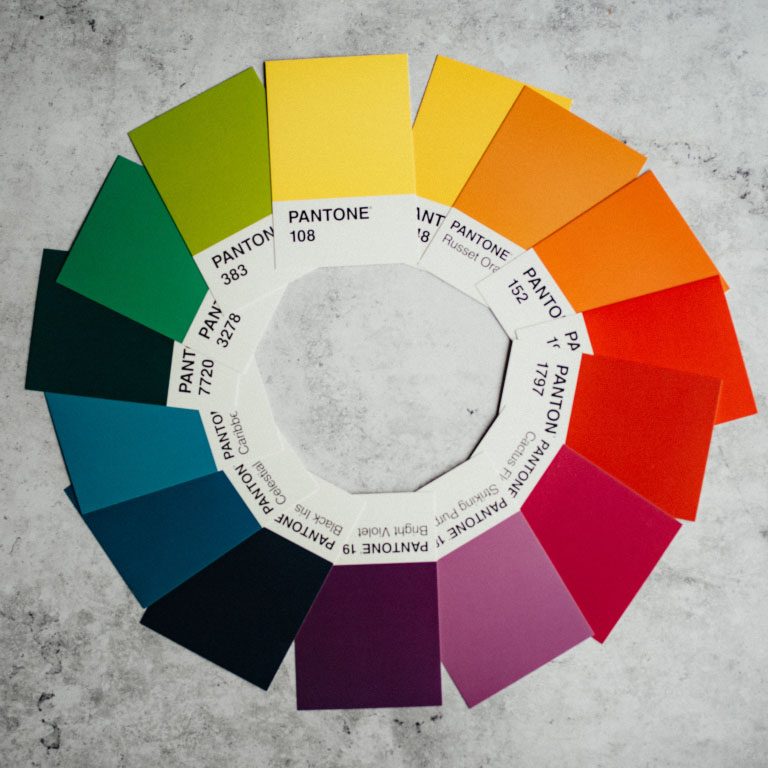
Primary Colors: Red, yellow, blue
Secondary Colors: Green, orange, purple
Tertiary Colors: Yellow-orange, red-orange, red-purple, blue-purple, blue-green & yellow-green
Analogous Colors: These are any three colors which are side by side on a color wheel. (Think green, lime green, yellow)
Complementary Colors: These are colors that are directly opposite of a color wheel. (Think green vs. purple, red vs. blue)
Monochromatic Colors: This is when you use one color and various shades or hues of it. It works well for minimal looks.
Color moods:
Red/Orange/Yellow: Generally these convey a sense of energy, are warm colors and catch your attention. Yellow is a happy warm color on one end and red is very striking and can warn of danger, and symbolizes importance, passion and sometimes violence.
Blue/Purple/Green: These colors are calming, reserved, elegant and often used for corporate slides. Think of how indigo blue is used for many large corporate entities. Green often is branded with earth or medical brands. Purple often conveys a sense of royalty, money and creativity.
Use The Power Of Photography Or Video

Pictures and videos are great visuals to incorporate into any presentation. Remember the saying, “A picture is worth a thousand words”? Well, it’s true! Photos help visualize complex information. You’ll often come across a lot of photos in research presentations as they help the audience understand examples better.
They can also save you from having to put a thousand thoughts into the PowerPoint presentation slide!
The first tip we can give to make a great visual presentation is to choose all your photos before you start. This way you can keep the consistency of the images across your slide deck and make sure they’re somewhat alike in terms of composition, mood and brand.
Use free stock photos
You don’t have to take the photos or videos yourself.
There are plenty of free resources and web pages for stock photos online – Unsplash , Pexels , Pixabay , Free Range , Creative Commons and some photos from Freepik are free to use with some accreditation.
Effective photo use
Make sure you pick an image that will focus on the main theme of the slide. One image is usually enough if the image choice is very relevant to the slide. If you have multiple photos, avoid poor or loose placement of photos all over the slide. Try to use a grid or gallery placement and it will immediately enhance the layout of the slide.
If you pick great images, making presentations can be faster. Instead of having to create an elaborate template with multiple elements, a photo with a couple of bullet points can go a long way in terms of capturing attention and making your presentation slides look professional. This is true on any presentation design platform – whether its PowerPoint, Google Slides, etc.

You can also embed videos whether they’re located on your computer, YouTube, Vimeo or other major video streaming sites. If you’re feeling nervous about your presentation or have a complex message that would be hard to condense in one slide, a video is a dynamic way of conveying your message in any type of presentation.
The Typography You Use Matters
Typography is how you will arrange and present the words in your presentation. An audience can engage when text is readable, functional and works well with the other elements in the presentation. Fonts and sizing are a good place to start establishing the tone of your presentation.
Overview of Font Choices
Elegant fonts often denote a sense of luxury or lifestyle tone. Use script fonts sparingly, but as titles they immediately give this polished and high-end look. This should not be used as body text or something lengthy to read. Think about if you sent an email in that text – it would be tedious to read. However, maybe if it were a title or a way to name email, the choice may be more correct.
Corporate fonts often are traditional, serif fonts or clean sans serif fonts that evoke a sense of trust and a clear message. Think of the fonts Lato, Helvetica or Arial – they’re go-to fonts that are easy to read, and work across many systems. This is especially helpful if you are working across teams when creating content or having to approve the content, idea or visuals.
Of course, you can incorporate more stylistic or playful fonts if you want to give your presentation a personal feel. Much like the scripted font, when used sparingly but in large titles, this choice of font can be very effective at conveying a certain personality.
Adding Symbols & Icons To Your Presentation

You can consolidate information by using symbols or icons to direct your eye to information such as an arrow symbol. What if you used a symbol instead of a bullet point? Think of symbols as anchors for the eye to quickly find information. You can collect symbols off free stock sites or use the built-in ones in PowerPoint that are free to use!
Depending on if your presentation is formal or informal , you may also want to consider adding emojis! Emojis are fun ways to express different emotions and can help connect with a younger demographic.
Overall Branding, Tone of Voice & Consistency
Another tool you may have at your disposal is if your brand, business or company has brand guidelines. It will be the guide and compass to your presentation’s information that goes within it. By keeping consistent you can achieve a polished look even if it looks very simple.
Use your business voice to communicate ideas and set the tone for your presentation. Are you in an investment banking business and want people to rely on the information given to you? That would inform perhaps using blues and purples, which are calmer colors and a cleaner look. Are you an influencer who’s buying power and spending choices matter to your audience? Maybe choosing bright colors with personal touches will make the connection. Are you designing an innovative app? Maybe more interactive slides would do the trick.
Use these questions to make sure your text and tone is consistent as this is a foundation of a well articulated brand or personal identity.
Consistent Hierarchy
Visual hierarchy is how you will arrange objects and text in relation to one another to guide your user and not confuse the objects and how they should read them in your slides. Setting rules helps differentiate and prioritize what’s important in order.
Look at the difference between these two.
Snoop Dogg just launched a wine and it’s coming to Canada
Daily hive branded content | aug 11 2020, 6:30 am.
Australian winery 19 Crimes recently announced that its new Cali Red wine, created in collaboration with Entertainment Icon, entrepreneur, and hip-hop artist Snoop Dogg, will be hitting shelves across Canada later this summer.
The collaboration offers a refreshing take on celebrity partnerships as the apparent shared values and history between the brand and famous rapper make for a perfectly organic pairing.
Comment Name:
By browsing the site, you agree to the use of cookies on this website. see our user agreement for the use of cookies..
You can see a clear distinction in the example below:
Think of hierarchy of a form of narration or story structure. Your eye goes to the title, then to the subtitle, then to the body copy in a logical manner. Where the eye travels is one of those things we don’t think about often. But you can also utilize eye lines in photos. Is your subject in the photo looking left or right? Consider placing text to where your subject is looking and see how effectively your eye travels to that text.
We’ll look at hierarchy strictly as sizing of words for now, but note you can establish hierarchy with type, white space, alignment, etc. As a general rule of thumb, you should have consistent sizing for your Header (or title slide / slide title), your subtitles and your body text. That’s it! If the sizing in your PowerPoint is consistent, your words will look uniform and clean. Everything will be much easier to read and the eye will be trained to move each slide.
Don’t Forget Your Own Style
Also don’t forget to incorporate your own style and what kind of visuals you like. Even if your early visuals may seem simple, build up that design muscle with the basics and design techniques that look clean and consistent.
You’ll find as you design these basics, you’ll probably start noticing other visuals and things you like in other mediums and presentations. Keep a note or screenshot the presentation that inspired you. Create a mood-board that you can refer to in the future for quick idea inspiration. Copying gets a bad rap, but learning how to design something you like even if it’s a clone copy will teach you many things about design. Build a collection of images that informs everything you do: for your color scheme, your designs, the cadence of images, etc.
That being said, you can also use free stock websites like Freepik for some design layouts inspiration. Creative Market is a paid website but the site offers a ton of design inspiration. This site has design templates for what’s currently in and trending. You can subscribe to an email newsletter on either site to get bite sized design influence each day that goes straight to your inbox.
However, don’t be afraid to try something new!
Once you get to a level of comfortable designing, these new ideas will be much easier to execute with the technical knowledge you amassed when you started. You could even try using a new app to design your ideas to keep your knowledge fresh! (Keep in mind that most online apps like SlideShare use cookies to improve functionality and performance.)
Ask your friends or people at your organization to give you feedback and critique, as that’s also crucial to honing your design skills. The people around you also represent different audiences!

The above image looks boring, right?
That’s because there are no visual elements!
Powerful visual presentations can engage audiences psychologically with both the presentation itself and the energy of the presenter. By understanding a few universal design concepts, you can begin your journey creating wonderful visual presentations and becoming a better presenter ! Thanks for reading this blog post, tell us your tips in the comments below.

Author: Content Team
Related posts.

FREE PROFESSIONAL RESOURCES DELIVERED TO YOUR INBOX.
Subscribe for free tips, resources, templates, ideas and more from our professional team of presentation designers.

Want to create or adapt books like this? Learn more about how Pressbooks supports open publishing practices.
14.1 Organizing a Visual Presentation
Learning objectives.
- Identify key ideas and details to create a concise, engaging presentation.
- Identify the steps involved in planning a comprehensive presentation.
Until now, you have interacted with your audience of readers indirectly, on the page. You have tried to anticipate their reactions and questions as all good writers do. Anticipating the audience’s needs can be tough, especially when you are sitting alone in front of your computer.
When you give a presentation, you connect directly with your audience. For most people, making a presentation is both exciting and stressful. The excitement comes from engaging in a two-way interaction about your ideas. The stress comes from the pressure of presenting your ideas without having a delete button to undo mistakes. Outside the classroom, you may be asked to give a presentation, often at the last minute, and the show must go on. Presentations can be stressful, but planning and preparation, when the time and opportunity are available, can make all the difference.
This chapter covers how to plan and deliver an effective, engaging presentation. By planning carefully, applying some time-honored presentation strategies, and practicing, you can make sure that your presentation comes across as confident, knowledgeable, and interesting—and that your audience actually learns from it. The specific tasks involved in creating a presentation may vary slightly depending on your purpose and your assignment. However, these are the general steps.
Follow these steps to create a presentation based on your ideas:
- Determine your purpose and identify the key ideas to present.
- Organize your ideas in an outline.
- Identify opportunities to incorporate visual or audio media, and create or locate these media aids.
- Rehearse your presentation in advance.
- Deliver your presentation to your audience.
Getting Started: Identifying and Organizing Key Ideas
To deliver a successful presentation, you need to develop content suitable for an effective presentation. Your ideas make up your presentation, but to deliver them effectively, you will need to identify key ideas and organize them carefully. Read the following considerations, which will help you first identify and then organize key ideas:
- Be concise. You will include the most important ideas and leave out others. Some concepts may need to be simplified.
- Employ more than one medium of expression. You should incorporate other media, such as charts, graphs, photographs, video or audio recordings, or websites.
- Prepare for a face-to-face presentation. If you must deliver a face-to-face presentation, it is important to project yourself as a serious and well-informed speaker. You will often speak extemporaneously, or in a rehearsed but not memorized manner, which allows for flexibility given the context or audience. You will need to know your points and keep your audience engaged.
Determine Your Purpose
As with a writing assignment, determining the purpose of your presentation early on is crucial. You want to inform your readers about the topic, but think about what else you hope to achieve.
Are you presenting information intended to move your audience to adopt certain beliefs or take action on a particular issue? If so, you are speaking not only to inform but also to persuade your listeners. Do you want your audience to come away from your presentation knowing how to do something they that they did not know before? In that case, you are not only informing them but also explaining or teaching a process.
Writing at Work
Schoolteachers are trained to structure lessons around one or more lesson objectives. Usually the objective, the mission or purpose, states what students should know or be able to do after they complete the lesson. For example, an objective might state, “Students will understand the specific freedoms guaranteed by the First Amendment” or “Students will be able to add two three-digit numbers correctly.”
As a manager, mentor, or supervisor, you may sometimes be required to teach or train other employees as part of your job. Determining the desired outcome of a training session will help you plan effectively. Identify your teaching objectives. What, specifically, do you want your audience to know (for instance, details of a new workplace policy) or be able to do (for instance, use a new software program)? Plan your teaching or training session to meet your objectives.
Identify Key Ideas
To plan your presentation, think in terms of three or four key points you want to get across. In a paper, you have the space to develop ideas at length and delve into complex details. In a presentation, however, you must convey your ideas more concisely.
One strategy you might try is to create an outline. What is your main idea? Would your main idea work well as key points for a brief presentation? How would you condense topics that might be too lengthy, or should you eliminate topics that may be too complicated to address in your presentation?
1. Revisit your presentation assignment, or think of a topic for your presentation. On your own sheet of notebook paper, write a list of at least three to five key ideas. Keep the following questions in mind when listing your key ideas:
- What is your purpose?
- Who is your audience?
- How will you engage your audience?
2. On the same paper, identify the steps you must complete before you begin creating your presentation.
Use an Outline to Organize Ideas
After you determine which ideas are most appropriate for your presentation, you will create an outline of those ideas. Your presentation, like a written assignment, should include an introduction, body, and conclusion. These components serve much the same purpose as they do in a written assignment.
- The introduction engages the audience’s attention, introduces the topic, and sets the tone for what is to come.
- The body develops your point of view with supporting ideas, details, and examples presented in a logical order.
- The conclusion restates your point of view, sums up your main points, and leaves your audience with something to think about.
Jorge, who wrote the research paper featured in Chapter 11 “Writing from Research: What Will I Learn?” , developed the following outline. Jorge relied heavily on this outline to plan his presentation, but he adjusted it to suit the new format.

Planning Your Introduction
In Chapter 12 “Writing a Research Paper” , you learned techniques for writing an interesting introduction, such as beginning with a surprising fact or statistic, a thought-provoking question or quotation, a brief anecdote that illustrates a larger concept or connects your topic to your audience’s experiences. You can use these techniques effectively in presentations as well. You might also consider actively engaging your audience by having members respond to questions or complete a brief activity related to your topic. For example, you may have your audience respond to a survey or tell about an experience related to your topic.
Incorporating media can also be an effective way to get your audience’s attention. Visual images such as a photograph or a cartoon can invoke an immediate emotional response. A graph or chart can highlight startling findings in research data or statistical information. Brief video or audio clips that clearly reinforce your message and do not distract or overwhelm your audience can provide a sense of immediacy when you plan to discuss an event or a current issue. A PowerPoint presentation allows you to integrate many of these different media sources into one presentation.
With the accessibility provided by the Internet, you can find interesting and appropriate audio and video with little difficulty. However, the clip alone will not sustain the presentation. To keep the audience interested and engaged, you must frame the beginning and end of the clip with your own words.
Jorge completed the introduction part of his outline by listing the key points he would use to open his presentation. He also planned to show various web links early on to illustrate the popularity of the low-carbohydrate diet trend.

Planning the Body of Your Presentation
The next step is to work with the key ideas you identified earlier. Determine the order in which you want to present these ideas, and flesh them out with important details. Chapter 10 “Rhetorical Modes” discusses several organizational structures you might work with, such as chronological order, comparison-and-contrast structure, or cause-and-effect structure.
How much detail you include will depend on the time allotted for your presentation. Your instructor will most likely give you a specific time limit or a specific slide limit, such as eight to ten slides. If the time limit is very brief (two to three minutes, for instance), you will need to focus on communicating your point of view, main supporting points, and only the most relevant details. Three minutes can feel like an eternity if you are speaking before a group, but the time will pass very quickly. It is important to use it well.
If you have more time to work with—ten minutes or half an hour—you will be able to discuss your topic in greater detail. More time also means you must devote more thought into how you will hold your audience’s interest. If your presentation is longer than five minutes, introduce some variety so the audience is not bored. Incorporate multimedia, invite the audience to complete an activity, or set aside time for a question-and-answer session.
Jorge was required to limit his presentation to five to seven minutes. In his outline, he made a note about where he would need to condense some complicated material to stay within his time limit. He also decided to focus only on cholesterol and heart disease in his discussion of long-term health outcomes. The research on other issues was inconclusive, so Jorge decided to omit this material. Jorge’s notes on his outline show the revisions he has made to his presentation.

You are responsible for using your presentation time effectively to inform your audience. You show respect for your audience by following the expected time limit. However, that does not mean you must fill all of that time with talk if you are giving a face-to-face presentation. Involving your audience can take some of the pressure off you while also keeping them engaged. Have them respond to a few brief questions to get them thinking. Display a relevant photograph, document, or object and ask your classmates to comment. In some presentations, if time allows, you may choose to have your classmates complete an individual or group activity.
Planning Your Conclusion
The conclusion should briefly sum up your main idea and leave your audience with something to think about. As in a written paper, you are essentially revisiting your thesis. Depending on your topic, you may also ask the audience to reconsider their thinking about an issue, to take action, or to think about a related issue. If you presented an attention-getting fact or anecdote in your introduction, consider revisiting it in your conclusion. Just as you have learned about an essay’s conclusion, do not add new content to the presentation’s conclusion.
No matter how you choose to structure your conclusion, make sure it is well planned so that you are not tempted to wrap up your presentation too quickly. Inexperienced speakers, in a face-to-face presentation, sometimes rush through the end of a presentation to avoid exceeding the allotted time or to end the stressful experience of presenting in public. Unfortunately, a hurried conclusion makes the presentation as a whole less memorable.
Time management is the key to delivering an effective presentation whether it is face-to-face or in PowerPoint. As you develop your outline, think about the amount of time you will devote to each section. For instance, in a five-minute face-to-face presentation, you might plan to spend one minute on the introduction, three minutes on the body, and one minute on the conclusion. Later, when you rehearse, you can time yourself to determine whether you need to adjust your content or delivery.
In a PowerPoint presentation, it is important that your presentation is visually stimulating, avoids information overload by limiting the text per slide, uses speaker notes effectively, and uses a font that is visible on the background (e.g., avoid white letters on a light background or black letters on a dark background).
Work with the list you created in Note 14.4 “Exercise 1” to develop a more complete outline for your presentation. Make sure your outline includes the following:
- An introduction that uses strategies to capture your audience’s attention
- A body section that summarizes your main points and supporting details
- A conclusion that will help you end on a memorable note
- Brief notes about how much time you plan to spend on each part of the presentation (you may adjust the timing later as needed)
Identifying Opportunities to Incorporate Visual and Audio Media
You may already have some ideas for how to incorporate visual and audio media in your presentation. If not, review your outline and begin thinking about where to include media. Presenting information in a variety of formats will help you keep your audience’s interest.
Use Presentation Software
Delivering your presentation as a slideshow is one way to use media to your advantage. As you speak, you use a computer and an attached projector to display a slideshow of text and graphics that complement the speech. Your audience will follow your ideas more easily, because you are communicating with them through more than one sense. The audience hears your words and also sees the corresponding visuals. A listener who momentarily loses track of what you are saying can rely on the slide to cue his or her memory.
To set up your presentation, you will need to work with the content of your outline to develop individual slides. Each slide should focus on just a few bullet points (or a similar amount of content presented in a graphic). Remember that your audience must be able to read the slides easily, whether the members sit in the front or the back of the room. Avoid overcrowding the slides with too much text.
Using presentation software, such as PowerPoint, allows you to incorporate graphics, sounds, and even web links directly into your slides. You can also work with available styles, color schemes, and fonts to give your presentation a polished, consistent appearance. Different slide templates make it easy to organize information to suit your purpose. Be sure your font is visible to you audience. Avoid using small font or colored font that is not visible against your background.
Use PowerPoint as a Visual Aid
PowerPoint and similar visual representation programs can be effective tools to help audiences remember your message, but they can also be an annoying distraction to your speech. How you prepare your slides and use the tool will determine your effectiveness.
PowerPoint is a slideware program that you have no doubt seen used in class, seen in a presentation at work, or perhaps used yourself to support a presentation. PowerPoint and similar slideware programs provide templates for creating electronic slides to present visual information to the audience, reinforcing the verbal message. You will be able to import or cut and paste words from text files, images, or video clips to create slides to represent your ideas. You can even incorporate web links. When using any software program, it is always a good idea to experiment with it long before you intend to use it; explore its many options and functions, and see how it can be an effective tool for you.
At first, you might be overwhelmed by the possibilities, and you might be tempted to use all the bells, whistles, and sound effects, not to mention the tumbling, flying, and animated graphics. If used wisely, a dissolve or key transition can be like a well-executed scene from a major motion picture and lead your audience to the next point. But if used indiscriminately, it can annoy the audience to the point where they cringe in anticipation of the sound effect at the start of each slide. This danger is inherent in the tool, but you are in charge of it and can make wise choices that enhance the understanding and retention of your information.
The first point to consider is which visual aid is the most important. The answer is you, the speaker. You will facilitate the discussion, give life to the information, and help the audience correlate the content to your goal or purpose. You do not want to be in a position where the PowerPoint presentation is the focus and you are on the side of the stage simply helping the audience follow along. Slides should support you in your presentation, rather than the other way around. Just as there is a number one rule for handouts (do not pass them out at the start of your presentation), there is also one for PowerPoint presentations: do not use PowerPoint slides as a read-aloud script for your speech. The PowerPoint slides should amplify and illustrate your main points, not reproduce everything you are going to say.
Your pictures are the second area of emphasis you will want to consider. The tool will allow you to show graphs, charts and illustrate relationships that words may only approach in terms of communication, but your verbal support of the visual images will make all the difference. Dense pictures or complicated graphics will confuse more than they clarify. Choose clear images that have an immediate connection to both your content and the audience, tailored to their specific needs. After the images, consider using only key words that can be easily read to accompany your pictures. The fewer words the better. Try to keep each slide to a total word count of less than ten words. Do not use full sentences. Using key words provides support for your verbal discussion, guiding you as well as your audience. The key words can serve as signposts or signal words related to key ideas.
A natural question at this point is, How do I communicate complex information simply? The answer comes with several options. The visual representation on the screen is for support and illustration. Should you need to communicate more technical, complex, or in-depth information in a visual way, consider preparing a handout to distribute at the conclusion of your speech. You may also consider using a printout of your slide show with a section for taking notes, but if you distribute it at the beginning of your speech, you run the risk of turning your presentation into a guided reading exercise and possibly distracting or losing members of the audience. Everyone reads at a different pace and takes notes in their own way. You do not want to be in the position of going back and forth between slides to help people follow along.
Another point to consider is how you want to use the tool to support your speech and how your audience will interpret its presentation. Most audiences wouldn’t want to read a page of text—as you might see in this book—on the big screen. They will be far more likely to glance at the screen and assess the information you present in relation to your discussion. Therefore, it is key to consider one main idea, relationship, or point per slide. The use of the tool should be guided with the idea that its presentation is for the audience’s benefit, not yours. People often understand pictures and images more quickly and easily than text, and you can use this to your advantage, using the knowledge that a picture is worth a thousand words.
Incorporate Visual Media
Even if you do not use a slideshow to complement your presentation, you can include visual media to support and enhance your content. Visual media are divided into two major categories: images and informational graphics.
Image-based media, such as photographs or videos, often have little or no accompanying text. Often these media are more powerful than words in getting a message across. Within the past decade, the images associated with major news stories, such as the Indian Ocean tsunami of 2004, the Abu Ghraib prison abuses from 2004 to 2006, and the 2010 earthquake in Haiti, have powerfully affected viewers’ emotions and drawn their attention to these news stories.
Figure 14.1

Even if your presentation addresses a less dramatic subject, you can still use images to draw in your audience. Consider how photographs, an illustration, or a video might help your audience connect with a particular person or place or bring a historical event to life. Use visual images to support descriptions of natural or man-made phenomena. What ideas lend themselves to being explained primarily through images?
In addition, consider how you might incorporate informational graphics in your presentation. Informational graphics include diagrams, tables, pie charts, bar and line graphs, and flow charts. Informational graphics usually include some text and often work well to present numerical information. Consider using them if you are presenting statistics, comparing facts or data about several different groups, describing changes over time, or presenting a process.
Incorporate Audio Media
Although audio media are not as versatile as visual media, you may wish to use them if they work well with your particular topic. If your presentation discusses trends in pop music or analyzes political speeches, playing an audio clip is an obvious and effective choice. Clips from historical speeches, radio talk shows, and interviews can also be used, but extended clips may be ineffective with modern audiences. Always assess your audience’s demographics and expectations before selecting and including audio media.
Review the outline you created in Note 14.11 “Exercise 2” . Complete the following steps:
- Identify at least two to three places in your presentation where you might incorporate visual or audio media. Brainstorm ideas for what media would be effective, and create a list of ideas. (In Chapter 14 “Creating Presentations: Sharing Your Ideas” , Section 14.2 “Incorporating Effective Visuals into a Presentation” , you will explore different media options in greater depth. For now, focus on coming up with a few general ideas.)
- Determine whether you will use presentation software to deliver your presentation as a slideshow. If you plan to do so, begin using your outline to draft your slides.
Figure 14.2

Source: http://www.agenciabrasil.gov.br/media/imagens/2010/01/14/14.01.10RP5978.jpg/view
Planning Ahead: Annotating Your Presentation
When you make a presentation, you are giving a performance of sorts. It may not be as dramatic as a play or a movie, but it requires smooth coordination of several elements—your words, your gestures, and any media you include. One way to ensure that the performance goes smoothly is to annotate your presentation ahead of time.
To annotate means to add comments or notes to a document. You can use this technique to plan how the different parts of your presentation will flow together. For instance, if you are working with slides, add notes to your outline indicating when you will show each slide. If you have other visual or audio media to include, make a note of that, too. Be as detailed as necessary. Jotting “Start video at 3:14” can spare you the awkwardness of searching for the right clip during your presentation.
In the workplace, employees are often asked to deliver presentations or conduct a meeting using standard office presentation software. If you are using presentation software, you can annotate your presentation easily as you create your slides. Use the notes feature at the bottom of the page to add notes for each slide. As you deliver your presentation, your notes will be visible to you on the computer screen but not to your audience on the projector screen.
In a face-to-face presentation, make sure your final annotated outline is easy to read. It will serve to cue you during your presentation, so it does not need to look polished, as long as it is clear to you. Double space the text. Use a larger-than-normal font size (14 or 16 points) if that will make it easier for you to read. Boldface or italics will set off text that should be emphasized or delivered with greater emotion. Write out main points, as well as your opening and closing remarks, in complete sentences, along with any material you want to quote verbatim. Use shorter phrases for supporting details. Using your speaker notes effectively will help you deliver an effective presentation. Highlighting, all capital letters, or different-colored font will help you easily distinguish notes from the text of your speech. Read Jorge’s annotated outline.

Some students prefer to write out the full text of their face-to-face presentation. This can be a useful strategy when you are practicing your delivery. However, keep in mind that reading your text aloud, word for word, will not help you capture and hold your audience’s attention. Write out and read your speech if that helps you rehearse. After a few practice sessions, when you are more comfortable with your material, switch to working from an outline. That will help you sound more natural when you speak to an audience.
In a PowerPoint presentation, remember to have your slides in logical sequential order. Annotating your presentation before submitting it to your audience or your instructor will help you check for order and logical transitions. Too much text or data may confuse your audience; strive for clarity and avoid unnecessary details. Let the pictures or graphics tell the story but do not overload your slideshow with visuals. Be sure your font is visible. Look for consistency in the time limit of your presentation to gauge your level of preparedness.
Begin to annotate your outline. (You will probably add more notes as you proceed, but including some annotations now will help you begin pulling your ideas together.) Mark your outline with the following information:
- Write notes in brackets to any sections where you definitely plan to incorporate visual or audio media.
- If you are presenting a slideshow, add notes in brackets indicating which slides go with each section of your outline.
- Identify and set off any text that should be emphasized.

Key Takeaways
- An effective presentation presents ideas more concisely than a written document and uses media to explain ideas and hold the audience’s interest.
- Like an essay, a presentation should have a clear beginning, middle, and end.
- Good writers structure their presentations on the thesis, or point of view; main ideas; and key supporting details and create a presentation outline to organize their ideas.
- Annotating a presentation outline is a useful way to coordinate different parts of the presentation and manage time effectively.
Writing for Success Copyright © 2015 by University of Minnesota Libraries Publishing is licensed under a Creative Commons Attribution-NonCommercial 4.0 International License , except where otherwise noted.
Share This Book
Encyclopedia
Writing with artificial intelligence, audiovisual presentations made easy(-ier): tips for creating an effective powerpoint, prezi, or keynote.
- CC BY-NC-ND 4.0 by E . Jonathan Arnett

At some point in your academic or professional life, you’ll have to stand in front of people and give a talk about a subject, and quite often, you’ll be asked to prepare visual materials to accompany your talk. You might prepare handouts, but odds are, you’ll be asked to prepare materials that you can project on a video screen.
The classic version of these projected materials is the overhead transparency, a thin sheet of clear plastic that you can run through a laser printer or write on with special markers; this medium is slowly disappearing, but it’s still around. Sometimes, you might be able to prepare paper documents and project them to a screen via a document camera, but doc cams aren’t entirely common, and they can only present static images. Instead, you’ll usually be asked to create a dynamic presentation using software such as PowerPoint, Prezi, or Keynote. Many other programs exist, including what Google has to offer, but these are the three most common presentation programs.
Each program has its own special abilities and strengths, but they all share common basic principles that you can manipulate to create memorable, effective, and interesting presentations. Here, you’ll learn basic principles to
- select an effective presentation format
- choose readable typefaces
- place visual elements onscreen
- choose colors
- select appropriate backgrounds
- choose visual and audio effects
- deliver a memorable, effective presentation
Three Major Presentation Formats
You can choose from three basic type of format for a presentation based on PowerPoint, Prezi, or Keynote:
- bullet points
- illustrated points
- speaker’s prop
The format you choose should fit your audience and your presentation’s subject.
Bullet Points. The bullet point format is the default layout that most PowerPoint users and viewers are familiar with. Slides created in this format commonly include a title across the top and a cascading series of bulleted lines of text inside a slide’s main text box. An example of this kind of slide appears below, in Figure 1.
Figure 1: PPT slide using bullet point format
Bullet point-format presentations have several benefits:
- They are easy to prepare. Just type, press Enter for a new line, and press Tab to create a smaller bullet or Shift+Tab to make a larger bullet.
- They are useful for highlighting important words or naming concepts that an audience needs to learn.
- They project a serious tone.
However, bullet-point format presentations also can be boring, and an overload of words will make your audience cringe. You have probably endured at least one bad PowerPoint in your life, and odds are, that bad presentation used the bullet point format.
Illustrated Points. The illustrated points format is similar, but slides created in this type of presentation focus on pictures, and text appears in a supporting role. An example of this kind of slide appears in Figure 2.

Figure 2: PPT slide using illustrated points format
Illustrated points-format slides have several benefits:
- They are excellent for showing conceptual relationships or demonstrating physical relationships between objects.
- People often respond positively to pictures, so illustrated points-format slides also tend to capture viewers’ interest more than all-text presentations do.
These slides require more detailed preparation, though, and they tend to be more visually “busy,” so if your audience has problems concentrating, or if it’s vital that you highlight important words, you may want a more text-based approach.
Illustrated points-format slides can also be combined with bullet point-format slides inside the same presentation. See Figure 3 for an example of a PowerPoint that includes both types of slide.

Figure 3: Combination of bullet points (top) and illustrated points (bottom) slides in one PowerPoint
Speaker’s Prop. The speaker’s prop format is similar to the illustrated points format, but a speaker’s prop almost entirely consists of simple pictures that flash onscreen in rapid sequence. Any text that appears is usually very short, uses a large font, and only appears for a moment.
A speaker’s prop is appropriate for abstract subjects (e.g, the nature of free will), and if it is done well, it can be fascinating and will engage an audience.
However, this type of presentation is often more complex and time-consuming to prepare than a presentation in the other formats, and you run the risk of making it so entertaining that the audience may remember the presentation but forget what you said.
A well-done example of a speaker’s prop presentation appears in this video:

Figure 4: Screen capture of speaker’s prop presentation
Whichever format you choose, remember that the presentation software is your servant; don’t let it tell you what to do. Always modify a template to suit your needs.
As an excellent example of what not to do, consider Peter Norvig’s classic Gettysburg PowerPoint: http://norvig.com/Gettysburg/ . It’s a satirical example of how an excellent speech—in this case, Abraham Lincoln’s famous Gettysburg Address, widely considered one of the classic speeches in the English language—can be ruined by using presentation software default settings and following a built-in template without modifying it.
How to Choose a Typeface
When you create a presentation, make sure that the fonts you choose are
- appropriate for the subject and audience
- readable from anywhere in the room
- compatible with the computer you’ll be using for the presentation
Appropriateness. Each typeface projects a visual “personality” of some sort, and you should match the font with the audience and subject you’re addressing. For example, Comic Sans is a cheerful, happy-looking font and projects a somewhat childlike ethos; it’s a good match for an upbeat subject for a younger audience. In contrast, Times New Roman is a much more serious-looking font and would be appropriate for an older audience discussing a serious subject.
Readability. Not all fonts are equally readable, and you need to pick typefaces that allow your audience to read what’s onscreen from the back of the room. You should choose fonts that
- have relatively tall lower-case letters
- don’t use extra-thick or extremely thin lines
- have large, open spaces inside the loops, and
- (for a serif font) have large, blunt serifs.
See Figure 5 for examples of typefaces available in PowerPoint, and consider which fonts are most and least readable onscreen.

Figure 5: Examples of readable and unreadable font choices
Of these twelve fonts, the fonts that are most readable onscreen are Tahoma, Georgia, Trebuchet, and Verdana. In fact, Georgia and Verdana were designed for use onscreen. Of the rest, only Book Antiqua is workable, but the letters’ thin parts can be hard to see onscreen, particularly if the background isn’t a single flat color.
Sans-serif fonts are usually easier to read onscreen than serif fonts are, so consider using a serif font for headings and a sans-serif font for slides’ main text. Also, limit yourself to two fonts. If you use more, the screen will look very busy, and the visual clutter may distract your audience.
Most programs have built-in lists of fonts that you can use. For example, PowerPoint 2013 includes the list of combinations that appears in Figure 6.

Figure 6: List of built-in font combinations in PowerPoint 2013
Here is a link to a brief YouTube video that demonstrates how to access PowerPoint’s built-in list of font combinations: https://www.dropbox.com/sh/812erramvb8lvjk/AADwNcH2rqBrl_FjJgcxL3gsa/PowerPoint%20built-in%20font%20combinations.mp4?dl=0 .
Feel free to use one of these combinations, but remember that just because they’re built-in doesn’t mean they’re well-chosen or appropriate for your needs. You should always consider changing the default settings.
Compatibility. Not every typeface is available on every operating system, so find out what kind of computer you’ll use while delivering the presentation and choose fonts that will work on that computer.
For example, Helvetica is available on Mac, but it is not available on Windows-based systems; the Windows equivalent to Helvetica is Arial. Thus, if you create a PowerPoint presentation on a PC and then open the file on a Mac, or vice versa, the fonts may not transfer over, and your PowerPoint’s appearance will change, often for the worse.
Here’s a link to a list of fonts shared by Mac and PC versions of Microsoft Office: .
How to Think about Layout
When you place text or pictures onscreen, make sure you
- apply the CRAP design principles
- avoid clutter
- avoid text overload
CRAP Principles. The CRAP design principles are Contrast, Repetition, Alignment, and Proximity. In brief, they work like this:
Contrast: If things aren’t in the same category, make them look very different (e.g., use different fonts for slide headings and main text).
Repetition: Make visual elements consistent throughout every slide (e.g., use consistent colors, callout shapes, font sizes, picture and text box locations, background images).
Alignment: Place things on the screen with a purpose. Don’t just plop images and text in random locations (e.g., equalize spaces between multiple pictures, consistently center or left-align text, line up bullets and numbers).
Proximity: Place related items close to each other (e.g., use a narrow space between a name and job title, a picture and its caption, a main bullet item and its related sub-bullet items).
(The CRAP acronym was invented by a graphic designer named Robin Williams [no, not that Robin Williams] and explained in her book The Non-Designer’s Design Book. If you’re interested in visual design, you might find it fascinating.)
When you design your PowerPoint, you should consider using the built-in Master Slide tool to make sure the visual design elements (e.g., fonts, colors, backgrounds, bulleted items’ alignment) follow the Repetition principle. Here is a link to a YouTube video demonstrating how this powerful function works:
Clutter. Keep your presentation’s design and contents relatively simple.
- Include spaces between lines of text.
- Include spaces between images or other visual elements.
- Make sure that the text is readable.
- Use simple graphics.
If you overload the screen, your audience will feel overwhelmed, and they won’t be able to follow your ideas.
For example, Figure 7 demonstrates a cluttered information graphic full of “chartjunk.” Its 3-D design is unnecessary, the forced perspective prevents the audience from seeing the towers’ actual heights, the callouts overlap, the towers’ transparency doesn’t provide any information for the viewer, and the beveled edges and shadows are distracting.

Figure 7: Cluttered infographic
Figure 8 shows the same data in a simple, clean infographic that an audience can follow.

Figure 8: Uncluttered infographic
Similarly, avoid stuffing slides full of text and creating a “wall o’ words” like in Figure 9. Too much text makes a slide difficult to read and will intimidate your audience.

Figure 9: Wall o’ Words
Try to limit a bullet point-format slide to no more than seven bullets, with relatively short entries under each bullet. Of course, you can actually use as many bullets as you want, but only if you follow the CRAP principles very well. (See Figure 10 for an example of a slide that contains ten bulleted points but is still readable.)

Figure 10: Almost but not quite a “wall o’ words”
How to Choose Good Colors
Black-on-white presentations are easy to read, but they’re often very stark-looking, and your audience may not wish to stare at a bright white screen. Thus, you probably will want to use color in your presentation, and you need to choose your presentation’s colors carefully.
Contrast. Pick colors with high luminance contrast—in other words, one color should be much brighter than the other—so that your viewers will be able to read text quickly and with minimal eyestrain. Avoid extremely high color contrast, though, because extremes in color contrast can make text very hard to read. See Figure 11 for examples.

Figure 11: Examples of color and luminance combinations
Similarly, you probably want to avoid pure white text on a black screen; it’s OK for special cases, but for an entire presentation, it’s overwhelming. See Figure 12.

Figure 12: White-on-black slide design
Emotional Impact. Also consider the emotional effect of colors that you choose. The “cool” colors (darker green, blue-green, light blue, dark blue, blue-violet, purple) are calm and soothing, while the “warm” colors (red-violet, red, red-orange, orange, yellow-orange, yellow, yellow-green) are stimulating. Choose colors that are appropriate for the subject and emotional impact of your presentation. See Figure 13 for an example.

Figure 13: Emotional effects of colors
How to Choose Appropriate Backgrounds
Always make your presentation’s background relate to its topic. PowerPoint, Prezi, and Keynote all allow you to choose from built-in or downloadable background “theme” templates; insert and customize solid colors, gradients, or patterns; or import your own image to use as a background for your presentation. You can use any of these options, but whatever option you choose, the background absolutely must mesh with the topic.
For example, if you are speaking about a computer-related subject, the “Organic” PowerPoint theme template would be a very poor choice. (See Figure 14.) It looks like a sheet of paper attached to a piece of wood by a ribbon, and its text uses a serif body font; there’s nothing about the template that suggests “computer technology.” The same theme template would look entirely appropriate for a food-related subject, though.

Figure 14: Inappropriate and appropriate backgrounds
Also, consider whether the audience has seen the background before. There are only so many built-in theme templates, and chances are that your audience has seen the same background used for a different presentation or has used that same template themselves. In fact, if an event features multiple speakers, sometimes more than one presenter will use the same template, and the audience may get confused and not remember who said what. It is always a good idea to import your own image as a background or to customize templates to fit your needs. See Figure 15 for an example.

Figure 15: Customized “Apex” template from MS PowerPoint 2010
This brief YouTube video demonstrates PowerPoint’s built-in slide designs and how to access and use its Format Background tool: https://www.dropbox.com/sh/812erramvb8lvjk/AADoikR7jSjHHObIwOKX1qCOa/PowerPoint%20built-in%20backgrounds.mp4?dl=0
(As noted in the “How to Think About Layout” section, it would be a good idea to use the Master Slide tool when you customize backgrounds in order to make all the slides look uniform.)
Visual and Audio Effects
You can and should use between-slides transitions, within-slide animations, and sound effects, but don’t go overboard. Instead, use subtle effects, use them sparingly, and only use them to support your points.
Visual Effects. Transitions and animations can help you emphasize points, show connections between ideas, or simply capture your audience’s attention and prevent their eyes from glazing over. (See Figure 16 for a screenshot of the animations menu in PowerPoint 2013.)

Figure 16: Expanded list of animations available in PowerPoint 2013
However, if you overload your slideshow with visual effects, or if you choose splashy effects, you will likely encounter several problems:
- Your audience will pay more attention to the moving images than to the subject you’re talking about.
- Your audience won’t be able to tell if an effect means they should pay special attention or if it’s just another effect.
- Effects will take longer than you expect to finish running, or you’ll forget to cue them. You’ll then go silent as you wait for the animations to finish, and your audience will realize you screwed up.
- Effects will introduce a lighthearted note into your presentation and detract from your professional ethos or undermine a serious subject.
Here is a link to a video that demonstrates how to use PowerPoint’s built-in Animation tool and Animation Pane:
These same cautions apply to Prezi, but Prezi has its own special problems. Instead of switching between slides, you set up a flat “canvas” on which you place text and images, and when you present your talk, Prezi’s camera traces a path between those elements and zooms in on them. (See Figure 17 for an example of paths in Prezi.) Thus, transitions and animations are part and parcel of Prezi, which means it’s doubly important that you control their intensity.
- Prezi will let you place elements at peculiar angles and then “rotate” the camera to emphasize them. If you rotate the camera too frequently, you’ll make your audience seasick.
- You can locate text or images anywhere on the canvas and set up arbitrary motion paths between them. If you make the camera move long distances between elements, you’ll disorient your audience members.

Here is a link to a brief YouTube video demonstrating motion paths in Prezi: https://www.dropbox.com/sh/812erramvb8lvjk/AAC9SRhZy9v-CxNmAvQQtlf7a/Prezi%20sample.mp4?dl=0
Figure 17: Numbered sequence indicating a “path” in Prezi
Sound Effects. Audio cues have the same potential benefits and drawbacks as transitions and animations, but they also have several unique problems of their own:
- Audio clips will sound distorted or tinny unless the computer you are using to present is connected to a good-quality sound system.
- If the audio clip is more than a few seconds long, you’ll need to shout to be heard over it.
- It’s almost impossible to talk over rock or hip-hop. Your voice just can’t compete with the backbeat.
- Music samples longer than a few seconds consume massive amounts of memory, and your file size will be huge.
- Song snippets may be so short that they’re unrecognizable.
- Nobody else likes your taste in music.
In short, no matter what program you use, keep your presentation’s visual and audio effects relatively simple and use them to support your message. The effects should enhance the presentation; they shouldn’t be the presentation.
Delivery Techniques
Your slideshow shouldn’t be the main focus of your talk. Instead, YOU and your message are the main focus, and the presentation should support your talk. Don’t hide behind the presentation or use it as a crutch.
Prepare Notes. Write down key phrases on notecards or, if you will have access to a speaker’s computer while you’re talking, the program’s Notes view. It’s not a good idea to write out a line-for-line script because if you read from a script, the presentation will sound stilted. The best presentations are thoroughly prepared but sound ad-libbed.
Whatever you do, DO NOT read every single word on the screen. Your audience members can read, and you’ll only annoy them. See Figure 18 for an example.

Figure 18: Example of Presenter View in PowerPoint
Practice. Run through your talk and slideshow before you stand in front of an audience. Start up the presentation, say what you intend to say out loud, advance the presentation to match your speech, and time yourself. If you don’t practice, your audience will know.
Face Your Audience. Turn your face toward the audience and make eye contact with them when you speak. If you do, the audience will be able to hear you, and they will be more likely to believe what you say.
When you create a PowerPoint, Prezi, or Keynote presentation, be sure to consider the principles discussed in this webtext. You now know how to
- choose an effective presentation format
- identify readable typefaces
- position visual elements onscreen
- pick appropriate colors
- choose relevant, useful backgrounds
- choose effective visual and audio effects
- present memorable, effective audiovisual materials
and you can create a successful presentation that will both capture your audience’s attention and provide the audience with clearly presented, easily-extracted information.

Brevity – Say More with Less

Clarity (in Speech and Writing)

Coherence – How to Achieve Coherence in Writing

Flow – How to Create Flow in Writing

Inclusivity – Inclusive Language

The Elements of Style – The DNA of Powerful Writing

Suggested Edits
- Please select the purpose of your message. * - Corrections, Typos, or Edits Technical Support/Problems using the site Advertising with Writing Commons Copyright Issues I am contacting you about something else
- Your full name
- Your email address *
- Page URL needing edits *
- Comments This field is for validation purposes and should be left unchanged.
Featured Articles

Academic Writing – How to Write for the Academic Community

Professional Writing – How to Write for the Professional World

Credibility & Authority – How to Be Credible & Authoritative in Research, Speech & Writing
Presentation Guru
5 ways to make your presentation more visual and effective.

Visualizing slides (just a fancy word for transforming slides full of text into more visual slides) is a big part of my job, but you don’t need to be a PowerPoint expert to apply some basic visualization techniques to your presentations. Even minimal changes can make your presentations much more effective and can help people understand your messages better.
Listening to someone present, who is just reading a slide full of text, doesn’t add to understanding. It actually distracts, because the audience will end up reading the text on the slides themselves instead of listening to what the presenter is saying.
On the other hand, slides with less text and more visuals, whether it be graphs, pictures or diagrams can help the audience retain more information, because visuals and speech work hand-in-hand rather than compete for attention in the brain.
It’s a proven concept we follow at BrightCarbon, and one that we often preach about on our own blog . So, to get you started, here are 5 simple things that you can do to make your presentations more visual and more effective.
1) Cut down text on slides
Bullet-point filled slides have been plaguing audiences since PowerPoint began. But they aren’t just painfully dull: bullet points are really ineffective for communicating information to an audience.
So, the easiest way you can quickly make your presentation 1000 times better is by simply cutting out some of the text.
The easiest way to cut down text is to first break it down into chunks, then break it into key points – so, one short bullet-point per chunk – and then to get rid of filler words. This will help you take large paragraphs of text and break them into short and snappy phrases that can fit into text boxes or other shapes.
For example, let’s look at the following block of text:
Peonies are my favorite type of flower. They’re pretty to look at because they come in a range of beautiful shades of pink. They also smell amazing and make great perfume. Lastly, they are larger than a lot of other flowers and make a gorgeous, lush bouquet.
Instead of filling an entire paragraph, we could break this text into three key points:
- Peonies come in range of pink shades
- They make great perfume
- They make a gorgeous bouquet
Then, if we get rid of any filler, we are left with:
- Pink shades
- Great perfume
- Gorgeous bouquet
And voila! You have yourself some bullets that are ready to be fit into shapes. By allowing your text to fit into shapes you gain the ability to organize it in a linear way and then you can animate it on clicks, to stagger the flow of information and tell a more compelling story.
So, BEFORE :

and AFTER :
If you want to learn more about how to ditch the bullet points for good, find out more here .
2) Show locations on maps
I’ve worked on quite a few presentations at this point and I think it’s safe to say most of them include a list of locations at some point. This is because it is really common for companies to have a narrative that includes showing their impact on a national, or global, scale by showing their locations. Often, this is just presented as a list of places. But it’s a lot more interesting – and memorable – to show locations on a map.
For example, if a company has opened a couple stores per year, in different locations, they could animate icons representing these stores on a map and have information such as the year, location or size of store in a box next to the icon.
This is a good way to make the slides illustrate a story about the company’s growth, in a way that is easy for the audience to understand.
3) Add color cues
Adding color to slides in an organized way can enable you to manipulate the audience’s attention and increase their understanding of your content.
For example, if every element on your slide is blue and then you color one object yellow, people will understand that the differently colored object is important or different in some way.
The same idea of ‘color coding’ works when you want the audience to get certain ideas from colors e.g. yellow and black mean warning; green is positive; red is negative.
Keep in mind that these associations are partly based on cultural teachings, so they might not apply if the people you are presenting to have a different cultural understanding of color.
You can also use color to set a ‘mood’ for your presentation. For example, if your company is heading a green initiative then using green tones in your presentation will make it feel more environmentally friendly. Most brands already apply this theory in their logos and brand guidelines, so continuing this thought process in your slides can create even more cohesion and understanding.
Find out more about using color effectively here .
4) Use Timelines

A great way to organize text-heavy slides that involve dates and events is to divide them into a timeline.
This is similar to the map idea above, in that it requires a certain type of information to be successful, but if you have dates and information, it’s much more effective to see them organized linearly than in a list of bullet points.
A timeline is a pretty simple element to create on PowerPoint and just involves a line and some evenly aligned and distributed boxes. Create your boxes using the Insert -> Shape functionality, then use the built-in alignment tools to space everything out neatly .
5) Replace text with labelled images
The last, and arguably most important, point is to get rid of text all together, and replace it with images.
For example, if you want to talk about a new product and its features, the best way of doing this is to insert an image of the product and just label it with key words.
You can insert shapes to pin-point areas you’d like to highlight and then animate them in on clicks so you can stagger the rate at which you mention each feature, which can help the audience follow along.
It’s also useful to have images of the product being used by customers so that you can show the audience exactly how it will look and work.
Being complacent and adding tons of text or bullet points to your presentations won’t do you any favors, because people will become instantly bored and disengaged while you’re presenting, and will start reading what’s on the screen instead of listening to the important things you’re saying.
By applying a couple of easy-to-learn tips to your next presentation, you can significantly increase its effectiveness and make it much more visually appealing. Your audience will stay engaged throughout your presentation and will remember more of the content you are sharing.
It’s amazing how much visuals can do to improve communication between a presenter and an audience, so just remember that the next time you’re pasting reams of text into a 25-slide deck: there are better ways.
- Latest Posts
Latest posts by Amy Post ( see all )
- A Quick Guide to More Effective Animations - 28th February 2019
- Master the Slide Master - 20th March 2018
- 5 Ways to Make Your Presentation More Visual and Effective - 6th April 2017
Craig Hadden (@RemotePoss)
11th April 2017 at 4:05 am
These are great ideas, so thanks for sharing. Recently I’ve tried to use colour in a more systematic way, so I was especially interested to read your thoughts on that.
You might also like this makeover I did on a (real) slide. It was stuffed full of bulleted text, but ended up being far less wordy and much more visual. See what your think. (And any comments or questions are always welcome!)
15th April 2017 at 12:47 pm
Thanks for this. and if you’d like to write that piece for us, to help the thousands of designers and presenters out there, we’d love to publish that piece too. The guru is our community after all!
Abigail Lee
25th June 2019 at 12:11 pm
Great article. Prior to stumbling upon your article on Google, I have found similar another engaging article on this website https://www.slideteam.net/blog . It has a collection of enthusiastic articles on PowerPoint as well as professional slides. Feel free to explore all of them.
Your email address will not be published. Required fields are marked *
Follow The Guru

Join our Mailing List
Join our mailing list to get monthly updates and your FREE copy of A Guide for Everyday Business Presentations

The Only PowerPoint Templates You’ll Ever Need
Anyone who has a story to tell follows the same three-act story structure to...

Integration with Microsoft Teams is
Streamline workflows and enhance collaboration with KrispCall and Microsoft Teams Integrations.
Zapier Integration is
KrispCall now supports Zapier Beta! Connect & elevate your workflow seamlessly
What Is Visual Communication? Examples, Tools & How It Works
- 11 minute read

The struggle to convey an idea, information, and data to the audience, only to see them in confusion, is a regular story. 😕 A great challenge poses with overloading information while trying to capture the audience’s attention and get your message through. 🥲
But what if you could do that through visual communication? 💡
📈 Leveraging visual communication, you can simplify compelling content and make it easy to understand using the latest tools and techniques.
In this blog, we’ll discuss visual communication, how it works, examples, and the types of tools to use effectively in the workplace.✅
🔑 KEY HIGHLIGHTS
- Visual communication uses visual elements such as graphic design, illustrations, and animation to communicate information and ideas clearly.
- Visual communication engages, creates trust, conveys information quickly, and brings clarity to the audience.
- Some examples of visual communication are GIFs, infographics, animation, etc.
- Visual communication can be used in the workplace as interactive dashboards, process diagrams, project roadmaps, visual meeting agendas, and organizational charts.
Table of Contents
What Is Visual Communication?

Visual communication, also known as communication design , is the medium for portraying information, ideas, and data through pictorial representation. It uses visual elements like graphic design, illustration, drawing, typography, video, animation, and other new electronic resources.
A few key stats related to visual communication:
- An in-depth study suggests that a message can be enhanced up to 40% when visual aids are used.
- People retain 65% of the conveyed information if a combination of visual and verbal communication is used, compared to 10% if the information is given through verbal communication only.
- 50% of people are visual learners who prefer to learn such pieces of information efficiently.
The main purpose of visual communication is to convey the meaning behind an idea using symbols and live and still images . It is to communicate complex data or information with simplicity.
Types Of Visual Communication
As far as being creative to present any complicated information easily, there are numerous types of visual communication.
- Pictorial Communication: Pictorial communication uses images to convey a story or information. This includes photographs, illustrations, and diagrams that may evoke feelings to set a context where words are difficult to use. Communicators can use compelling visuals to enhance understanding and retention of information.
- Graphic Communication: Graphic communication uses symbols, images, and lines . Such graphical elements include charts, graphs, and icons, among many others, designed to simplify rather complex information and convey it understandably.
- Animation Communication: Motion visual communication adds motion to energize messages, including animation videos and motion graphics , which grab attention and excitement. The application of motion will help in storytelling and further give the audience a better, more immersive experience that helps them remember the information more easily.
- Objects and Models: Objects & Models are physical representations using actual scaled diagrams that serve as concrete means to demonstrate a point. This method of visualization can also make the subject matter clearer with a physical reference. This strategy can make intangible ideas concrete and familiar, whether a prototype, 3D model or actual object .
- Maps: Maps are specialized forms of visual communication that effectively display geographic relationships and locations . They let audiences begin envisioning specific information that may hold considerable value in understanding context and direction. No matter how they are used, whether for navigation, planning, or representing data, maps can clarify information and give insight into what is being conveyed.
How Does It Work?
Visual communication has a unique approach to how the audience perceives it. Humans usually depict visual communication in three steps.
- Sight: The first contact comes when visual communication is presented with various elements like illustrations, icons, infographics, motion, and more. Unpredicted shapes, sizes, and color are chosen to connect with the audience. And this step is completed when an audience sees one and gets intrigued.
- Feel: An effective combination of visual elements to enforce a message to the audience is expected to have a connection, either positive or negative, at first sight. Colors, shapes, and sizes are used with the aligned intended message. This creates an influence on how the audience feels about the information. This emotional engagement shall lead to a memorable impact.
- Simplify: After soaking in the visual elements, it’ll become easier for the audience to grasp that portrayed concept instantly. It enlightens the audience with simplification and understanding with his judgment of the presented visual communication.
Why Is Visual Communication Important?
Visual communication is essential because it allows users to convey information through different visual elements like images, video, animations, and graphics. It also aids in cutting through the noise and is able to get the message across through high-quality and memorable content.
With its relative importance, there are some advantages of visual communication.
1. Enhanced Engagement
Visual elements are highly engaging for audiences. Humans are attracted by images and videos, which might be more appealing than just text. A communicator can make situations more engaging and interactive with the use of visuals. It gradually persuades audiences to become more receptive to the information. This type of engagement enables productive discussion and promotes a better understanding of the subject matter at hand.
2. Increased Credibility
Visuals can give credibility to the conveyed message . Every pictorial depiction, image, or infographic can prove helpful in enhancing trust in any information. When audiences see a smartly made graphic or any other compelling video, they are more likely to believe in the authenticity and reliability of the content, which turns their response in their favor.
3. Direct Information Delivery
Visual communication provides information transfer instantly. It helps complex ideas to be understood humanely with fun. Statistics and data are better understood when presented on charts or graphs rather than through a verbal explanation of the information. This aspect of visual communication makes it easier for audiences to understand the key points at first glance, which enhances greater understanding and retention of information.
Examples of Visual Communication
Visual communication has a wide range of tools and methods to convey a piece of information. There are a few examples of visual communication described.
- GIFs: GIFs are animated images that capture the attention of any viewer instantly and lighten the mood in the presentation. They come in handy when one wants to add a dash of humor or drive a point home very vibrantly.
- Infographics: Infographics are visual representations that merge graphics with data. They portray complex information in a bite-sized format and are great for capsule summaries of statistics, processes, or comparisons.
- Data visualization: Data visualization is used to take plain information and turn it into formats such as charts and graphs. It allows audiences to make sense of trends and relationships that may exist within large data sets, easing the effort of analyzing information and deducing meaningful insights.
- Animation: Animated videos and graphics help capture one’s attention as they can be used in simplifying complex concepts. In storytelling, this medium makes information more relatable and engaging for the viewers.
- Screen recording: Screen recordings are very instructional in nature and thus work well because they teach viewers how to use software or do certain tasks. This visually guided guide will improve learning and understanding in the areas of technology.
- Video content: Videos, including an explainer video, demo, or testimonial, are great means of visual communication. Videos can carry a message much more dynamically and emotionally than text and thus better engage the audience.
How To Use Visual Communication In The Workplace?
There are various ways you can work with visual communication in the workplace.
1. Interactive dashboards:
Interactive dashboards make a collection of data come alive through moving graphics. It provides teams with the ability to track performance metrics and KPIs within one glance. Employees are able to support informed decisions more effectively and track progress on projects efficiently through visualization.
2. Process diagrams:
Process diagrams help teams visualize the workflow or process of something, giving them a better view of what seemed to be complicated operations. Mapping each step in a process empowers employees to realize bottlenecks and save workflows. Such clarity might give way to better efficiency and collaboration between persons within a team.
3. Project roadmaps:
Project roadmaps enable one to see a project’s timeline and milestones from a bird’ s-eye view. Visualizing project plans helps teams clearly understand their roles and responsibilities within the project, track their progress, and know any oncoming deadlines.
4. Visual meeting agendas:
Visual meeting agendas are an effective way of outlining topics for discussion in meetings. They help keep the meetings focused and ensure relevant viewpoints are conveyed, making the conversation more productive.
5. Organizational charts:
Organizational charts are visual representations that explain company structure and roles. The clarity of such charts enables one to understand who reports to whom and how people work together as teams within the company, improving collaborative communication across departments.
Visual Communication Tools
Here, we’ve listed out the commonly used visual communication tools in the market:
1. Graphic design software: Tools like Adobe Creative Cloud, Photoshop, Illustrator, InDesign, Canva, and Figma allow users to create and manipulate images, illustrations, and layouts. These are useful for creating infographics, social media graphics, and print materials.
2. Presentation software: Tools such as Microsoft PowerPoint, Google Slides, and Prezi allow users to set up visually appealing presentations with text, images, and animations that deliver ideas effectively.
3. Data visualization tools: Tools such as Tableau, Microsoft Power BI, and Infogram can help visualize large amounts of data and convert it into charts, graphs, and dashboards that are readable and understandable. This process makes it much easier to create trends and patterns in data.
4. Video editing software: Adobe Premiere Pro, Final Cut Pro, Davinci Pro, and iMovie are some video editing tools. These tools let users create and edit videos and merge footage, graphics, and audio into stunning visual content.
5. Mind mapping software: MindNode, XMind, and Coggle are mind mapping tools that let users draw diagrams explaining ideas, thoughts, or processes. This illustrates the process of brainstorming, organizing, and communicating information.
6. Infographic creation tools: Infographic tools like Venngage, Piktochart, and Canva provide templates and design services specifically targeted at creating infographics, making it much easier to present data better and communicate the required information.
7. Collaboration tools: Miro, Figma, and Adobe Creative Cloud Libraries are some collaboration tools that provide space for visual projects and design annotations, thus making the creative process operate smoothly and be consistent within the projects.
Visual communication is an integral and convenient way to convey information. Organizations can use some visual elements, such as graphics, animation, and infographics, to enhance comprehension, engagement, and retention of their message.
From graphics design software to data visualization, the tools of visual communication set people and teams in motion to create engaging content that speaks to the audience. Embracing visual communication will allow us to simplify these complex ideas, create meaningful relations with our audience, and be successful in our personal and professional lives.
What are the components of visual communication?
The components of visual communication are:
- Motion: It mainly comprises animation and video elements imparting energy and activity into the communication.
- Image and Graphics: These are visual representations of ideas or data through photographs, illustrations, and icons.
- Typography: The text style and composition that allow for readability and clarity of tone.
- Color: Colors can motivate emotions and point out key information.
- Layout: It refers to the act of arranging or composing visual elements on a page or screen in such a manner that it provides a clear path for the eye to follow and creates some integrity.
What does Viscom mean?
Viscom is the shortened form of the term ‘Visual Communication.’ It refers to the practice of expressing ideas and information in the form of visually more attractive elements. It means proper conduction of proper messages to audiences through proper graphics, images, typography, and other means of visual communication.
What are the characteristics of visual communication?
The characteristics of visual communication are:
- Accessibility: Visual communication can express ideas beyond linguistic boundaries, making information available to more people.
- Clarity: Clarity signifies the clarity of the way of presenting information to reduce ambiguity and confusion.
- Engagement: It connects the audience with a beautiful visual, further making the information more relatable and memorable.
- Simplicity: Its effective visual communication simplifies complex information so that audiences can grasp key concepts very quickly.
- Emotional Impact: It creates feelings and connections in the target audience and makes an overall message effective.
What are the application areas of visual communication?
Some of the application areas of visual communication are:
- Marketing and Advertising: It provides visual ideas on campaigns, branding, promotional materials and all those that customers can pay attention to and hold.
- Education: It involves well-designed visual instruments, such as flow charts, infographics, and videos, to ensure an effective learning process for students.
- Corporate Communication: It assists in preparing presentations, reports, and internal communication to organize and effectively spread information among employees and stakeholders.
- Web and User Interface Design: It helps in building very appealing interfaces that are simple to use, making it easier and better for users to interact.
- Media and Journalism: It helps in using the power of the image in narration, news articles, and data representation in clear and understandable ways.
Follow our newsletter !

Dinesh Silwal
Dinesh Silwal is the Co-Founder and Co-CEO of KrispCall. For the past few years, he has been advancing and innovating in the cloud telephony industry, using AI to enhance and improve telephony solutions, and driving KrispCall to the forefront of the field.
Related Blogs

Psychographic Segmentation: Examples, Steps & Best Practices
In today’s crowded marketplace, knowing your customers isn't just an advantage; it’s necessary. However, the primary challenge while running a…
- 19 minute read

Lead Attribution: What It Is & How to Get Started?
Marketing involves a variety of strategies and activities aimed at guiding customers through a complex purchasing process.🛍️ Before making a…
- 13 minute read

Email Marketing ROI: How To Measure and Maximize Your Returns?
Are you tired of sending emails that feel like shooting with a blindfold?😔 Wondering how to make your email marketing…
- Design for Business
- Most Recent
- Presentations
- Infographics
- Data Visualizations
- Forms and Surveys
- Video & Animation
- Case Studies
- Digital Marketing
- Design Inspiration
- Visual Thinking
- Product Updates
- Visme Webinars
- Artificial Intelligence
12 Best Company Profile Template to Present Your Business

Written by: Olujinmi Oluwatoni
Whether you’re pitching your product or service to investors, clients, or partners, a compelling business profile can be the catalyst you need to win their confidence and secure deals.
A company profile is an excellent way to present who you are, what you do and, most importantly, why it matters. It goes beyond showcasing your company; it articulates your brand’s essence.
A poorly crafted company profile can cast a lasting shadow on your brand. Hence, it's crucial to put your best foot forward when creating one. To assist you, we've curated some professionally designed company profile templates you can easily customize right away. We’ve also included some of Visme’s features and tools to make your design experience seamless.
Let's get to it!
Before we dive in, here's a short selection of 8 easy-to-edit company profile templates you can edit, share and download with Visme. View more templates below:

Table of Contents
- What Is a Company Profile Template
The Importance of a Company Profile Template
12 best company profile templates, company profile faqs.
- A company profile template is a designed framework that offers a professional snapshot of a business.
- It typically includes key information, such as the company's background, mission, products or services, achievements and other relevant details.
- A company profile template enhances consistency, saves time, offers adaptability, simplifies updates, ensures professionalism and promotes effective collaboration.
- Visme offers an extensive library of company profile templates , features and tools to help you and your team create excellent company profiles.
What is a Company Profile Template?
A company profile template is a pre-designed framework that provides a professional overview of a business . It is an excellent way to showcase your company's essence and offerings.
A well-designed company profile creates a positive first impression on potential clients, partners, investors and other stakeholders. It is suitable for use in different contexts, such as creating presentations, proposals or marketing materials.
A typical company profile includes information such as the company's history, mission, vision, products or services rendered, target market, team members, achievements, pricing information and more.
A pitch deck and a company profile share similarities as tools for introducing a business. However, a pitch deck is brief and tailored for selling ideas or seeking funding. In contrast, a company profile is a comprehensive marketing tool used to introduce your company to a broader audience.
Creating the perfect profile for your company can be challenging without a template to work with.
Below are the benefits of using a company profile template
- A company profile template ensures consistency in branding, corporate messaging, representation and business detail as well as business documents and presentations.
- Using a template saves time by providing a pre-designed framework that only requires customization rather than starting from scratch.
- A well-designed profile template enhances the professional image of your company. It ensures that the information is organized clearly and creates a positive impression on clients, partners, investors and other stakeholders.
- A good profile template can be adapted easily to fit different purposes or changing business needs or landscapes. Whether it's a new product launch, a significant milestone, or a shift in focus, the template can be modified to keep the company profile current.
- Templates provide a structured framework for collaboration. When multiple individuals or teams contribute to a company profile, maintaining cohesiveness and structure becomes easier.
Visme’s company profile templates are designed to be adaptable to different purposes and audiences. You can customize the template based on your specific business requirements.
If your team needs to collaborate on a company profile, Visme allows you to do this seamlessly. Our collaboration tool allows teams and organizations of all sizes to work together on projects in real time.
Hey executives! Looking to cut design costs?
- Spend less time on presentations and more time strategizing
- Ensure your brand looks and feels visually consistent across all your organization's documents
- Impress clients and stakeholders with boardroom ready presentations
Sign up. It’s free.

In this section, we have listed twelve of the best company profile templates you can use to create one for your company right away
Our professionally crafted company profile examples are easily customizable to suit various needs and projects. You can effortlessly customize them by swapping, removing, or adding sections, adjusting text and fonts, brand colors, visuals and more.
And if you’re unable to find a template you like, you can always use Visme’s AI Designer to whip up a custom design for you based on prompts.
Here’s what one of Visme's clients had to say about our templates and features:
Cassandra C.
Graphic Designer & Business Owner
1. Technology Company Presentation Template

This company profile template is a perfect framework for providing a comprehensive overview of your tech startup to investors or clients. The presentation features a stylish purple background with white and pink text, ensuring optimal visibility and clarity. It also offers ample space to showcase your business without overcrowding the text.
You can utilize the dedicated sections to highlight your company's history, team, services, unique offerings, pricing and contact details. You can also add a link to website's contact us page if that's you're preferred communication.
Visme’s brand wizard makes it a breeze to turn this template into a document that truly reflects your brand identity . Simply input your company website and the Wizard will collect your colors, fonts, icons and more to generate a cohesive brand kit. It will even recommend templates that align with your branding.
2. Tangerine Presentation Template

Utilize this vibrant template to present business concepts to clients and investors, introduce project teams, or unveil new products and services.
The template highlights your company's creative essence with captivating shapes, pooping colors and lively themes. Dominated by orange hues, the design effortlessly captures attention.
The sections include an about us page, product showcase, user reach, SWOT analysis, mobile description, pricing details and more.
You can add flair by transforming this company profile example into a captivating page-turner with Visme's flipbook effect . This feature lets your audience virtually flip through pages, providing a document-like experience.
3. Retro Neon Startup Presentation Template

This retro-futuristic presentation template would work exceptionally well for a company targeted at young people or a startup specializing in quirky hardware tech.
It uses moody, neon colors, inspirational graphics and storytelling design to captivate your audience’s attention and keep them reading. The slides incorporate dynamic graphics—reminiscent of vintage neon signs—to create an engaging and visually striking appeal.
Sections covered in this template include about us, mission statement, team members, services offered and business statistics. With Visme's data visualization tools , including charts and widgets, you can present data-driven reasons why potential customers should choose you over competitors.
4. Terminal Presentation Template

Enhance your software business presentations and make a strong impact with this sleek terminal template. Whether you want to showcase your business to investors or introduce new offerings to clients, this template is a great choice.
This example of a company profile boasts stylish gradients, clean icons and user-friendly layouts, ensuring a professional and modern impact on your audience. The gradient color scheme captures attention while maintaining readability.
With a detailed presentation of your company overview, innovative strategies, SWOT analysis and financial details , this template helps you to present a compelling presentation.
The best part? This design is entirely customizable, making it adaptable to any product or brand.
If you have trouble crafting content for various sections, utilize Visme's AI writer to generate well-written initial drafts based on your prompts. You can also effortlessly refine, summarize, or edit your content using this AI tool.
5. Colorful CMYK Presentation Template

Want to show the artsy, fun side of your business? Build your company profile with this colorful CMYK presentation template.
CMYK stands for cyan, magenta, yellow and key(black) and this presentation template boasts a vibrant and diverse color palette inspired by this color model. The sections in this template cover diverse topics, from company details to project highlights, all presented in a bold and visually cohesive manner.
You can infuse more fun into this presentation by integrating diverse animations , such as stylish text and object transitions, along with animated icons, illustrations, characters and gestures.
6. Rebel Presentation Template

This rebel presentation template is a befitting design for a company looking to break the mold and differentiate itself from the competition. The template features dark, intense hues, conveying a sense of rebellion and nonconformity, as well as striking, greenish-yellow graphics that symbolize freshness.
The sections covered in this template include about us, services offered, business channels, relevant quotes, stats and contact details.
Use subtle hover effects or clickable pop-ups to include additional information like testimonials and technical details without cluttering the page. You can also allow seamless navigation by linking contact buttons, social media icons, or websites directly to relevant pages using interactive links.
7. Tiffany Startup Presentation Template

Looking for a modern, sleek company profile template that can be used to present your startup to customers, clients and investors? This template fits the bill.
The template blends shades of blue, creating a calm and professional aesthetic. It also integrates striking stock photos and icons to enhance visual appeal and reinforce key messages. Utilize its sections to emphasize your company overview, values, mission, team members, services and more.
If you prefer to customize the visuals, explore Visme’s vast library of high-quality icons and stock photos to find the perfect fit for your needs. If you want to give your existing photos a professional look, utilize Visme’s AI Touch Up tool .
Choose the photo you'd like to improve, then click “Edit” on the top left bar to access a range of touch-up options such as upscale, unblur, erase and replace or remove unwanted background. ‘
Though this template was designed for startups, it can easily be customized for established businesses.
8. Sky Background Company Profile

Showcase your creative projects in a visually striking manner and make a lasting impression on clients or investors with this elegant template.
The template boasts a contemporary design, crisp layout and refined red color palette that makes a bold statement. Its engaging slides incorporate storytelling, guiding clients or investors on why your solution stands out and outshines alternatives.
Utilize this template to present your company's plans for the future, your services, financial performance, team members and more.
Use Visme’s Presenter Studio to record a custom presentation of your company profile for prospects, investors and busy executives.
Watch this video to learn how to record your presentations using Visme’s presenter studio.
9. Sleek Presentation Template

This business profile template is perfect for showcasing tech products, but it can be customized to demonstrate any other product or service your company provides.
Featuring a contrasting blue and white background cream backdrop, the template is stylish and appealing, retaining sufficient space for essential information. Visual aids such as images, icons, charts and graphs help you present your content in an organized and engaging way. While there is a clear focus on style and general appeal, the design is still business-oriented and professional.
To make this company profile even more appealing, put your creativity to good use with Visme’s AI image generator . The wizard turns your text prompts into images in different output styles, such as photos, paintings, pencil drawings, etc.
10. Stratagem Presentation

Share your company narrative detailing your organization's plans and strategies with this compelling presentation template.
This template maximizes visual aids like charts, icons and images to tell your story effectively while maintaining a clean design.
Provide an overview of your company, covering goals, business processes, teams, services, products and more using this versatile presentation template.
With Visme's user-friendly share and publish feature , effortlessly distribute your finalized company profile to your target audience in various formats, such as PDF, PPTX, MP4 and HTML5, or generate a shareable link.
Curious about your presentation's impact on investors or clients? Utilize Visme's analytics to track engagement metrics like unique visits, average viewing time, duration, IP addresses and more.
11. Tesla Corporate Presentation

Whether you're introducing your recently established company, proposing a business concept, or unveiling a new product, feature, or service, this template will help you make an impactful presentation.
Its dynamic blend of blue and white, paired with compelling visuals and bold icons, ensures your presentation captures attention.
The template includes dedicated sections for key elements such as company introduction, team members, SWOT analysis, your process, product samples, clients across locations, timeline, testimonials and more.
Manually entering all this information on multiple company profile pages can quickly become cumbersome. Utilize Visme's dynamic fields tool to easily update data across your company profile.
12. Neuro Presentation Template

The best part of this template apart is its rich utilization of appealing data visualization tools like flowcharts, maps and pie charts, ensuring a clear and concise presentation of key statistics and figures.
Visme's collaboration feature allows team members to contribute to and review the consulting proposal individually or in real-time. The workflow tool enhances task management. You can easily assign tasks, set deadlines, monitor the progress of work and make corrections—all within a unified platform
Q. What Should a Company Profile Include?
A good company profile should provide a complete overview of the business. It should offer a written representation of the company and reflect everything it offers. It should include your company’s branding, history, culture and values; team members; products and services; contact information and testimonials. Be sure to include relevant numbers and dates.
Q. What Is the Basic Structure of a Company Profile?
The ideal company profile would have the following sections:
- Introduction: This section briefly introduces the company. It includes details such as the company's name and contact details.
- Mission and Vision Statement: You should clearly state the company's mission and vision and how these statements guide the company's actions in this section.
- Key Personnel: Introduce key team members, executives and leadership in this section. You can also include brief bios highlighting their roles.
- Products/Services: This section details the range of products or services you're offering. You can also highlight the unique selling points and competitive advantages.
- Clientele/Projects: Showcase major clients, successful collaborations and significant projects in this section.
- Financial Overview: Give a summary of your company's financial status, key financial indicators and growth trends in this section.
- Testimonials: This section should feature top customer reviews that resonate with your brand values and highlight your key benefits.
- Call to Action/Contact Information: Provide your contact details for further inquiries or partnerships.
Q. How Long Does It Take To Write a Company Profile?
To give an estimate, it can take anything from a few hours to several days, depending on the level of planning and coordination.
However, the time needed to write a company profile depends on several factors, such as whether you are starting from scratch or using a template, whether you already have the needed information on hand, the desired length of the profile, the complexity of the business, the level of detail required and the ease of collaboration between the team members involved.
A straightforward profile for a small business may be completed more quickly, while a detailed profile for a large corporation with multiple divisions might take longer.
Highlight the Best of Your Company with Visme
A company profile is a great way to market your business and communicate your company’s offerings. It is an incredible marketing tool that can help build and reinforce your company's brand identity and reputation.
Visme’s company profile templates are easy to customize and offer access to several built-in design assets to turn your company profile into the storytelling presentation it needs.
You'll also access a comprehensive suite of cutting-edge features, including an intuitive editor, collaboration tool, presenter tool, data visualizations and many more to enhance your creations.
Beyond company profiles, Visme empowers you to create professional business plans , marketing plans , video presentations , training materials and more.
Sign up for Visme to start creating impactful company profiles and business assets.
Design beautiful visual content you can be proud of.

Trusted by leading brands
Recommended content for you:

Create Stunning Content!
Design visual brand experiences for your business whether you are a seasoned designer or a total novice.
About the Author
Olujinmi is a Content writer for Visme who creates human-first SEO content. She loves helping businesses smash their ROI goals with strategic content development and optimization. When she’s not writing, you’ll find her composing songs.
Understanding SC 1.4.11: Non-text Contrast (Level AA)
The intent of this Success Criterion is to ensure that active user interface components (i.e., controls) and meaningful graphics are distinguishable by people with moderately low vision. The requirements and rationale are similar to those for large text in 1.4.3 Contrast (Minimum) .
Low contrast controls are more difficult to perceive, and may be completely missed by people with a visual impairment. Similarly, if a graphic is needed to understand the content or functionality of the webpage then it should be perceivable by people with low vision or other impairments without the need for contrast-enhancing assistive technology.
The 3:1 contrast ratios referenced in this Success Criterion is intended to be treated as threshold values. When comparing the computed contrast ratio to the Success Criterion ratio, the computed values should not be rounded (e.g. 2.999:1 would not meet the 3:1 threshold).
Active User Interface Components
For active controls any visual information provided that is necessary for a user to identify that a control is present and how to operate it must have a minimum 3:1 contrast ratio with the adjacent colors. Also, any visual information necessary to indicate state, such as whether a component is selected or focused must also ensure that the information used to identify the control in that state has a minimum 3:1 contrast ratio.
This Success Criterion does not require that changes in color that differentiate between states of an individual component meet the 3:1 contrast ratio when they do not appear next to each other. For example, there is not a new requirement that visited links contrast with the default color, or that mouse hover indicators contrast with the default state. However, the component must not lose contrast with the adjacent colors, and non-text indicators such as the check in a checkbox, or an arrow graphic indicating a menu is selected or open must have sufficient contrast to the adjacent colors.
This success criterion does not require that controls have a visual boundary indicating the hit area, but if the visual indicator of the control is the only way to identify the control, then that indicator must have sufficient contrast. If text (or an icon) within a button or placeholder text inside a text input is visible and there is no visual indication of the hit area then the Success Criterion is passed. If a button with text also has a colored border, since the border does not provide the only indication there is no contrast requirement beyond the text contrast ( 1.4.3 Contrast (Minimum) ). Note that for people with cognitive disabilities it is recommended to delineate the boundary of controls to aid in the recognition of controls and therefore the completion of activities.

Adjacent colors
For user interface components 'adjacent colors' means the colors adjacent to the component. For example, if an input has a white internal background, dark border, and white external background the 'adjacent color' to the component would be the white external background.

If components use several colors, any color which does not interfere with identifying the component can be ignored for the purpose of measuring contrast ratio. For example, a 3D drop-shadow on an input, or a dark border line between contrasting backgrounds is considered to be subsumed into the color closest in brightness (perceived luminance).
The following example shows an input that has a light background on the inside and a dark background around it. The input also has a dark grey border which is considered to be subsumed into the dark background. The border does not interfere with identifying the component, so the contrast ratio is taken between the white background and dark blue background.

For visual information required to identify a state, such as the check in a checkbox or the thumb of a slider, that part might be within the component so the adjacent color might be another part of the component.

It is possible to use a flat design where the status indicator fills the component and does not contrast with the component, but does contrast with the colors adjacent to the component.

Relationship with Use of Color
The Use of Color success criterion addresses changing only the color (hue) of an object or text without otherwise altering the object's form. The principle is that contrast ratio (the difference in brightness) can be used to distinguish text or graphics. For example, G183: Using a contrast ratio of 3:1 with surrounding text and providing additional visual cues on hover for links or controls where color alone is used to identify them is a technique to use a contrast ratio of 3:1 with surrounding text to distinguish links and controls. In that case the Working Group regards a link color that meets the 3:1 contrast ratio relative to the non-linked text color as satisfying the Success Criterion 1.4.1 Use of color since it is relying on contrast ratio as well as color (hue) to convey that the text is a link.
Non-text information within controls that uses a change of hue alone to convey the value or state of an input, such as a 1-5 star indicator with a black outline for each star filled with either yellow (full) or white (empty) is likely to fail the Use of color criterion rather than this one.

Using a change of contrast for focus and other states is a technique to differentiate the states. This is the basis for G195: Using an author-supplied, visible focus indicator , and more techniques are being added.
Relationship with Focus Visible
In combination with 2.4.7 Focus Visible , the visual focus indicator for a component must have sufficient contrast against the adjacent background when the component is focused, except where the appearance of the component is determined by the user agent and not modified by the author.
Most focus indicators appear outside the component - in that case it needs to contrast with the background that the component is on. Other cases include focus indicators which are:
- only inside the component and need to contrast with the adjacent color(s) within the component.
- the border of the component (inside the component and adjacent to the outside) and need to contrast with both adjacent colours.
- partly inside and partly outside, where either part of the focus indicator can contrast with the adjacent colors.

Although the figure above with a dark outline passes non-text contrast, it is not a good indicator unless it is very thick.
If an indicator is partly inside and partly outside the component, either part of the indicator could provide contrast.

If the focus indicator changes the border of the component within the visible boundary it must contrast with the component. Typically an outline goes around (outside) the visible boundary of the component, in this case changing the border is just inside the visible edge of the component.

Note that this Success Criterion does not directly compare the focused and unfocused states of a control - if the focus state relies on a change of color (e.g., changing only the background color of a button), this Success Criterion does not define any requirement for the difference in contrast between the two states.

Active User Interface Component Examples
For designing focus indicators, selection indicators and user interface components that need to be perceived clearly, the following are examples that have sufficient contrast.
| Type | Description | Examples |
|---|---|---|
| Link Text | Default link text is in the scope of , and the underline is sufficient to indicate the link. | |
| Default focus style | Links are required to have a visible focus indicator by . Where the focus style of the user-agent is not adjusted on interactive controls (such as links, form fields or buttons) by the website (author), the default focus style is exempt from contrast requirements (but must still be visible). | |
| Buttons | A button which has a distinguishing indicator such as position, text style, or context does not need a visual indicator to show that it is a button, although some users are likely to identify a button with an outline that meets contrast requirements more easily. | |
| Text input (minimal) | Where a text-input has a visual indicator to show it is an input, such as a bottom border (#767676), that indicator must meet 3:1 contrast ratio. | |
| Text input | Where a text-input has an indicator such as a complete border (#767676), that indicator must meet 3:1 contrast ratio. | |
| Text input focus style | A focus indicator is required. While in this case the additional gray (#CCC) outline has an insufficient contrast of 1.6:1 against the white (#FFF) background, the cursor/caret which is displayed when the input receives focus provide a sufficiently strong visual indication. | |
| Text input using background color | Text inputs that have no border and are differentiated only by a background color must have a 3:1 contrast ratio to the adjacent background (#043464). | |
| Toggle button | The toggle button's internal background (#070CD5) has a good contrast with the external white background. Also, the round toggle within (#7AC2FF) contrasts with the internal background. | |
| Dropdown indicator | The down-arrow is required to understand that there is drop-down functionality, it has a contrast of 4.7:1 for the white icon on dark gray (#6E747B). | |
| Dropdown indicator | The down-arrow is required to understand that there is drop-down functionality, it has a contrast of 21:1 for the black icon on white. | |
| Checkbox - empty | A black border on a white background indicates the checkbox. | |
| Checkbox - checked | A black border on a white background indicates the checkbox, the black tick shape indicates the state of checked. | |
| Checkbox - Fail | The grey border color of the checkbox (#9D9D9D) has a contrast ratio of 2.7:1 with the white background, which is not sufficient for the visual information required to identify the checkbox. | |
| Checkbox - Subtle hover style | A black border on a white background indicates the checkbox, when the mouse pointer activates the subtle hover state adds a grey background (#DEDEDE). The black border has a 15:1 contrast ratio with the grey background. | |
| Checkbox - Subtle focus style - fail | A focus indicator is required. If the focus indicator is styled by the author, it must meet the 3:1 contrast ratio with adjacent colors. In this case, the gray (#AAA) indicator has an insufficient ratio of 2.3:1 with the white (#FFF) adjacent background. |
Inactive User Interface Components
User Interface Components that are not available for user interaction (e.g., a disabled control in HTML) are not required to meet contrast requirements. An inactive user interface component is visible but not currently operable. An example would be a submit button at the bottom of a form that is visible but cannot be activated until all the required fields in the form are completed.

Inactive components, such as disabled controls in HTML, are not available for user interaction. The decision to exempt inactive controls from the contrast requirements was based on a number of considerations. Although it would be beneficial to some people to discern inactive controls, a one-size-fits-all solution has been very difficult to establish. A method of varying the presentation of disabled controls, such as adding an icon for disabled controls, based on user preferences is anticipated as an advancement in the future.
Graphical Objects
The term "graphical object" applies to stand-alone icons such as a print icon (with no text), and the important parts of a more complex diagram such as each line in a graph. For simple graphics such as single-color icons the entire image is a graphical object. Images made up of multiple lines, colors and shapes will be made of multiple graphical objects, some of which are required for understanding.
Not every graphical object needs to contrast with its surroundings - only those that are required for a user to understand what the graphic is conveying. Gestalt principles such as the "law of continuity" can be used to ignore minor overlaps with other graphical objects or colors.
| Image | Notes |
|---|---|
| The phone icon is a simple shape within the orange (#E3660E) circle. The meaning can be understood from that icon alone, the background behind the circle is irrelevant. The orange background and the white icon have a contrast ration greater than 3:1, which passes. The graphical object is the white phone icon. | |
| A magnet can be understood by the "U" shape with lighter colored tips. Therefore to understand this graphic you should be able to discern the overall shape (against the background) and the lighter colored tips (against the rest of the U shape and the background). The graphical objects are the "U" shape (by outline or by the solid red color #D0021B), and each tip of the magnet. | |
| The symbol to show a currency (the £) going down can be understood with recognition of the shape (down arrow) and the currency symbol (pound icon with the shape which is part of the graphic). To understand this graphic you need to discern the arrow shape against the white background, and the pound icon against the yellow background (#F5A623). The graphical objects are the shape and the currency symbol. | |
| In order to understand the graph you need to discern the lines and shapes for each condition. To perceive the values of each line along the chart you need to discern the grey lines marking the graduated 100 value increments. The graphical objects are the lines in the graph, including the background lines for the values, and the colored lines with shapes. The lines should have 3:1 contrast against their background, but as there is little overlap with other lines they do not need to contrast with each other or the graduated lines. (See the testing principles below.) | |
| To understand the pie chart you have to discern each slice of the pie chart from the others. The graphical objects are the slices of the pie (chart). Note: If the values of the pie chart slices were also presented in a conforming manner (see the Pie Charts example for details), the slices would not be required for understanding. |
Taking the magnet image above as an example, the process for establishing the graphical object(s) is to:
- Assess what part of each image is needed to understand what it represents. The magnet's "U" shape can be conveyed by the outline or by the red background (either is acceptable). The white tips are also important (otherwise it would be a horseshoe), which needs to contrast with the red background.
- Assume that the user could only see those aspects. Do they contrast with the adjacent colors? The outline of the magnet contrasts with the surrounding text (black/white), and the red and white between the tips also has sufficient contrast.
Due to the strong contrast of the red and white, it would also be possible to only put the outline around the white tips of the magnet and it would still conform.
Required for Understanding
The term "required for understanding" is used in the Success Criterion as many graphics do not need to meet the contrast requirements. If a person needs to perceive a graphic, or part of a graphic (a graphical object) in order to understand the content it should have sufficient contrast. However, that is not a requirement when:
A graphic with text embedded or overlayed conveys the same information, such as labels and values on a chart.
Text within a graphic must meet 1.4.3 Contrast (Minimum) .
- The graphic is for aesthetic purposes that does not require the user to see or understand it to understand the content or use the functionality.
- The information is available in another form, such as in a table that follows the graph, which becomes visible when a "Long Description" button is pressed.
- The graphic is part of a logo or brand name (which is considered "essential" to its presentation).
Gradients can reduce the apparent contrast between areas, and make it more difficult to test. The general principles is to identify the graphical object(s) required for understanding, and take the central color of that area. If you remove the adjacent color which does not have sufficient contrast, can you still identify and understand the graphical object?

Dynamic Examples
Some graphics may have interactions that either vary the contrast, or display the information as text when you mouseover/tap/focus each graphical object. In order for someone to discern the graphics exist at all, the unfocused default version must already have sufficiently contrasting colors or text. For the area that receives focus, information can then be made available dynamically as pop-up text, or be foregrounded dynamically by increasing the contrast.

Infographics
Infographics can mean any graphic conveying data, such as a chart or diagram. On the web it is often used to indicate a large graphic with lots of statements, pictures, charts or other ways of conveying data. In the context of graphics contrast, each item within such an infographic should be treated as a set of graphical objects, regardless of whether it is in one file or separate files.
Infographics often fail to meet several WCAG level AA criteria including:
- 1.1.1 Non-text Content
- 1.4.1 Use of Color
- 1.4.3 (Text) Contrast
- 1.4.5 Images of Text
An infographic can use text which meets the other criteria to minimise the number of graphical objects required for understanding. For example, using text with sufficient contrast to provide the values in a chart. A long description would also be sufficient because then the infograph is not relied upon for understanding.
Essential Exception
Graphical objects do not have to meet the contrast requirements when "a particular presentation of graphics is essential to the information being conveyed". The Essential exception is intended to apply when there is no way of presenting the graphic with sufficient contrast without undermining the meaning. For example:
- Logotypes and flags : The brand logo of an organization or product is the representation of that organization and therefore exempt. Flags may not be identifiable if the colors are changed to have sufficient contrast.
- Sensory : There is no requirement to change pictures of real life scenes such as photos of people or scenery.
- Screenshots to demonstrate how a website appeared.
- Diagrams of medical information that use the colors found in biology ( example medical schematic from Wikipedia ).
- color gradients that represent a measurement, such as heat maps ( example heatmap from Wikipedia ).
Testing Principles
A summary of the high-level process for finding and assessing non-text graphics on a web page:
- Identify the visual (non-text) indicators of the component that are required to identify that a control exists, and indicate the current state. In the default (on page load) state, test the contrast ratio against the adjacent colors.
- Test those contrast indicators in each state.
- Check the contrast of the graphical object against its adjacent colors;
- If there are multiple colors and/or a gradient, choose the least contrasting area to test;
- If it passes, move to the next graphical object;
- If the least-contrasting area is less than 3:1, assume that area is invisible, is the graphical object still understandable?
- If there is enough of the graphical object to understand, it passes, else fail.
The techniques below each have testing criteria, and the related criteria for Focus visible (2.4.7) , Use of color (1.4.1) , and Contrast minimum also have techniques.
People with low vision often have difficulty perceiving graphics that have insufficient contrast. This can be exacerbated if the person has a color vision deficiency that lowers the contrast even further. Providing a relative luminance (lightness difference) of 3:1 or greater can make these items more distinguishable when the person does not see a full range of colors.
- Status icons on an application's dashboard (without associated text) have a 3:1 minimum contrast ratio.
- A text input has a dark border around the white editable area.
- A graph uses a light background and ensures that the colors for each line have a 3:1 contrast ratio against the background.
Pie charts make a good case study for the graphical objects part of this success criterion, the following pie charts are intended to convey the proportion of market share each browser has. Please Note: The actual figures are made up, these are not actual market shares.

Fail: The pie chart has labels for each slice (so passes 1.4.1 Use of Color), but in order to understand the proportions of the slices you must discern the edges of the slices (the graphical objects conveying essential information), and the contrast between the slices is not 3:1 or greater.

Not applicable: The pie chart has visible labels and values that convey equivalent information to the graphical objects (the pie slices).

Pass: The pie chart has visible labels, and sufficient contrast around and between the slices of the pie chart (the graphical objects). A darker border has been added around the yellow slice in order to achieve the contrast level.

Fail: Discerning the circles is required to understand the size of network and discerning the icons in each circle is required to identify which network it shows.
The graphical objects are the circles (measured against the background) and the icons in each circle (measured against the circle's background).

Pass: The circles have contrasting borders and the icons are a contrasting dark color against the light circle backgrounds.
There are many possible solutions to ensuring contrast, the example shows the use of borders. Other techniques are to use darker colors for the circle backgrounds, or to add text labels & values for each item.
Related Resources
Resources are for information purposes only, no endorsement implied.
- Accessibility Requirements for People with Low Vision .
- Smith Kettlewell Eye Research Institute - "If the text is better understood with the graphics, they should be equally visible as the text".
- Gordon Legge - "Contrast requirements for form controls should be equivalent to contrast requirements for text".
Each numbered item in this section represents a technique or combination of techniques that the WCAG Working Group deems sufficient for meeting this Success Criterion. However, it is not necessary to use these particular techniques. For information on using other techniques, see Understanding Techniques for WCAG Success Criteria , particularly the "Other Techniques" section.
Sufficient Techniques
Select the situation below that matches your content. Each situation includes techniques or combinations of techniques that are known and documented to be sufficient for that situation.
Situation A: Color is used to identify user interface components or used to identify user interface component states
- G195: Using an author-supplied, visible focus indicator
- G174: Providing a control with a sufficient contrast ratio that allows users to switch to a presentation that uses sufficient contrast
Situation B: Color is required to understand graphical content
- G207: Ensuring that a contrast ratio of 3:1 is provided for icons
- G209: Provide sufficient contrast at the boundaries between adjoining colors
The following are common mistakes that are considered failures of this Success Criterion by the WCAG Working Group.
- F78: Failure of Success Criterion 2.4.7 due to styling element outlines and borders in a way that removes or renders non-visible the visual focus indicator
hardware and/or software that acts as a user agent , or along with a mainstream user agent, to provide functionality to meet the requirements of users with disabilities that go beyond those offered by mainstream user agents
functionality provided by assistive technology includes alternative presentations (e.g., as synthesized speech or magnified content), alternative input methods (e.g., voice), additional navigation or orientation mechanisms, and content transformations (e.g., to make tables more accessible).
Assistive technologies often communicate data and messages with mainstream user agents by using and monitoring APIs.
The distinction between mainstream user agents and assistive technologies is not absolute. Many mainstream user agents provide some features to assist individuals with disabilities. The basic difference is that mainstream user agents target broad and diverse audiences that usually include people with and without disabilities. Assistive technologies target narrowly defined populations of users with specific disabilities. The assistance provided by an assistive technology is more specific and appropriate to the needs of its target users. The mainstream user agent may provide important functionality to assistive technologies like retrieving Web content from program objects or parsing markup into identifiable bundles.
- screen magnifiers, and other visual reading assistants, which are used by people with visual, perceptual and physical print disabilities to change text font, size, spacing, color, synchronization with speech, etc. in order to improve the visual readability of rendered text and images;
- screen readers, which are used by people who are blind to read textual information through synthesized speech or braille;
- text-to-speech software, which is used by some people with cognitive, language, and learning disabilities to convert text into synthetic speech;
- speech recognition software, which may be used by people who have some physical disabilities;
- alternative keyboards, which are used by people with certain physical disabilities to simulate the keyboard (including alternate keyboards that use head pointers, single switches, sip/puff and other special input devices.);
- alternative pointing devices, which are used by people with certain physical disabilities to simulate mouse pointing and button activations.
information and sensory experience to be communicated to the user by means of a user agent , including code or markup that defines the content's structure , presentation , and interactions
(L1 + 0.05) / (L2 + 0.05), where
- L1 is the relative luminance of the lighter of the colors, and
- L2 is the relative luminance of the darker of the colors.
Contrast ratios can range from 1 to 21 (commonly written 1:1 to 21:1).
Because authors do not have control over user settings as to how text is rendered (for example font smoothing or anti-aliasing), the contrast ratio for text can be evaluated with anti-aliasing turned off.
For the purpose of Success Criteria 1.4.3 and 1.4.6, contrast is measured with respect to the specified background over which the text is rendered in normal usage. If no background color is specified, then white is assumed.
Background color is the specified color of content over which the text is to be rendered in normal usage. It is a failure if no background color is specified when the text color is specified, because the user's default background color is unknown and cannot be evaluated for sufficient contrast. For the same reason, it is a failure if no text color is specified when a background color is specified.
When there is a border around the letter, the border can add contrast and would be used in calculating the contrast between the letter and its background. A narrow border around the letter would be used as the letter. A wide border around the letter that fills in the inner details of the letters acts as a halo and would be considered background.
WCAG conformance should be evaluated for color pairs specified in the content that an author would expect to appear adjacent in typical presentation. Authors need not consider unusual presentations, such as color changes made by the user agent, except where caused by authors' code.
if removed, would fundamentally change the information or functionality of the content, and information and functionality cannot be achieved in another way that would conform
rendering of the content in a form to be perceived by users
the relative brightness of any point in a colorspace, normalized to 0 for darkest black and 1 for lightest white
For the sRGB colorspace, the relative luminance of a color is defined as L = 0.2126 * R + 0.7152 * G + 0.0722 * B where R , G and B are defined as:
- if RsRGB <= 0.04045 then R = RsRGB/12.92 else R = ((RsRGB+0.055)/1.055) ^ 2.4
- if GsRGB <= 0.04045 then G = GsRGB/12.92 else G = ((GsRGB+0.055)/1.055) ^ 2.4
- if BsRGB <= 0.04045 then B = BsRGB/12.92 else B = ((BsRGB+0.055)/1.055) ^ 2.4
and RsRGB, GsRGB, and BsRGB are defined as:
- RsRGB = R8bit/255
- GsRGB = G8bit/255
- BsRGB = B8bit/255
The "^" character is the exponentiation operator. (Formula taken from [[SRGB]].)
Before May 2021 the value of 0.04045 in the definition was different (0.03928). It was taken from an older version of the specification and has been updated. It has no practical effect on the calculations in the context of these guidelines.
Almost all systems used today to view Web content assume sRGB encoding. Unless it is known that another color space will be used to process and display the content, authors should evaluate using sRGB colorspace. If using other color spaces, see Understanding Success Criterion 1.4.3 .
If dithering occurs after delivery, then the source color value is used. For colors that are dithered at the source, the average values of the colors that are dithered should be used (average R, average G, and average B).
Tools are available that automatically do the calculations when testing contrast and flash.
A separate page giving the relative luminance definition using MathML to display the formulas is available.
dynamic property expressing characteristics of a user interface component that may change in response to user action or automated processes
States do not affect the nature of the component, but represent data associated with the component or user interaction possibilities. Examples include focus, hover, select, press, check, visited/unvisited, and expand/collapse.
- The way the parts of a Web page are organized in relation to each other; and
- The way a collection of Web pages is organized
any software that retrieves and presents Web content for users
a part of the content that is perceived by users as a single control for a distinct function
Multiple user interface components may be implemented as a single programmatic element. "Components" here is not tied to programming techniques, but rather to what the user perceives as separate controls.
User interface components include form elements and links as well as components generated by scripts.
What is meant by "component" or "user interface component" here is also sometimes called "user interface element".
a non-embedded resource obtained from a single URI using HTTP plus any other resources that are used in the rendering or intended to be rendered together with it by a user agent
Although any "other resources" would be rendered together with the primary resource, they would not necessarily be rendered simultaneously with each other.
For the purposes of conformance with these guidelines, a resource must be "non-embedded" within the scope of conformance to be considered a Web page.
Napkin uses visual AI to automate business storytelling
- Share on Facebook
- Share on LinkedIn
Join our daily and weekly newsletters for the latest updates and exclusive content on industry-leading AI coverage. Learn More
Napkin is an AI-based tool for visual storytelling for business people to bring life to their presentations using generative AI.
It comes from Silicon Valley AI veteran Pramod Sharma and Jerome Scholler, who started Osmo more than a decade ago to use AI to bring children’s games to life on iPads. I covered their rise and exit, and Sharma came back to me to do an interview on his next big idea.
Why is it called Napkin? If you have an idea and write it on a napkin — the classic start of many Silicon Valley companies — then it will generate the art and presentation to go with it automatically.
Los Altos, California-based Napkin has created a tool that empowers you to explain your ideas visually with no effort. You write out your text for a business presentation and, using Visual AI, it will quickly turn your text content into visuals and easily adjust the style, colors, fonts, shapes, and design to improve your storytelling impact.
I watched Sharma do a demo and he took text and the tool generated flow charts, pie charts and more to illustrate text ideas. And it wasn’t just generating something perfect every time. Napkin gives you the power to edit everything and make it just right, he said. You can modify titles, captions, and other pieces of an illustration to bring it into something that is more precisely what you want, Sharma said in our interview.
Currently in beta, Napkin works with your current workflow in Google Docs, Slides, Canva, Slack, Word, PowerPoint, Email, Text, and more. No longer do you have to wait for someone who knows what they’re doing to generate prototypes of your presentations. Napkin will continuously introduce new styles and designs to meet your storytelling needs.
In an interview with VentureBeat, Sharma said that we all have ideas, but effectively communicating them and winning people over is no easy feat. As attention spans shrink and we hit peak information overload, how can we best communicate complex ideas? Napkin turns your text into visuals without your having to think about the laborious design complexities.
Napkin is pioneering visual AI that brings impact and fun into business storytelling. It’s designed for the millions of professionals who sell ideas, writers, educators, and content creators, Napkin helps you unlock the visual potential in your text content. And it’s for those of us who may be good writers but are lousy at graphics, presentations or artistry (raises hand).
“With the iPhone, Apple made it dead simple for anyone to take photos. We aim to do the same thing with graphics,” said Sharma. “Visuals are powerful, and we’ve designed Napkin so anyone can easily communicate their ideas through imagery.”
It’s not just about getting rid of jobs or eliminating graphic designers. Rather, Sharma said that it’s more about making design more accessible, enabling you to explain your ideas without spending hours creating the right visual and building it from scratch.
How it works

Here’s how it works:
- Bring Your Text: Paste your existing text content or generate text from an AI prompt.
- Generate Visuals: Click the “spark icon” on any part of the text, and Napkin will transform your content into recommended visuals. Within a few seconds, you’ll have a variety of visuals to choose from.
- Customize: With Napkin’s built-in editing tool, you can adjust font, color, shape, design, and more to meet your style or brand guidelines.
- Embed into Your Workflows: As simple as copying and pasting, you can simply take Napkin’s visuals into any place you like: Google Slides/Docs, Microsoft Word/PowerPoint, Substack, Medium, Slack, Notion, Canva, LinkedIn, X, Instagram and more.
- Use it in a Diversity of Use Cases: Create high-quality visuals suitable for presentations, blogs, pitch decks, social content, newsletters, data and research reports, customer communications, and more.
“As someone without design skills, Napkin is super easy and convenient. Whether I need a quick diagram for a blog post or a chart for a presentation, Napkin generates exactly what I’m looking for within seconds,” said Jason Miller, COO of Sprouts.ai, in a statement. “Before Napkin, we were constrained regarding what graphics we could access. Now, with Napkin, we have a designer at our fingertips, offering unlimited access to enhance our business storytelling with visuals while achieving significant cost and time savings.”
Instant visuals to amplify storytelling
Napkin’s vast design catalog already includes more than 30 visual design categories, such as mind maps, flow charts, Venn diagrams, bar charts, and more.
Napkin’s team of NLP, AI, and computer vision developers, who hail from Amazon, Microsoft’s Research Lab, GitHub, Google, and Osmo, is hard at work supporting more powerful customizations and unique categories, which they will continue to launch in the coming weeks and months.
Scholler and Sharma sold their previous company, Osmo, whose reflective AI is used by millions of kids and classrooms and is integrated into products with Disney and Mattel’s Hot Wheels. Byju’s acquired it for $120 million in 2019.
Inspiration

In a blog post, Sharma said effective communication is crucial in the workplace, whether you’re pitching an idea, explaining complex concepts, or brainstorming new strategies. How do you make sure that your vision is understood and appreciated by others? This challenge inspired the team to build Napkin AI.
“We all have great ideas, but sharing them effectively can be a struggle. At Osmo, an AI gaming company Jerome and I founded almost a decade ago, we delighted millions of kids by making learning fun,” Sharma wrote. “Yet, as leaders, we often found ourselves drowning in documents, 100-slide decks, and long research papers. Occasionally, we’d come across a rare visual that truly captured the essence of an idea, sparking those “aha” moments of clarity. We realized that visuals are powerful communication tools, yet they are rarely used.”
He added, “We started wondering why so few people use visuals when they’re such powerful tools for communication. Our theory is that, from an early age, we’re trained to rely on writing. Text editors make it easy for everyone to collaborate and share their thoughts. However, creating visuals is time-consuming and requires skills many of us don’t have. As a result, most people stick to writing, even though visuals can provide a clearer, more impactful perspective of an idea. This is especially true in professional settings where effective communication is very important.”
At Osmo, he said the founders spent a lot of time on communication, reading proposals, writing talks, creating slides, doing research papers, and communicating back and forth.
“It’s very daunting to consume all that information. And as we were looking into it, we realized that one thing we always loved about communication was visual.”
“We realized it’s incredibly hard to make good pictures of things that you’re talking about,” he said. “Most people have been using generative AI for and for social media. That seems like where everybody gravitated at first.”
But the founders thought small business and the enterprise were the right way to go with AI visuals. The graphics can get pretty complex with interactivity. You can specify boundaries of what you want before you submit the idea to the AI.
“We realized is most people know how to write but they don’t know how to create a visual,” Sharma said.
But making this look easy is the hard part.
The team is small with 11 people and they spent more than a year and a half working on tools.
“We realized that most people don’t have the layer of creativity or the time to come up with something,” Sharma said. “Very few people can actually start from scratch. And only in our third generation did we realize that what people really want is AI.”
“It’s extremely hard. We are building something almost like a visual engine. I give you bunch of information, and you create the right graphic and dynamically create graphics,” Sharma said.
Rather than produce wild and imaginative art, Napkin focuses on visuals for information. It’s not Salvador Dali.
“We’re trying to complement the written content,” Sharma said.
The first version of an AI tool came in the form of a sketching tool to make simple diagrams with your mouse. However, the team quickly discovered that even with the best AI helping in the background, users don’t want to sketch live with a mouse.
In the second version, the creators introduced a database of visual frameworks like Venn diagrams and pie charts. Users could focus on finding a visual to use that matched their ideas, instead of sketching. But they discovered that many people don’t know which visuals to use or how to use them effectively, even if they have access to them.
Finally, the introduction of Large Language Models (LLMs) provided the perfect complement to the team’s efforts. They focused on transforming text into visuals automatically, meeting users where they are most comfortable – writing text. This marked the birth of the Napkin AI you see today.
Looking Ahead

Just as the iPhone made it easy for anyone to take high-quality images, Napkin AI’s mission is to make visual communication easy and accessible to everyone, Sharma wrote.
“We understand it’s a really hard problem, and we have just started, but we are excited about the progress we’ve made so far. We believe we can achieve our mission by focusing on two core principles: deeply understanding text content and generating a wide range of relevant and high-quality visuals,” he wrote.
Accel and CRV are the investors in the project. You can write them at [email protected] and join the beta at napkin.ai.
Stay in the know! Get the latest news in your inbox daily
By subscribing, you agree to VentureBeat's Terms of Service.
Thanks for subscribing. Check out more VB newsletters here .
An error occured.
More From Forbes
The missing ingredient of a powerful story: a visual narrative.

- Share to Facebook
- Share to Twitter
- Share to Linkedin
Bob Pearson, Chair, The Next Practices Group and The Bliss Group .
We live in a world driven by text-based narratives with brains that are tuned for a visual experience.
About two-thirds of people claim to be visual learners. Whatever the exact percentage really is, there is plenty of evidence to support this belief.
Our growing preference is to query a search engine verbally. As of 2017, YouTube alone reports more than 1 billion hours of video watched per day. We know our brains process images in as little as 13 milliseconds , which is much faster than how we process texts or writing of any kind.
In other words, how companies communicate today is not ideal for human brains.
Creating Visual Narratives
When we write a narrative for a company or brand, we spend significant time getting the writing correct. We obsess over the words, the channels our story will appear in, who the spokesperson will be and exactly what message we will release each time. We imagine our story building momentum over time. This is great, keep it up.
What is missing, however, is arguably equally or more powerful. I think of it as the long-lost cousin of text.
Our world is filled with video, data visualization, animation, photos, slides, screenshots, comics, GIFs, charts and infographics. Many choices, but one big problem: Visual content is often viewed as an accessory to our storytelling. It may help at the moment, but it can end up creating visual noise in the marketplace.
The most powerful narratives of the future will need to combine text and visual content in new ways that cut through the clutter, impact our subconscious and enable us to reach a world with many distractions. Text and video need to be one team, not two sorts of related initiatives.
In building stories ready for today’s audience, I believe a well-done visual narrative will have at least five key components:
1. Your Anchor Image/Memory: We often remember a visual image more than text. What is the memory that we want our customers to remember about a topic, brand or company? How well are we reinforcing this visual aspect of our story?
2. How You Unlock Interest/Impact: Are we looking to create an emotional bond that could be one of excitement, surprise or even fear? What is our goal?
3. Message Alignment/Consumption: How will our customers, current or future, be introduced to the visual part of our story? Will it reinforce the exact message we are aligning it with? If they do a search and only receive visual content, will it tell just as powerful a story or just look like a bunch of cool stuff?
4. Rationale/Role: People can get burned out by too much repetition of a message. How can we use visual content to provide a much-needed break for those we are trying to reach?
5. Urgency And Timing/Comprehension: We interpret information faster visually than via written content. Depending on the circumstances, we may want to lead with visual content due to the urgency of getting an important message across.
Technology can help with this process of telling stories visually, such as new storytelling platforms like Shorthand that are built to combine visual content that can improve the reach of a story.
It’s important to ask yourself when analyzing an audience: How can you show the same story in different ways across channels (such as Facebook, YouTube, Pinterest or Forbes )? This way, you can work to reinforce your narrative rather than repeating it in the same way on each channel.
People have personalities, and so do the channels they spend time on. They expect brands to have one too and show up to match the mindset they are in for each channel.
Steps To Get Started With Visual Narratives
The big takeaway for the business community is simple. Your story should be equally strong in its use of words and images. Whether you embrace this concept or you are a skeptic, do yourself a favor and try these things:
• Conduct an informal audit of how your brand, company or leader shows up online visually.
• Ask yourself if you are showing up most powerfully visually.
• Think of the 15 to 20 most common ways to create visual content and ask why you are not using many of these options.
• Study how visual content is either improving or decreasing engagement.
The list goes on.
Before you know it, you will likely realize you aren’t creating the best memories your company or brand is capable of producing. You are not using visual content in times of urgency to get across a message with more speed. And you have yet to build that elusive rhythm that creates powerful, long-lasting narratives.
I am confident the answer is not to do what you did for your last campaign.
Our media world is rapidly evolving, as is generative AI, which will make it easier than ever for our customers to decide how they want to learn about us. A touch of a screen will turn today’s white paper into tomorrow’s pictograph or audio abstract. A new app will analyze how a brand advertises nationally and answer the two or three questions we asked and deliver it in the format of our choice.
And that is really the key. If we know our brains love to learn about concepts visually, and we know technology is making this easier than ever to do, why not get ahead of the curve and prepare for how tomorrow’s story will be received most effectively?
Now, if only you could just touch this story and turn it into an audio abstract in Spanish that we can send to friends in Mexico. Maybe next time you will be able to.
Forbes Communications Council is an invitation-only community for executives in successful public relations, media strategy, creative and advertising agencies. Do I qualify?

- Editorial Standards
- Reprints & Permissions
Napkin turns text into visuals with a bit of generative AI

We all have ideas, but effectively communicating them and winning people over is no easy feat. So how can we best accomplish this in an era of information overload and shrinking attention spans?
If you’re engineers Pramod Sharma and Jerome Scholler, you use Napkin , a new “visual AI” platform that the two built together. Napkin is launching out of stealth today with $10 million in funding from Accel and CRV.
Napkin was born out of Sharma’s and Scholler’s frustration with the endless number of documents and presentation decks that have become the norm in the corporate world. Before starting Napkin, Sharma, an ex-Googler, founded educational games company Osmo . Scholler was on Osmo’s founding team and, before that, had stints at Ubisoft, LucasArts and Google.
“Napkin’s core product is targeted toward marketers, content creators, engineers and professionals in the business of selling ideas and creating content,” Sharma told TechCrunch. “The goal is to minimize the time and headache of the design process by turning it into a mostly generative flow.”
“Generative” refers to generative AI. Yes, Napkin’s yet another company betting on the potential of the tech and joins a long, long list. But a few things stand out about the experience, which is strictly web-based for now.
With Napkin, users begin with text — a presentation, outline or some other document along those lines — or have the app generate text from a prompt (e.g. “An outline for best practices for a hiring interview”). Napkin then creates a Notion-like canvas with that text, then appends a “spark icon” to paragraphs of text that, when clicked, transform the text into customizable visuals.
These visuals aren’t limited to images, spanning different styles of flowcharts, graphs, infographics, Venn diagrams and decision trees. Each of these images contains icons that can be swapped out for another in Napkin’s gallery, and you get connectors that can visually link two or more concepts, too. The colors and fonts are editable, and Napkin offers “decorators” such as highlights and underlines to spruce up any element’s appearance.
Once finished, visuals can be exported as PNG, PDF or SVG files, or as a URL that links to the canvas where they were created.
“Unlike existing tools that are adding a generative component to an existing editor, we focus on generation-first experience where editing is added to complement the generation and not other way round,” Sharma said.
I took Napkin for a brief spin to get a sense of what it could do.
At the document creation step, out of a sense of morbid curiosity, I tried to get Napkin to generate something controversial, like “Instructions to murder someone” or “A list of extremely offensive insults.” Whatever AI Napkin is using wouldn’t tell me how to commit murder, but it did comply with the latter request — albeit with an addendum about how the insults were “intended for educational purposes.” (There’s a button in the canvas screen to report this type of AI misbehavior.)
Mischief managed, I threw a TechCrunch article into Napkin — a draft of this one to be precise. And, well, it quickly became apparent where Napkin’s strengths and weaknesses lie.
Napkin does best with simple descriptions, broad strokes of ideas, and narratives with clearly established timelines. The simplest way to put it is, if an idea reads like it could be better illustrated in a visual, Napkin will more often than not rise to the occasion.

When the text is a bit more nebulous, Napkin grasps at straws, sometimes generating visuals that aren’t grounded in that text at all. Take a look at the one below, for example – it verges on nonsensical.

For the visual below, Napkin invented pros and cons out of whole cloth (as generative models are wont to do ). Nowhere in the paragraph did I mention privacy issues or Napkin’s learning curve.

Napkin occasionally suggests images or artwork for visuals. I asked Sharma if users might have to worry about the copyright implications of these, and he said that Napkin doesn’t use any public or IP-protected data to generate pictures. “It’s internal to Napkin so users don’t have to worry about rights on generated content,” he added.

I couldn’t help but notice that Napkin’s visuals all abide by a pretty generic, homogenous design language. Some early users of Microsoft’s generative AI features for PowerPoint have described the results from that software as “high school-level,” and the Napkin demo couldn’t help but bring those comments to my mind.
That’s not to suggest some of this isn’t fixable. It’s still early days for Napkin, after all — the platform has plans to launch paid plans, but not anytime soon — and the team is a bit resource-constrained by its size. There’s 10 people at Los Altos-based Napkin at present, and it plans to grow to 15 by the end of the year.
Moreover, few could suggest that Sharma and Scholler aren’t successful entrepreneurs, having sold Osmo to Indian edtech giant Byju’s for $120 million in 2019. Accel’s Rich Wong backed Napkin partly because he was impressed by Osmo’s exit — Wong was also an early investor in Osmo.
“Jerome and Pramod have an uncanny ability to take something incredibly challenging from a technical perspective and make it easy for users,” Wong said in a statement. “As a partner to their first company, Osmo, we watched them bring their vision for a new play movement to life with reflective AI. We are excited to support this new chapter as Napkin brings visual AI to business storytelling.”
Sharma says the proceeds from the $10 million round will be put toward product development and hiring AI engineers and graphic designers.
“All of our energy and resources will be going toward how Napkin can generate the most relevant and compelling visuals given text content,” he said. “There are endless ways to visualize and design. We are investing capital on building this depth and improving AI quality.”
More TechCrunch
Get the industry’s biggest tech news, techcrunch daily news.
Every weekday and Sunday, you can get the best of TechCrunch’s coverage.
Startups Weekly
Startups are the core of TechCrunch, so get our best coverage delivered weekly.
TechCrunch Fintech
The latest Fintech news and analysis, delivered every Tuesday.
TechCrunch Mobility
TechCrunch Mobility is your destination for transportation news and insight.
The defense tech acquisition spree has begun: Autonomous factory startup Hadrian acquires Datum Source
Hadrian announced they bought Datum Source, a software company founded by SpaceX alums that uses AI to help hardware companies find manufacturing partners.

Apple finally allows Spotify to show pricing info to EU users on iOS
Spotify will be able to display the pricing for things like Spotify subscriptions and digital goods, including Spotify’s more recently added collection of audiobooks.

India’s top court clears way for Byju’s insolvency proceedings
India’s Supreme Court has cleared the way for insolvency proceedings to be resumed against Byju’s in a win for U.S. creditors.

xAI releases Grok-2, adds image generation on X
Elon Musk-owned launched Grok-2 and Grok-2 mini in beta today with improved reasoning. The new Grok AI model can now generate images on the X social network, though Grok access…

Google faces headwinds as it brings Pixel 9 to India
Google Pixel 9 series India launch coincides with the expansion of its sales channels and after-sales support in the country.
Zepto raises $340M at a $5B valuation as India’s quick-commerce market heats up
General Catalyst and Mars Growth Capital are co-leading the Series G round, which will be closed within a few days, sources familiar with the deal told TechCrunch.

Made by Google 2024: All of Google’s reveals, from the Pixel 9 lineup to Gemini AI’s addition to everything
Let’s dive right into what the Google Pixel 9 lineup looks like, how Google’s Gemini AI will be incorporated in the devices, and more.
Made by Google 2024: A few AI features you might’ve missed
We rounded up some of the more intriguing AI-related announcements that didn’t get a ton of play, like Pixel Studio.

Thiel’s Gawker takedown could be coming to a theater near you
Ben Affleck and Matt Damon have acquired a screenplay called “Killing Gawker,” which presumably delves into billionaire VC Peter Thiel’s campaign to bury the media outfit for posting excerpts from…

Gemini Live first look: Better than talking to Siri, but worse than I’d like
Google launched Gemini Live during its Made by Google event Tuesday. The feature allows you to have a semi-natural spoken conversation, not typed out, with an AI chatbot powered by…

Texas sues GM, saying it tricked customers into sharing driving data sold to insurers
Texas filed a lawsuit Tuesday against GM over years of alleged abuse of customers’ data and trust. New car owners were presented with a “confusing and highly misleading” process that…

Chinese robotaxi startup WeRide gets approval to carry passengers in California
Chinese autonomous vehicle company WeRide has received the green light to test its driverless vehicles with passengers in California. The step comes as WeRide begins the process to go public…

Winning a gold medal is a lot like being a VC, according to Olympic champion Kristen Faulkner
Kristen Faulkner astonishing Olympic success of two gold medals stems from lessons learned from her former career as a venture capitalist, she says.

California AI bill SB 1047 aims to prevent AI disasters, but Silicon Valley warns it will cause one
SB 1047 has drawn the ire of Silicon Valley players large and small, including venture capitalists, big tech trade groups, researchers and startup founders.

The first post-quantum cryptography standards are here
For many companies, this also means that now is the time to start implementing these algorithms.

UAW files federal labor charges against Trump, Musk for intimidating workers at X Spaces event
The United Auto Workers union said Tuesday that it filed federal labor charges against Donald Trump and Elon Musk. The union alleges that Trump and Musk attempted to “threaten and…

Pixel Watch 3 adds a life-saving ‘loss of pulse’ detection feature
With the introduction of the Pixel Watch 3 smartwatches, which now come in two sizes, Google is also introducing a new, potentially life-saving feature: loss of pulse detection. At the…

Google’s Made You Look uses Pixar characters to trick kids into smiling for the camera
Made You Look will be available on the Pixel 9 Pro Fold when it launches next month.
Made by Google 2024: How to watch Google unveil the Pixel 9, a new foldable and more
Made by Google 2024 kicks off at 10 a.m. PT on August 13. Get ready for a slew of new hardware, including the Pixel 9 and a new foldable.

Pixel phones get an AI-powered weather app
With the new app, users “won’t have to scroll through a bunch of numbers to get a sense of the day’s weather,” according to Google.
Threads may offer its own take on Fleets with a disappearing posts feature
Meta has been spotted working on a new feature that would allow a post — as well as all its replies — to disappear in 24 hours.

Tesla posts job listing for the 1950s-style diner Elon Musk has proposed building
In line with Elon Musk’s increasing rhetoric on X of going back to the good old days, Tesla looks like it’s finally getting ready to open its 1950s-style diner. Tesla…

Google adds new AI-powered features for photo editing and image generation
Google is adding features for photo editing, plus new apps for storing and searching through screenshots on-device and an AI-powered studio for image generation.
Google’s Pixel Buds Pro 2 bring Gemini to your ears
The $229 Pixel Buds Pro 2 start shipping September 26.

Google Gemini is the Pixel 9’s default assistant
At Made by Google 2024, the company announced that the new Pixel 9 phones are the first devices to ship with Gemini as the assistant by default.

Google’s Pixel Watch 3 comes in two sizes
In addition to the Pixel Watch 3’s 41mm model, the smartwatch will also be available in 45mm.
Gemini Live, Google’s answer to ChatGPT’s Advanced Voice Mode, launches
Gemini Live lets users have “in-depth” voice chats with Gemini, Google’s generative AI-powered chatbot, on their smartphones.

Google’s Pixel 9 line offers more size options, better cameras and Gemini by default
The Pixel 9 starts at $799, the Pixel Pro at $999 and Pixel 9 Pro XL at $1,099. Preorders open Tuesday.
Google’s $1,799 Pixel 9 Pro Fold arrives with 8-inch inner display and Gemini
Time will tell whether the new “Pro” bit in Pixel 9 Fold presages the arrival of a lower-cost foldable, or if it’s simply a nod to the high-end pricing.
US appeals court rules geofence warrants are unconstitutional
The U.S. Appeals Court for the Fifth Circuit said geofence search warrants are “categorically prohibited” under the Fourth Amendment.

COMMENTS
9. Add fun with visual quizzes and polls. To break the monotony and see if your audience is still with you, throw in some quick image quizzes or polls. It's like a mini-game break in your presentation — your audience gets involved and it makes your presentation way more dynamic and memorable. 10. Use visuals wisely.
Understanding SC 1.4.5: Images of Text (Level AA) Images of Text (Level AA) Success Criterion (SC) If the technologies being used can achieve the visual presentation, text is used to convey information rather than images of text except for the following: Customizable. The image of text can be visually customized to the user's requirements;
Exercise 2. In this exercise, you will begin to develop visual aids for your presentation. Complete the steps in this exercise—and enjoy the chance to be creative. Working with visuals can be a pleasant way to take a break from the demands of writing. Revisit the ideas you developed in Note 14.24 "Exercise 1".
The visual presentation of text and images of text has a contrast ratio of at least 4.5:1, except for the following: . Large Text. Large-scale text and images of large-scale text have a contrast ratio of at least 3:1; . Incidental. Text or images of text that are part of an inactive user interface component, that are pure decoration, that are not visible to anyone, or that are part of a ...
4. Visual contrast technique: Images and text Alternating elements. Balance text with impactful images, icons, or graphics. This adds visual interest and makes it easier for the audience to digest (compared to crowded, text-only slides). For example, infographics can help audience members process complex content.
The visual presentation of text and images of text has a contrast ratio of at least 4.5:1, except for the following: Large Text: Large-scale text and images of large-scale text have a contrast ratio of at least 3:1; Incidental: ...
The best way to make sure the attention stays on you is to limit word count to no more than 10 words per slide. As presentation expert Nancy Duarte says "any slide with more than 10 words is a document.". If you really do need a longer explanation of something, handouts or follow-up emails are the way to go.
9. Remove the Text that is Not Relevant to the Core Message. To make your slides crisp and concise, remove all the information that doesn't add value to the core message. Include only those points that support the goal of your presentation and are absolutely required to make your audience understand the concept.
These kinds of visual aids can negatively affect your presentation. Let's look at some examples: You're trying to convince the board to support a new product idea. Your slides are made up of graphs, numbers, and blocks of text from top to bottom, and board members spend most of their time reading the slides instead of listening to you. The result?
The objective of this technique is to demonstrate how CSS can be used to control the visual presentation of text. This will allow users to modify, via the user agent, the visual characteristics of the text to meet their requirement. The text characteristics include aspects such as size, color, font family and relative placement.
These tips can be useful because they can be applied to all your presentations in general. Step 1 is to ask yourself who your audience is and how to convey the key message you have in mind to them. Once you settle on your message, you can start designing your slides with that direction in mind. You may wonder how to connect with an audience ...
To do this, use the full range of presentation design tools available to you. Images, backgrounds, and text boxes themselves can be used in a variety of ways to create slides that catch and hold your audience's interest. Mix up your layouts and your presentation will feel both dynamic and informative. 6. Let your audience take a breath
Emphasize key points with text and images. Label your slides to prompt your memory. 1. Include less text and more visuals in your presentation design. According to David Paradi's annual presentation survey, the 3 things that annoy audiences most about presentations are: Speakers reading their slides.
In a PowerPoint presentation, it is important that your presentation is visually stimulating, avoids information overload by limiting the text per slide, uses speaker notes effectively, and uses a font that is visible on the background (e.g., avoid white letters on a light background or black letters on a dark background).
Presentation Example #7: Visual Hierarchy. When we say visual hierarchy, we mean that the elements need to be organized in order of importance. In this specific example we're focused more on the presentation text rather than design. Pay attention to how the header text and body content differ.
Clutter. Keep your presentation's design and contents relatively simple. Include spaces between lines of text. Include spaces between images or other visual elements. Make sure that the text is readable. Use simple graphics. If you overload the screen, your audience will feel overwhelmed, and they won't be able to follow your ideas.
If you feel like it takes you forever to find visuals and/or add them to your presentations, then make sure you read that blog post next. 2. Use icons for your presentation slides. Icons are one the easiest and fastest ways to add visuals to your slides. They're a great place to start if your slides are mostly text.
1) Cut down text on slides. Bullet-point filled slides have been plaguing audiences since PowerPoint began. But they aren't just painfully dull: bullet points are really ineffective for communicating information to an audience. So, the easiest way you can quickly make your presentation 1000 times better is by simply cutting out some of the ...
The Wizard of Oz Hamilton. Steps to Make Connections between the Text of a Story or Drama and a Visual or Oral Presentation of the Text. Step 1: Read or listen to the text carefully and identify the main events, characters, settings, descriptions, and directions in the story or drama.
Presentation visuals are one of the most compelling parts of a presentation. Some presenters underestimate the importance of a visual presentation and decide to only speak, or use text slides to back up what they're saying. This is a huge mistake - effective visual presentations can have a massive positive impact on your viewers.
Types of Visual Presentation Examples. Some possible visual presentations include infographics, charts, diagrams, posters, flipcharts, idea board, whiteboards, and video presentation examples. An infographic is a collection of different graphic visual presentations to represent information, data, or knowledge intended more visually quickly and ...
Discover the power of Visual Communication in conveying the information using different visual elements. Learn about why it matters & how to use in workplace. ... Google Slides, and Prezi allow users to set up visually appealing presentations with text, images, and animations that deliver ideas effectively. 3.
Visual aids are crucial to the 65% of people identified as visual learners. Instead of using unrelated stock images merely to break up text, reinforce your message with strategic visuals woven ...
Here at Visme, we're excited to tell you that you can easily record your own voice over right within this online presentation design tool. This allows you not only to create self-running presentations or stand-alone slide decks but also narrated software tutorials, audio presentations and visual stories with narration.
This company profile template is a perfect framework for providing a comprehensive overview of your tech startup to investors or clients. The presentation features a stylish purple background with white and pink text, ensuring optimal visibility and clarity. It also offers ample space to showcase your business without overcrowding the text.
The visual presentation of the following have a contrast ratio of at least 3:1 against adjacent color(s):. User Interface Components Visual information required to identify user interface components and states, except for inactive components or where the appearance of the component is determined by the user agent and not modified by the author;
You write out your text for a business presentation and, using Visual AI, it will quickly turn your text content into visuals and easily adjust the style, colors, fonts, shapes, and design to ...
Text and video need to be one team, not two sorts of related initiatives. In building stories ready for today's audience, I believe a well-done visual narrative will have at least five key ...
Death by PowerPoint - we've all experienced it. Slide after slide of bullet points, dense text, clipart and irrelevant visuals. As someone who needs to communicate a key message with impact ...
With Napkin, users begin with text — a presentation, outline or some other document along those lines — or have the app generate text from a prompt (e.g. "An outline for best practices for a ...