Membranes I: Structure and function of biological membranes
by Nathan H Lents, Ph.D., Donna Hesterman
Listen to this reading
Did you know that Benjamin Franklin’s 1774 experiments with pouring oil onto a pond of water was an early step in gaining a scientific understanding of cell membranes? Cell membranes were thought to be passive barriers until the 1960s, but we now know that they are active and responsive structures that serve a critical function as gatekeepers and communicators.
The outer layer of a cell, or a cell membrane, is a complex structure with many different kinds of molecules that are in constant motion, moving fluidly throughout the membrane.
Cell membranes form selective barriers that protect the cell from the watery environment around them while letting water-insoluble molecules like oxygen, carbon dioxide and some hormones pass through.
Most of the cell membrane is formed by phospholipids that have a unique structure that causes them to self-arrange into a double layer that is hydrophobic in the middle and hydrophilic on the outside.
From the time cells were first discovered in the mid-1600s, scientists knew that there must be some sort of outer wrapping around the cell to hold the contents of the cell together. Although it was too thin for them to see with simple light microscropes, scientists called this outer wrapping a membrane (in Latin, membrana ), which means a thin layer of skin or tissue. From the 17 th century until around the 1960s, the outer membrane of cells was thought to be a simple passive barrier. We now understand that the plasma membrane is a very dynamic part of the cell and that is much more than just a barrier. Yes, it does restrict many molecules from entering (or leaving) the cell, but it is also designed so that some molecules can very quickly move through the membrane, and thus enter or leave the cell with ease.
- Membrane structure
Our scientific understanding of membranes began with the American statesman Benjamin Franklin . In 1774, Franklin observed the effects of oil on a surface of water and found that the oil does not mix with the water but rather spreads over the water’s surface to create a thin film:
I fetched out a cruet of oil and dropped a little of it on the water. I saw it spread itself with surprising swiftness upon the surface… Though not more than a teaspoonful, produced an instant calm over a space several yards square which spread amazingly and extended itself gradually till it reached the [other] side, making all that quarter of the pond, perhaps half an acre, as smooth as a looking glass.
More than a century later, in 1890, Lord Rayleigh repeated Franklin’s experiments while studying at Cambridge University in England. He and other scientists developed tools and mathematical methods for calculating the surface area covered by the oil film. Although these early studies didn’t directly focus on membranes or even cells , they were very important because they described the repulsion that occurs when water-insoluble fluids , such as oil, come in contact with water. It was this insight – that oil and water repel each other – that led scientists to wonder if the cell membrane might somehow be made of a substance that repels water. This way, it could keep fluids outside the cell from passing through, while also preventing the fluids inside the cell from leaking out. The fact that, when viewed under a microscope, animal cells look similar to spheres of oil helped to popularize the view that cells were somehow surrounded by an oily film.

Comprehension Checkpoint
- Discovering membrane structure
It took several more decades before scientists came to understand the structural features of the membrane that allow it to repel water. This understanding came in three major steps. First, chemists observed that all known types of cells contain molecules called lipids that are hydrophobic , or water-insoluble . If cells are mostly water, how do they also contain water-insoluble things? Scientists then imagined that maybe a water-insoluble outer surrounding might be the answer. If the outer membrane was made of water-insoluble lipids, the membrane would restrict water and water-soluble molecules from passing through, while hydrophobic molecules (water-insoluble) could pass through the membrane. They had further evidence to back up this idea – oxygen gas is hydrophobic but can pass through cell membranes easily.
The second major advance came in 1931 with the invention of the electron microscope, which resolved a six-year debate in the scientific community. In 1924, two competing scientists came up with opposite conclusions about the structure of the membrane . A Danish-American scientist named Hugo Fricke performed calculations involving the surface area of those cells , and their capacity for electric charge . Based on these calculations, he found that the layer of lipids surrounding the cell is 3.3 nm thick (Fricke, 1924). Although his measurements were dramatically accurate, lack of understanding of the structure of lipids led him and others to the conclusion that the layer of lipids around the cell could only be one layer thick. Meanwhile, two Dutch scientists, Evert Gorter and François Grendel approached the question a different way. They extracted all of the lipids from a sample of red blood cells and allowed them to spread out on a watery surface, much like Ben Franklin had done with the oil. They found that when the lipids spread out as one layer, the area that they covered was almost exactly twice the surface of the red blood cells themselves (Gorter & Grendel, 1925). Thus, Gorter and Grendel concluded that the lipid surface surrounding the cells must be two layers. It turns out that the limited technology of the time led to two major errors in their work. First, they did not completely extract all of the lipids from the red blood cells. Second, they underestimated the surface of the red blood cell because they were unaware of its double-concave shape. However, the two mistakes acted to cancel each other out almost exactly and their conclusions were correct.
When the electron microscope was invented in 1931 by the German scientists Max Knoll and Ernst Ruska, two thin lines could easily be seen surrounding all cells (Knoll & Ruska, 1970). This was dramatic and convincing evidence that the membrane consists of a double layer of lipids . Even more dramatically, the electron microscope revealed that the cell membrane also had visible structures embedded in it (Figure 1).

Figure 1: An electron micrograph showing the double-membrane.
The third advance in the understanding of membranes came when it was realized that the membrane is a “fluid” structure in which component molecules are in constant and rapid motion. Although several key measurements and experiments contributed to this breakthrough in our understanding, perhaps the most dramatic was a cell fusion experiment conducted by Larry Frye and Michael Edidin at Johns Hopkins University in 1970 (Frye & Edidin, 1970). For this clever experiment, the scientists grew human cells in one dish and mouse cells in another. They used a technique, brand new at the time, to attach a fluorescent labels to some of the proteins on the outside of cells. They labeled some of the proteins in the human cells with a fluorescent blue dye, while labeling the proteins on the mouse cells with a red dye. Then, they used a virus to trick the cells into fusing together. These hybrid cells that were half human, half mouse did not survive for very long, but they did live just long enough to show us something about membranes. At first, just after the cells had fused, all of the blue label was segregated on one half of the hybrid cell, while the red label was on the other half. However, very, quickly, the labels began to intermix with each other and within 40 minutes, the blue and red labels were evenly distributed throughout the surface of the hybrid cell (Figure 2).

Figure 2: The hybrid cell experiment showed that proteins moved fluidly around the membrane.
The quick mixing of the fluorescent labels means that the proteins that are on the surface of the cell are not fixed in place – they can and do diffuse rapidly around the exterior of the cell, while still being embedded in the plasma membrane . This realization led to the development of the fluid-mosaic model of membrane structure, which was first fully articulated by S. J. Singer and Garth L. Nicolson in 1972 (Singer & Nicolson, 1972). Singer and Nicolson explained the plasma membrane as a bilayer, two layers of lipid molecules , with protein molecules embedded in the layers. They compared this to a mosaic of colored tiles that are inlaid to form a design or picture. However, in this case, the tiles are the molecules of lipid and protein, and they are not fixed in place – they move about through diffusion . Another way to imagine the surface of the membrane is to picture the surface of the ocean on a rough and windy day. The lipid molecules are like the ocean water and the proteins are bobbing around like “icebergs…floating in a sea of lipid” (Singer & Nicolson, 1972). See Figure 3 to see an illustration of the concept.

Figure 3: Cell membrane proteins float in a sea of phospholipids.
- Amphipathic nature of cell membranes
Since 1972, we have learned a great deal about the molecular components of biological membranes and our current understanding of the very complex and dynamic nature of membranes is a far cry from the static film that was once imagined. By far, the most important structural feature of the membrane is the amphipathic nature of the lipids that make up the bulk of the membrane. It turns out that the lipids that comprise membranes are not purely hydrophobic . These special lipids have a charged phosphate group at one end which makes this region of the molecule water-soluble, or hydrophilic .
Thus, these phospholipid molecules have water-soluble head groups and water-insoluble tail groups, creating an amphipathic overall structure (Figure 4). Soaps and detergents are also amphipathic, which not only explains how they dissolve easily in water, but also how they dissolve oils and greases in water, the key to their effectiveness as cleaning agents.

Figure 4: The unique structure of the phospholipids that make up the cell membrane causes it to be amphipathic.
The amphipathic nature of the phospholipid molecules is important because it explains how these molecules establish a two-layered membrane . Two rows of lipid molecules self-assemble in opposite orientations (Figure 5). The hydrophobic tail regions tuck together to create a water-free inner environment, and the hydrophilic head regions face outward where they are free to interact with water, the principle solvent both inside and outside of cells .

Figure 5: Phospholipids arrange themselves so that the hydrophobic tails are end-to-end and the hydrophilic heads point outward toward the cell exterior on one side and the cell interior on the other.
- Types of molecules in cell membranes
But membranes are more than simple bilayers. The experiment by Frye and Edidin involved proteins that float in the plasma membrane . It turns out that the membrane has many different kinds of molecules floating in it, not just proteins. For example, most animal cell membranes contain cholesterol, a completely different kind of lipid. Cholesterol functions to regulate the fluidity of the membrane and also prevent freezing and cracking of the cell membrane at low temperatures. (That animal cells have cholesterol in their membranes but plant cells do not explains why all cholesterol in our diets come from animal products, not plant ones.) In addition, some lipid groups have the phosphate head group replaced by a carbohydrate group. These are called glycolipids. Similarly, some of the proteins that are in membranes also have carbohydrate groups attached to them and are called glycoproteins. Both glycolipids and glycoproteins are important “cell markers” used by cells to identify themselves to other cells.
Some proteins are fully integrated into the membrane and are called integral membrane proteins or transmembrane proteins, since they “span” both layers of the membrane. Transmembrane proteins are useful to the cell because they can interact with molecules on the outside of the cell and relay information about the extracellular environment to the interior of the cell. Other proteins are more loosely attached on the inside or outside of the membrane and are called peripheral membrane proteins. Peripheral membrane proteins are often used by the cell during signal transduction – the process by which a cell responds to a signal from another cell. In addition, while most proteins are free to float around the membrane as we saw with the hybrid cell experiment , some proteins are attached to part of the cytoskeleton and are thus anchored in one place. This anchoring can serve as a crucial structural component of the cell and its attachment to other cells or to the tissue matrix. Figure 6 below gives a more complete picture of the many kinds of molecules that are found in biological membranes.

Figure 6: Many types of proteins are mingled throughout the cell membrane.
As explained in our module The Discovery and Structure of Cells , the outer plasma membrane is not the only membrane in the cell . Many interior organelles have membranes as well, including the nucleus , mitochondrion, chloroplast , endoplasmic reticulum, Golgi body, lysosome and peroxisome. These membranes are all very similar. They all are composed of a sea of phospholipids with proteins and other components floating within. The main differences are that the specific phospholipids that make up the membranes are somewhat different and the floating components within the membranes are different. Each organelle, including the plasma membrane , has a unique signature of proteins floating in the phospholipid bilayer.
- Membrane Function
Now to the question of what the plasma membrane actually does. First and most obvious is that the plasma membrane is indeed a selective barrier. It allows the chemical activities inside the cell to proceed mostly undisturbed by events outside the cell. The famous cell biologist Gerald Weissmann emphasized the importance of this role:
In the beginning, there must have been a membrane! Whatever flash of lightning there was that organized purines, pyrimidines, and amino acids into macromolecules capable of reproducing themselves it would not have yielded cells [except] for the organizational trick afforded by the design of a membrane wrapping.
The lipid nature of the membrane allows it to serve as a good barrier. Lipids are water-insoluble and repel water, thus they are an ideal medium to separate the watery inside and outside of a cell . Anything that is water-soluble, even tiny single atoms such as H + ions , will not easily pass through a lipid bilayer. However, water-insoluble molecules may pass freely; these include small molecules such as oxygen and carbon dioxide, and large water-insoluble hormones such as estrogen, testosterone, cortisol , thyroid hormone, and vitamin D. For these reasons, membranes are said to be semipermeable barriers. They do not let water or water-soluble molecules pass, but they do allow diffusion of water-insoluble (lipid soluble) molecules.
However, membranes are more than passive barriers. This is made clear by the many molecules that cannot pass through simple bilayers very quickly, but can pass into and out of cells . Water is the best example. As the understanding of membranes developed in the scientific community, a conundrum emerged. The phospholipid bilayer structure should not be very permeable to water, but when cells are studied in the laboratory, most are very permeable to water. How could this be? Scientists went so far as to build synthetic membranes using exactly the kinds and quantities of phospholipids found in specific types of cells. These synthetic membranes had very low water permeability, while the cells they modeled had very high water permeability. The hypothesis at the time was that there must be some sort of pore or channel in membranes through which water can pass, but all evidence for this was indirect. Channels for ions had been discovered, but the way that cells move water in and out remained a mystery.
This changed in 1992 when Peter Agre and colleagues reported their accidental discovery of channels called aquaporins (Preston et al., 1992). These channels are embedded in the plasma membrane and allow water to pass into and out of the cell (Figure 7). Agre and colleagues were not in the business of studying water transport. They were studying the Rhesus (Rh) factors that are present on red blood cells and result in blood incompatibility complications. In trying to isolate and purify these Rh factors, they noticed a “contaminant” in their test tubes – a membrane protein that they were not trying to study but which kept getting in the way. When they noticed that this protein is one of the most abundant proteins on the surface of the red blood cell, they decided to take a closer look and eventually realized that this “contaminant” was a protein that scientists had been looking for decades. Over the next few years, a whole family of related aquaporin proteins was discovered, and these proteins have a nearly identical structure in humans, fruit flies, fungi, and plants, indicating an ancient origin and strong conservation throughout more than a billion years of evolution .

Figure 7: Aquaporin proteins in the membrane allow only molecules that are shaped and charged like water molecules to pass freely.
Interestingly, a research group from Romania led by Gheorghe Benga had likely made this discovery at least six years before Agre, but they had not fully isolated nor identified the protein . Nevertheless, controversy has been raised over the issue of proper credit because Benga’s work almost certainly describes the same protein and had been published publically years before, both in a US journal and an international one. Nevertheless, Agre and colleagues did not to cite this work in their publications or Nobel Prize lectures, and most of the scientific community overlooked them as well. It should be noted that, working in an Eastern Bloc country as the collapse of the Soviet Union approached, Benga and his colleagues did not have the prestige or resources that Agre and his colleagues enjoyed at Johns Hopkins University. It is conceivable that, had Benga been working in a more internationally prestigious institution and/or with more financial resources, he may have shared the Nobel Prize in 2003.
The discovery of aquaporins highlights how proteins embedded in the plasma membrane can act as gatekeepers and govern the entry of molecules into and out of the cell . The membrane has many such gatekeepers and, like aquaporin, that are very specific. For example, aquaporin allows water molecules in and out freely, but other molecules much less so. Closely related molecules can pass through, but with much less efficiency (Figure 8). For example, urea, ammonia, and alcohol can each pass through aquaporins and indeed these channels are the main route through which these molecules are absorbed by most cells. However, they pass through more than a million times more slowly than water does. The structure of aquaporins reveals how they achieve this selectivity. Within the tunnel-like chamber through which water molecules pass, there are structural features that fit only a molecule with the size, shape, and partial-charge distribution that water has. Thus, while molecules similar in size and charge to water sometimes can pass through, they pass through at a much lower rate than water itself.

Figure 8 : Aquaporins allow molecules like urea, ammonia, and alcohol to pass through at a much slower rate than water molecules.
The examples of aquaporins and CFTR show how the plasma membrane can be selective about what enters and leaves the cell . As cell biologist Daniel Mazia put it:
The cell membrane is not a wall or a skin or a sieve. It is an active and responsive part of the cell; it decides what is inside and what is outside, and what the outside does to the inside.
Table of Contents
Activate glossary term highlighting to easily identify key terms within the module. Once highlighted, you can click on these terms to view their definitions.
Activate NGSS annotations to easily identify NGSS standards within the module. Once highlighted, you can click on them to view these standards.
Advertisement

- Next Article
INTRODUCTION
Materials and methods, acknowledgements, the rapid intermixing of cell surface antigens after formation of mouse human heterokaryons.
Present address: Immunochemistry Unit, Princess Margaret Hospital for Children, Subiaco, W.A. 6008, Australia.
To whom requests for reprints should be addressed.
- Split-screen
- Article contents
- Figures & tables
- Supplementary Data
- Peer Review
- Open the PDF for in another window
- Version of Record 01 September 1970
- Get Permissions
- Cite Icon Cite
- Search Site
L. D. Frye , M. Edidin; The rapid intermixing of cell surface antigens after formation of mouse human heterokaryons. J Cell Sci 1 September 1970; 7 (2): 319–335. doi: https://doi.org/10.1242/jcs.7.2.319
Download citation file:
- Ris (Zotero)
- Reference Manager
Cells from established tissue culture lines of mouse (CIID) and human (VA-2) origin were fused together with Sendai virus, producing heterokaryons bearing both mouse and human surface antigens which were then followed by the indirect fluorescent antibody method. Within 40 min following fusion, total mixing of both parental antigens occurred in over 90 % of the heterokaryons.
Mouse H-2 (histocompatibility) and human surface antigens were visualized by successive treatment of the heterokaryons with a mixture of mouse alloantiserum and rabbit anti -VA-2 antiserum, followed by a mixture of fluorescein-labelled goat anti-mouse IgG and tetramethyl- rhodamine-labelled goat anti-rabbit IgG(Fc).
The CIID × VA-2 fusions were carried out in suspension and maintained at 37°C in a shaking water bath; aliquots were removed at various intervals and stained with the above reagents. The heterokaryon population was observed to change from an initial one (5-min post-fusion) of non-mosaics (unmixed cell surfaces of red and green fluorescence) to one of over 90 % mosaics (total intermixing of the 2 fluorochromes) by 40 min after fusion. Mouse-human hybrid lines, derived from similar fusions, gave fluorescence patterns identical to those of the mosaic heterokaryons.
Four possible mechanisms would yield such results: (i) a very rapid metabolic turnover of the antigens; (ii) integration of units into the membrane from a cytoplasmic precursor pool; (iii) movement, or ‘diffusion ‘of antigen in the plane of the membrane; or (iv) movement of existing antigen from one membrane site into the cytoplasm and its emergence at a new position on the membrane.
In an effort to distinguish among these possibilities, the following inhibitor treatments were carried out: (1) both short- and long-term (6-h pre-treatment) inhibition of protein synthesis by puromycin, cycloheximide, and chloramphenicol; (2) short-term inhibition of ATP formation by dinitrophenol (DNP) and NaF; (3) short- and long-term inhibition of glutamine- dependent pathways with the glutamine analogue 6-diazo-5-oxonorleucine; and (4) general metabolic suppression by lowered temperature.
The only treatment found effective in preventing the mosaicism was lowered temperature, from which resulted a sigmoidal curve for per cent mosaics versus incubation temperature. These results would be consistent with mechanisms iii and/or iv but appear to rule out i and ii. From the speed with which the antigen markers can be seen to propagate across the cell membrane, and from the fact that the treatment of parent cells with a variety of metabolic inhibitors does not inhibit antigen spreading, it appears that the cell surface of heterokaryons is not a rigid structure, but is ‘fluid’ enough to allow free ‘diffusion’ of surface antigens resulting in their intermingling within minutes after the initiation of fusion.
The surface membranes of animal cells rapidly change shape as the cells move, form pseudopods, or ingest material from their environment. These rapid changes in shape suggest that the plasma membrane itself is fluid, rather than rigid in character, and that at least some of its component macromolecules are free to move relative to one another within the fluid. We have attempted to demonstrate such freedom of movement using specific antigen markers of 2 unlike cell surfaces. Our experiments show that marker antigens on surface membranes spread rapidly when unlike cells are fused. The speed of antigen spread and its insensitivity to a number of metabolic inhibitors offer some support for the notion of a fluid membrane.
We have approached the problem of mixing unlike, and hence readily differentiated, cell surface membranes by using Sendai virus to fuse tissue culture cells of mouse and human origin ( Harris & Watkins, 1965 ). The antigens of the parent cell lines and of progeny heterokaryons have been visualized by indirect immunofluorescence, using heteroantiserum to whole human cells, and alloantiserum to mouse histocompatibility antigens. Both sera were cytotoxic for intact cells in the presence of complement; alloantisera have previously been shown, by both immunofluorescence and immune-ferritin techniques, to bind only to the surface of intact cells (Moller, 1961; Cerottini & Brunner, 1967 ; Drysdale, Merchant, Shreffler & Parker, 1967 ; Davis & Silver man, 1968; Hammerling et al . 1968 ).
The surface antigens of heterokaryons between hen erythrocytes and HeLa cells and between Ehrlich ascites and HeLa cells have previously been studied using mixed agglutination techniques for antigen localization ( Watkins & Grace, 1967 ; Harris, Sidebottom, Grace & Bramwell, 1969 ). In these studies intermixing of surface antigens was demonstrable within an hour or two of heterokaryon formation. However, the antigens could not readily be localized, since the marker particles used were several microns in diameter; also, observations were not made of the earliest time at which mixing occurred. We have been able to examine heterokaryons within 5 min of their formation and to show that antigen spread and intermixing occurs within minutes after membrane fusion. Studies on cells poisoned with a variety of metabolic inhibitors strongly suggest that antigen spread and intermixing requires neither de novo protein synthesis nor insertion of previously synthesized subunits into surface membranes.
cII D. A thymidine-kinase negative (TK-) subline of the mouse ‘L’ cell, isolated by Dubbs & Kitt (1964), and kindly provided by Dr H. G. Coon.
VA-2 . An 8-azaguanine-resistant subclone, isolated by Weiss, Ephrussi & Scaletta (1968) , obtained from W-18-VA-2 , an SV4O-transformed human line which has been free of infective virus for several years ( Ponten, Jensen & Koprowski, 1963 ).
Sal . An ascites tumour (designated as Sarcoma I), provided by Dr A. A. Kandutsch, The Jackson Laboratory, and carried in A/f mice; it was used as a convenient source of mouse cells for absorption of antiglobulin reagents.
Tissue culture
The CIID and VA-2 lines were routinely grown in a modified F-12 medium containing 5 % foetal calf serum (FCS) ( Coon & Weiss, 1969 ) or in Minimal Essential Medium with 5% FCS, 5 % Fungizone and 100 units penicillin/ml. The cultures were maintained at 37 °C in a water jacketed CO 2 incubator, 98% humidity, 5 % CO 2 .
For experiments or routine passages, cells were harvested with 2 · 5 % heat-inactivated chicken serum, 0 · 2 % trypsin and 0 · 002 % purified collagenase (Worthington CSL) in Moscona’s (1961) solution, which is referred to as ‘CTC’.
Sensitizing antibodies
Mouse alloantiserum (FAS-2) . Preparation: antibodies primarily directed against the H-2 k histocompatibility antigens were obtained by a series of intraperitoneal injections of CBA/f (H-2 k ) mouse mesenteric lymph node and spleen cells into BALB/cf (H-2 d ) mice (4-recipients: 1 donor). Six injections were given twice weekly, followed by a booster 2 weeks after the last injection. The animals were bled from the retro-orbital sinus 4 and 5 days post-booster.
Specificity . Reaction with mouse cells (CIID): Aliquots of 2·5 × 10 5 CIID cells were treated in suspension with 0·1 ml of two-fold dilutions of FAS-2 from 1/10 to 1/80. The cells were agitated periodically for 15 min at room temperature at which time they were washed twice in phosphate buffered saline (PBS). They were then resuspended in 0·05 ml of fluorescein-labelled rabbit antimouse IgG, incubated, and washed as above. The cells were then put on to Vaseline-ringed slides, covered and observed in the fluorescence microscope. Ring reactions as reported by Moller (1961) were observed with decreasing brightness upon increasing dilutions of the FAS-2. As maximum brightness was desired, the 1/10 dilution was chosen for all subsequent staining reactions.
Reaction with human cells (VA-2): No fluorescence was observed when analagous staining reactions were carried out with human cells.
Reaction with Sendai virus: It was discovered that VA-2 cells pre-treated with Sendai virus became positive for the FAS-2 sensitization. Normal mouse sera from BALB/cf, CBA/f, DBA/2J and A/f strains were also shown to exhibit this anti-Sendai activity. This activity in FAS-2 was easily absorbed by treating a 1/5 dilution of the antiserum with 333-666 haemag- glutinating units (HAU)/ml of virus for 30 min at room temperature and overnight at 4 °C. The absorbing virus was then removed by centrifugation.
Rabbit anti-VA-2 antiserum (RaVA-2) preparation: VA-2 cells were grown in Falcon plastic Petri dishes, harvested with CTC, and washed 3 times in Hanks’s balanced salts solution, BSS (HEPES-buffered) to remove the foetal calf serum. 2 ×10 5 cells were emulsified with Freund’s complete adjuvant (cells : adjuvant =1:2) and injected intradermally (flanks and footpads) into a New Zealand white rabbit. One week later 10 6 washed cells were given intradermally (flanks only;10 5 cells/site). The rabbit was bled from the ear vein 1 and 2 weeks following this second injection. The sera were heat-inactivated at 56 °C for 30 min, aliquoted and stored at − 30 °C.
Specificity of RaVA-2: Reaction with VA-2: VA-2 cells were seeded on to coverslips (2 · 5 × 10 5 /coverslip) and allowed to adhere and spread. The coverslips were then washed with Hanks’s and 0 ·1 ml of 2-fold dilutions of the RaVA-2 from 1/2 to 1/256 were added. After incubation in a moist chamber for 15 min at room temperature, the coverslips were washed twice in Hanks’s BSS and similarly treated with tetramethylrhodamine (TMR)-labelled goat anti-rabbit IgG (anti-Fc). The cells gave strong fluorescent ring reactions at the lower dilutions of the sensitizing antibody; the 1/4 dilution was chosen for all subsequent staining reactions.
Reaction with CIID: When analogous staining reactions were carried out with the mouse cells, a very weak fluorescence was seen in the lower dilutions of the RaVA-2. Consequently, the serum was routinely absorbed with 5 × 10 cIID /ml of a 1/2 diluted serum (30 min at room temperature).
Reaction with Sendai virus: The CIID cells, when pre-treated with Sendai virus, gave weak positive staining with the mouse-absorbed RaVA-2. Therefore, the RaVA-2 was also absorbed with 333 HAU/ml (30 min at room temperature and overnight at 4° C). This doubly absorbed RaVA-2 then gave a negligible background on the CIID cells.
Fluorescent antibodies
Goat anti-mouse IgG . Preparation of mouse IgG: A 16% Na 2 SO 4 cut of 26 ml of normal BALB/c serum was dissolved in 8 ml of 0 · 2 M NaCl, 0 · 1M phosphate buffer, pH 8 ·0 and then dialysed against this buffer in the cold prior to chromatography on a 2 · 5 × 100 cm column of Sephadex G-200, in the same buffer. Included fractions comprising the second protein peak off the column were pooled and dialysed against 0·01 M phosphate buffer, pH 7 · 5. The dialysed material was applied to a 500-ml column of DEAE-cellulose, equilibrated with 0 ·01 M phosphate buffer. Material eluting stepwise from the column in 0 ·025 and >d 0 ·05 M phosphate buffer was pooled and concentrated in an Amicon ultrafilter. The purified material showed only an IgG arc upon immunoelectrophoresis on agarose and reaction with rabbit anti-whole mouse serum.
Immunization of goat: 10 mg of immunogen was emulsified with Freund’s complete adjuvant (immunogen: Freund’s = 1:2) and injected intramuscularly into a 6-month-old goat. Three and one-half weeks later, 600 ml of blood were collected from the jugular vein and the serum tested by immunoelectrophoresis. Even though the immunogen had shown no contaminants as judged by the rabbit anti-whole mouse serum, a trace amount of a more negative protein was present. Though the goat anti-mouse IgG was not monospecific, non-specificity was not observed in the indirect fluorescent antibody technique described under sensitizing antibodies.
Conjugation to FITC: The isothiocyanate derivative of fluorescein (FITC) was used for conjugation to partially purified goat antibodies, employing the method of Wood, Thompson & Goldstein (1965) . The fluorescein-labelled antibodies were eluted stepwise from DEAE cellulose with 0 ·05, 0·1, 0 ·2 and 0 · 3 M phosphate buffers, pH 7 · 5. The 0 · 1 M phosphate buffer cut, having an O.D. 280/495 = 2 · 0 and a protein concentration of 1 · 3 mg/ml, was used in all our experiments.
Goat anti-rabbit IgG (Fc) . Source: Goat anti-rabbit IgG (Fc), prepared against the Fc portion of the gamma heavy chain, was kindly provided by Dr J. J. Cebra.
TMRITC conjugation: The preparation of tetramethylrhodamine (TMR)-labelled anti bodies was carried out under the same conditions as for the fluorescein conjugation. An 0 · 1 M phosphate buffer cut from DEAE-cellulose had an O.D. 280/515 = 1 · 7 and a protein concentration of I mg/ml; it was used in all studies described here.
Sendai virus
The Sendai virus used in the experiments described in this report, was kindly provided by Dr H. G. Coon. Its preparation was as published ( Coon & Weiss, 1969 ) except that the virus was inactivated with β-proprio-lactone, rather than by ultraviolet irradiation.
Formation of heterokaryons
Heterokaryons were produced by the suspension fusion technique originally described by Okada (1962) for homokaryons. The parental ratios were cIID/VA-2 = 2 − 4; 3 × 10 6 cells were resuspended in 0 ·1 ml of cold Sendai (100 − 250 HAU/ml) and shaken at 0 − 4°C for 10 min and then at 37 °C for 5 − 10 min. Culture medium was then added for a 10-fold dilution of the cells.
Formation of hybrid cell lines
Mouse-human hybrid cell lines were produced by viral fusion as for the heterokaryons.
Following fusion, the cells were plated at 3 × 10 5 /ml in normal medium; 24 h later this medium was replaced by ‘HAT’ ( Littlefield, 1964 ), which was used for all subsequent feedings of these plates and the resulting hybrid lines.
Fluorescent staining of cells
Cells from fusion experiments or hybrid cells were washed in Hanks’s BSS and resuspended in a mixture of sensitizing antibodies: FAS-2 and RaVA-2 (1/10 and 1/4 final dilutions, respectively), 0 · 1 ml mixture/3 − 6 × 10 5 cells; incubation at room temperature for 15 min. Finally, the cells were washed twice in Hanks’s BSS, resuspended in a small volume of the same, placed on a Vaseline-ringed slide, and observed in the fluorescence microscope.
Fluorescence microscopy
All observations of fluorescent cells were made with a Leitz Ortholux Microscope, using darkfield condenser D 1 · 20 and an Osram HBO 200-W high-pressure mercury lamp as the light source. The exciting light was first passed through a Corning BG-38 heat filter and then through a combination of interference and barrier filters, depending upon the type of fluorescence to be maximized (see Table 1 ). The interference filters were patterned after those reported by Ploem (1967) to give maximum brightness for fluorescein- and tetramethylrhodamine labelled antibodies.
Filter combinations used for excitation of fluorescein and tetramethyl rhodamine conjugates

Photography
Pictures of cells stained with fluorescent-labelled antibodies were taken using a Leica camera and exposing Anscochrome 200 daylight film (ASA 200) for 3 − 4 min or Hi-Speed Ektachrome (ASA 160) for 4 − 6 min.
Staining of cIID and VA-2
When cIID or VA-2 populations were stained for either H-2 or human antigens by the protocol given in Materials and Methods, 2 basic fluorescent patterns were observed: (1) The majority of the cells gave a full ring reaction, ( Möller, 1961 ) with intensities varying from cell to cell; an occasional cell gave no fluorescence except for a weak blue-green autofluorescence which was easily distinguishable from the FL or TMR fluorescence. On the cells giving ring reactions, distinct, tiny patches of fluorescence could be seen by focusing on the upper or lower cell surfaces. When a cell was in focus for the ring reaction (that is, at the cell equator), these patches were no longer visible. (2) Some cells gave only a partial ring reaction, and upon focusing on the upper or lower surfaces, the patches of fluorescence were in highest concentration on the cell half giving the partial ring reaction.
Staining of cIID × VA-2 hybrid cell lines
Hybrids between cIID and VA-2 were produced as described in Materials and Methods. Colonies of hybrid cells first appeared 13 days following fusion. Six of these were isolated and stained to provide positive controls for doubly antigenic cells ( Fig. 3 A, B). Cells of all lines fluoresced green, indicating a content of mouse H-2 antigens, and the intensities were comparable to those given by the mouse parent, cIID . The intensity of the red fluorescence, marking human antigens, varied from line to line. If the human parent, VA-2 , is given an arbitrary intensity of + + - units, then the hybrid lines gave the following: MH-I, + + ; MH-5, + ; MH-2, ± ; and MH-6 , –.
Time-course of staining of heterokaryons
Fusions and fluorescent antibody staining of cIID × VA-2 were carried out as des cribed in Materials and Methods. Crosses of cIID × cIID and VA-2 × VA-2 were also made as controls for antibody specificity. Following the fusion reaction (5–10 min at 37 °C), the cells were diluted 10-fold with medium and shaken at 37 °C. Aliquots removed at various times were stained immediately, and the stained cells were kept at 0°C until observation.
Though cell fusion indices were not measured, the degree of fusion in the system was not great, as evidenced by the low number of double-staining cells obtained; the scanning of several fields was required to count adequate numbers of the heterokaryons.
The control slides of cIID × cIID and VA-2 × VA-2 showed cells with ring reactions of only one colour; green for cIID and red for VA-2 . No double-staining cells were seen.
Table 2 shows the results obtained up to 2 h following the initial fusion reaction. There is a definite trend from an initial population of non-mosaics to one of over 90% mosaics (as percentage of double-stained cell population) by 40 min. Fig. 1 shows a bar graph of the population shift over time.
Time course of antigen spread

Appearance of completely double-staining (mosaic) cells in the population of fused cells.
In initial studies in which the fused cells were placed on coverslips in Petri dishes and allowed to adhere and spread for up to 12 h before staining, all double-staining cells observed were mosaic in appearance.
Inhibitor studies
The rapid spread of antigens across the surfaces of heterokaryons could be due either to movement of antigens across the cell surface (‘diffusion’) or to new antigen synthesis. In an attempt to distinguish between these possibilities, cells were treated with various metabolic inhibitors before and during fusion. Since the time-course studies showed that over 90% of the double-stained cells were mosaic by 40 min at 37 °C, this time period was chosen for testing the effects of the inhibitors. The experiments fall into 4 categories: inhibition of protein synthesis, of ATP formation, of glutamine-dependent synthetic pathways, and generalized metabolic inhibition by lowered temperature.
Inhibition of protein synthesis
Cycloheximide and puromycin were tested for potency in terms of the inhibition of [ 3 H]leucine incorporation into TCA-precipitable material. Cycloheximide was found to give over 95 % inhibition at 5 μg/ml after 30 min incubation, whereas comparable inhibition for our batch of puromycin required 80 μg/ml as measured after 3 h.
For the initial experiments the parent cells were suspended in medium containing either puromycin (8oμg/ml) or cycloheximide (5μg/ml) and incubated for 15 min at 37 °C. The cells were then pelleted and fusion carried out as usual. After the fusion reaction, the cells were diluted 10-fold with inhibitor-containing medium and shaken for 30 min at 37 °C before staining. Table 3 shows the results of these and other inhibitor experiments. Neither inhibitor had any effect on mosaic formation.
Effect of inhibition of protein synthesis on mosaicism

If membrane or antigen subunits were synthesized some time prior to being released to the surface, short-term inhibition of protein synthesis might be without effect on such subunits, or their insertion into membrane. Therefore, the parent cells were treated with inhibitors for 6 h prior to their fusion. Confluent plates of cIID and VA-2 were treated with inhibitor in the concentrations used in short-term experiments, but for 6 h; after 3 h incubation, the medium was replaced with fresh inhibitor-medium to ensure continued inhibitor potency. (Both inhibitors had been tested with [ 3 H]- leucine for prolonged inhibition, and they did retain their potency during a 3-h incubation.) Two and one-half hours later, the cells were harvested with CTC inhibitor, counted and checked for viability (nigrosin dye exclusion test). Viability was greater than 95 %. The experiment was then continued, using the same procedures as for the short-term inhibition experiments. Table 3 gives the results of these experiments. In the initial long-term experiment, a slight effect for both inhibitors was noted; however, a repeat experiment gave results equal to control values.
Analogous short and long-term inhibition experiments were also carried out with chloramphenicol, at a concentration of 200μg/ml ( Table 3 ). Again negligible inhibition of mosaic formation was noted.
Inhibition of ATP formation
When cells are exposed to 2·5 ×10 −3 MDN P + 2×10∼ −3 M NaF following initiation of fusion for 10 min at 37 °C, their content of ATP, as measured in terms of the light flash produced in a luciferin/luciferase system, ( Denburg, Lee & McElroy, 1969 ) falls to 20% of that of control cells 5 min after addition of the uncouplers and to 17% at 10 min. After shaking for a further 30 min at 37 °C, the cells were stained and observed. DNP + NaF did not inhibit mosaic formation.
Inhibition of glutamine-dependent synthetic pathways
Fusion experiments were per formed using cells treated with the glutamine analogue, DON (6-diazo-5-oxonorleu cine), at a concentration of 250 μg/ml in the medium which contained 292 μg/ml of L-glutamine. In the short-term inhibition experiment, the parent cells were incubated in the presence of DON for 30 min at 37°C prior to the fusion step. Following a fusion step of 5 min, the cells were diluted 10-fold in DON-containing medium, shaken for 35 min at 37 °C, stained and observed. Table 4 gives the results of this experiment, in which no effect was seen.
Effect of inhibition of glutamine-dependent pathways on mosaicism

A long-term inhibition experiment was also performed, differing from the former only in that the cells, in culture, had been treated with DON 6 h prior to the fusion reaction. After 3 h in culture, the DON-containing medium was replaced with fresh inhibitor-medium to insure continued inhibition. Before fusion the cells were tested for viability (nigrosin dye exclusion); viability was greater than 95%. The results of this experiment are given in Table 4 . Again, mosaic development proceeded as normal.
Temperature studies
To see the effects of lowered temperature upon mosaic formation, aliquots of cells were maintained for 30 min at 0, 15, 20 and 26 °C after an initial 10-min fusion step. The results are tabulated in Table 5 and Fig. 2 shows a plot of temperature v . per cent mosaicism in the double-stained cell population. Lowered temperature does appear to inhibit antigen spread and mixing.
Effect of temperature on antigen spread and mosaicism

Effect of temperature on the appearance of mosaic cells within 40 min of cell fusion.

All cells are doubly stained with fluorescent antibodies visualizing both mouse H-2 antigens (green fluorescence) and human surface antigens (red fluorescence). Photographs were taken through filters allowing only red or green light to reach the camera, c was doubly exposed to record both colours in a single frame. For further details see the text, × 3000 approx. A. Stable somatic hybrid line MH-1 . Mouse antigens are shown, B. The same. Human antigens are shown, c. M 1 2 - H 1 2 Double exposure, for both mouse and human antigens. D. M 1 2 - H 1. Mouse antigens are shown. E. M 1 2 - H 1- H I. Human antigens are shown. F . MI-HI . Mouse antigens are shown. G. M1-H1 . Human antigens are shown. The plate is made from colour prints, not from original slides.
In all the inhibition experiments described, the degree of cell fusion did not appear to be significantly reduced by any of the inhibitors.
Surface antigens of cIID and VA-2 cells and of their stable hybrids
Fluorescent antibody staining of cells of lines cIID and VA-2 showed surface antigens homogeneously distributed, in tiny patches, over the entire surface of most of the cells observed. The appearance of a ‘ring reaction’ (M öller, 1961), seems to be due to surface membrane curvature, resulting in a greater number of fluorochromes observed per unit area when focusing in the plane of a cell’s equator than when focusing on its upper or lower hemispheres. The reason why some cells exhibit a partial ring reaction at the equator remains unclear; similar results were noted by M öller (1961).
The discrete patches of fluorescence seen away from the cell equator indicate that surface antigens are localized or clustered, rather than spread through the entire surface. Others have reported similar observations, using both light and electron microscopy. Cerottini & Brunner (1967) , using an indirect fluorescent antibody method to detect mouse H-2 alloantigens on various tumour and normal cells, observed large patches of fluorescence, especially in ethanol-fixed cells. Two groups using ferritin-labelled antibodies have also shown H-2 antigens to be clustered in the membrane ( Davis & Silverman, 1968 ; Hammerling et al . 1968 ).
Staining of hybrid lines between cIID and VA-2 provided a control for the appearance, when stained, of a cell whose surface is a mosaic of both human and mouse antigens, and is presumably synthesizing these antigens. Those lines which did stain positive for both sets of antigens were indistinguishable from the mosaic heterokaryons found 40 min after initiation of cell fusion.
Surface antigens of heterokaryons
Four processes might account for the observed development of a mosaic pattern of antigen distribution: (i) a rapid synthesis of additional antigens, or a rapid metabolic turnover of existing antigens; (ii) integration of subunits, previously synthesized within the cell, into the membrane; (iii) movement or ‘diffusion’ of antigen within the plane of the membrane; or (iv) movement of existing antigen from one membrane site into the cytoplasm and its emergence at a new position on the membrane. Mechanisms iii and iv are difficult to distinguish operationally from each other, while it ought to be possible to distinguish i or ii from iii and iv.
If (i), rapid metabolic turnover, or synthesis of additional antigen molecules is responsible for the antigen redistribution observed, then one should be able to block the process with a suitable inhibitor. Unfortunately, lack of information on the chemistry of the antigens detected in our system precludes a definitive statement that antigen synthesis or replacement from a cytoplasmic precursor pool is inhibited by any of the inhibitors tested.
Short-term inhibition of protein synthesis, using puromycin, cycloheximide and chloramphenicol had no effect upon mosaicism. Three different inhibitors were used in an effort to block as many different sites of protein synthesis as possible. Unless one postulates that membrane proteins are synthesized in a metabolic compartment protected from all the inhibitors used, it would appear that rapid de novo protein synthesis is not a requirement for mosaic formation; indeed, other workers have shown that the inhibitors we used are effective in blocking the synthesis of membrane-associated molecules. Kraemer (1966 , 1967 ) found puromycin effective in preventing the re-appearance of sialic acid on Chinese hamster cells which had previously been treated with sialidase. Warren & Glick (1968) also found that puromycin blocked the turnover of [ 14 C]glucose in L cell membranes; cycloheximide retards incorporation of [ 14 C]leucine in chloroplast membrane protein of Chlamydomonas ( Hoober, Siekevitz & Palade, 1969 ).
The glutamine analogue, DON was also without effect on antigen re-arrangement, both in short- and long-term inhibition experiments. DON has been shown to be an effective inhibitor of glutamine-utilizing amino transferase reactions involved in purine and pyrimidine synthesis and in amino sugar synthesis (summarized by Meister, 1962 ). In each of the systems, the inhibitor has been shown to be effective in the presence of a large excess of glutamine. We feel that in our experiments its failure to inhibit appears to rule out de novo synthesis of oligosaccharides and their attachment to pre-existing protein chains. The presence of amino sugars and sialic acid on the cell surface is well documented (see Cook, 1968 ) and indeed, DON has been found to inhibit another process involving cell surfaces, glutamine-dependent reaggregation of dissociated mouse embryoid body cells, when used in the presence of glutamine ( Oppenheimer, Edidin, Orr & Roseman, 1969 ).
The utilization of a precursor pool of membrane subunits appears to be ruled out by several of our experiments, especially that involving long-term inhibition of protein synthesis. Recent in vivo experiments on membrane synthesis in rat liver indicate the existence of a precursor pool of membrane which is utilized over the course of 3 h following cycloheximide injection ( Ray, Lieberman & Lansing, 1968 ). Our 6-h pre-treatment of cells should have been adequate to deplete similar precursor pools if they were present in cIID and VA-2 cells. Furthermore, it might be expected that high energy phosphate bonds might be required for integration of any subunits into the surface, as indeed they seem to be required for initial membrane fusion in heterokaryon formation ( Okada, Murayama & Yamada, 1966 ). However, no inhibition of antigen spread was produced by ATP inhibitors, which in combination quickly reduced cell ATP to less than 20% of control value. This observation also tells against, though it does not rule out, mechanism iii for antigen spread. If molecules left the surface and moved through the cytoplasm before re-emerging at a new point on the surface it might be thought that their re-integration would require energy from ATP.
In arguing the last point, it may be objected that a cell containing 15–20% of its normal ATP content may well still be capable of sustaining ATP-requiring synthetic reactions. Indeed, the degree of inhibition of total ATP generation observed is proportionally far greater than the degree of inhibition of amino acid incorporation by puromycin and cycloheximide. However, this lower degree of inhibition might be expected from the work of Atkinson (1965) showing that as ADP and AMP levels rise in a cell, and ATP levels fall, substrates tend to be shifted to the Krebs cycle, generating more ATP, rather than to synthetic pathways. Despite this possibility, we must concede that inhibitor studies with DNP and NaF can only suggest, but not strongly support, the absence of a need for ATP in antigen movement.
One treatment of fused cells did inhibit the spreading and intermixing of antigens on their surfaces; this was subjection to lowered temperature. The curve of per cent mosaics formed v . temperature is that expected if spread were due to diffusion of antigen-bearing molecules in a solvent, such as lipid, whose viscosity changes markedly with temperature. The rate of spread of antigens is, assuming a value of 10 nm for the radius of an antigen molecule, consistent with a membrane viscosity of 100–200 cP(1–2 × 10 5 Ns m∼ − 2 ), about that of many oils (V. A. Parsegian, personal communication). Furthermore, the curve of per cent mosaics at 40 min v . temperature is quite similar to some of those given by De Gier, Mandersloot & Van Deenen (1968) for the penetration of glycerol into liquid crystal ‘liposomes’ v . temperature. In each instance, the system appears to have a distinct melting temperature, above which various processes may occur.
Other natural membranes have also been shown to contain at least some fluid areas. Hubbel & McConnell (1969) used spin-labelled steroids to show that fluid regions exist in myelin and another group has recently used calorimetric techniques to indicate the liquid crystalline state of mycoplasma membranes ( Steim et al . 1969 ). Blasie & Worthington (1969 a, b) made low angle X-ray scattering measurements of the arrangement of photopigment molecules in frog retinal receptor disk membranes, showing that the nearest neighbour frequency for those molecules was altered by change in temperature, or by the addition of antirhodopsin antibody to the system. Their interpretation of the data supports the notion that the pigment molecules ‘float’ in a liquid-like environment.
Our observations and calculations, and the scattered examples from the literature all call attention to the possibility that elements of many biological membranes are not rigidly held in place, but are free to re-orient relative to one another. This aspect of membrane structure has not been considered in current membrane models (cf. Stoeckenius & Engleman, 1969 ), though modification or extension of several of these would be sufficient to account for our results.
We are deeply grateful to Dr Hayden Coon, now of the Department of Zoology, University of Indiana, for expert advice on tissue culture techniques and cell fusion, to Dr John Cebra, for instruction in the preparation of fluorescent antibody reagents, and to Dr Jeffrey Denburg for performing the ATP assay.
This work was submitted by L. D. F. in partial fulfilment of the requirements for the Ph.D. degree in the The Johns Hopkins University. It was supported by a National Institutes of Health Predoctoral fellowship to L. D. F., by NIH grant AM 11202 to M. E. and by a NIH training grant in developmental biology, in the Department of Biology.
Email alerts
Call for papers: cell biology of mitochondria.

We are welcoming submissions for our upcoming special issue: Cell Biology of Mitochondria . This issue will be coordinated by two Guest Editors: Ana J. Garcia-Saez (University of Cologne, Germany) and Heidi McBride (McGill University, Canada). Submission deadline: 1 November 2024.
Biologists @ 100 - join us in Liverpool in March 2025

We are excited to invite you to a unique scientific conference, celebrating the 100-year anniversary of The Company of Biologists, and bringing together our different communities. The conference will incorporate the Spring Meetings of the BSCB and the BSDB, the JEB Symposium Sensory Perception in a Changing World and a DMM programme on antimicrobial resistance. Find out more and register your interest to join us in March 2025 in Liverpool, UK.
Intermediate filaments at a glance
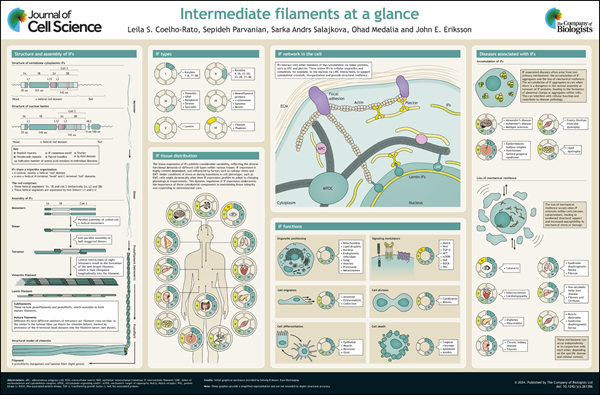
Although intermediate filaments are known for their structural support, emerging evidence reveals their involvement in various cellular processes, underscoring their significance in disease development and progression. In this Cell Science at a Glance article, Leila Coelho-Rato and colleagues discuss the established classes of intermediate filaments and their general features, their functions beyond structural support and recent advances in the field.
JCS-FocalPlane Training Grants

Early-career researchers - working in an area covered by JCS - who would like to attend a microscopy training course, please apply . Deadline dates for 2024 applications: 7 September (decision by week commencing 8 October 2024); 22 November (decision by week commencing 16 December).
Immune Cell Interactions in Development, Homeostasis and Immunity

Early-career researchers interested in immune cell interactions, apply now for one of the ten funded places at this Workshop, which will take place 23-26 February 2025. Application deadline: 23 September.
Peer review week at The Company of Biologists

To celebrate #PeerReviewWeek 2024, we thank all the peer reviewers who make a significant contribution to the peer review process across our journals. With your support, we have protected 6,667 ancient woodland trees in The Forest of Biologists.
Social media
Other journals from The Company of Biologists
- Development
- Journal of Experimental Biology
- Disease Models & Mechanisms
- Biology Open
- Editors and Board
- Aims and scope
- Submit a manuscript
- Manuscript preparation
- Journal policies
- Rights and permissions
- Sign up for alerts
Affiliations
- Journal of Cell Science
- Journal Meetings
- Library hub
- Company news

- Privacy policy
- Terms & conditions
- Copyright policy
- © 2024 The Company of Biologists. All rights reserved.
- Registered Charity 277992 | Registered in England and Wales | Company Limited by Guarantee No 514735 Registered office: Bidder Building, Station Road, Histon, Cambridge CB24 9LF, UK
This Feature Is Available To Subscribers Only
Sign In or Create an Account
Membrane protein fluidity

Get better grades with Learn
82% of students achieve A’s after using Learn
Students also studied


An official website of the United States government
The .gov means it’s official. Federal government websites often end in .gov or .mil. Before sharing sensitive information, make sure you’re on a federal government site.
The site is secure. The https:// ensures that you are connecting to the official website and that any information you provide is encrypted and transmitted securely.
- Publications
- Account settings
- My Bibliography
- Collections
- Citation manager
Save citation to file
Email citation, add to collections.
- Create a new collection
- Add to an existing collection
Add to My Bibliography
Your saved search, create a file for external citation management software, your rss feed.
- Search in PubMed
- Search in NLM Catalog
- Add to Search
The rapid intermixing of cell surface antigens after formation of mouse-human heterokaryons
- PMID: 4098863
- DOI: 10.1242/jcs.7.2.319
PubMed Disclaimer
Similar articles
- Lymphocyte receptor movement induced by sheep erythrocyte binding. Ashman RF. Ashman RF. J Immunol. 1973 Jul;111(1):212-20. J Immunol. 1973. PMID: 4123369 No abstract available.
- Temperature-sensitive phenomenon of viral maturation observed in BHK cells persistently infected with HVJ. Nagata I, Kimura Y, Ito Y, Tanaka T. Nagata I, et al. Virology. 1972 Aug;49(2):453-61. doi: 10.1016/0042-6822(72)90497-7. Virology. 1972. PMID: 4559687 No abstract available.
- [Synthesis of mitochondrial proteins]. Pinus EA, Metlitskaia AZ. Pinus EA, et al. Usp Sovrem Biol. 1970 Jul-Aug;70(1):3-25. Usp Sovrem Biol. 1970. PMID: 4924236 Review. Russian. No abstract available.
- Antigen cap formation in cultured fibroblasts: a reflection of membrane fluidity and of cell motility. Edidin M, Weiss A. Edidin M, et al. Proc Natl Acad Sci U S A. 1972 Sep;69(9):2456-9. doi: 10.1073/pnas.69.9.2456. Proc Natl Acad Sci U S A. 1972. PMID: 4560687 Free PMC article.
- Developmental phases in intermitosis and the preparation for mitosis of mammalian cells in vitro. Nesković BA. Nesković BA. Int Rev Cytol. 1968;24:71-97. Int Rev Cytol. 1968. PMID: 4178320 Review. No abstract available.
- Evolution of the Concepts of Architecture and Supramolecular Dynamics of the Plasma Membrane. Campos Muñiz C, Fernández Perrino FJ. Campos Muñiz C, et al. Membranes (Basel). 2023 May 24;13(6):547. doi: 10.3390/membranes13060547. Membranes (Basel). 2023. PMID: 37367751 Free PMC article. Review.
- The Utility of Fluorescence Recovery after Photobleaching (FRAP) to Study the Plasma Membrane. Day CA, Kang M. Day CA, et al. Membranes (Basel). 2023 May 2;13(5):492. doi: 10.3390/membranes13050492. Membranes (Basel). 2023. PMID: 37233553 Free PMC article. Review.
- NIR fluorescence imaging and treatment for cancer immunotherapy. Kang H, Kang MW, Kashiwagi S, Choi HS. Kang H, et al. J Immunother Cancer. 2022 Jul;10(7):e004936. doi: 10.1136/jitc-2022-004936. J Immunother Cancer. 2022. PMID: 35858710 Free PMC article. Review.
- Cell-Cell Fusion Mediated by Viruses and HERV-Derived Fusogens in Cancer Initiation and Progression. Dittmar T, Weiler J, Luo T, Hass R. Dittmar T, et al. Cancers (Basel). 2021 Oct 26;13(21):5363. doi: 10.3390/cancers13215363. Cancers (Basel). 2021. PMID: 34771528 Free PMC article. Review.
- Cell physiology and molecular mechanism of anion transport by erythrocyte band 3/AE1. Jennings ML. Jennings ML. Am J Physiol Cell Physiol. 2021 Dec 1;321(6):C1028-C1059. doi: 10.1152/ajpcell.00275.2021. Epub 2021 Oct 20. Am J Physiol Cell Physiol. 2021. PMID: 34669510 Free PMC article. Review.
- Search in MeSH
Related information
- Cited in Books
- PubChem Compound (MeSH Keyword)
LinkOut - more resources
Full text sources.
- Silverchair Information Systems
Other Literature Sources
- The Lens - Patent Citations

- Citation Manager
NCBI Literature Resources
MeSH PMC Bookshelf Disclaimer
The PubMed wordmark and PubMed logo are registered trademarks of the U.S. Department of Health and Human Services (HHS). Unauthorized use of these marks is strictly prohibited.
- Access through your organization
- Purchase PDF
Article preview
References (21), cited by (31).

Journal of Theoretical Biology
Mobility and diffusion in the plane of cell membrane, j. cell sci.
- G.K. Bachelor
Ann. d. Phys
J. molec. biol, j. chem. phys, phys. rev. lett, biochim. biophys. acta.
- P.M. Morse et al.
Translational diffusion in the plasma membrane of single cells as studied by fluorescence microphotolysis
Fluidity of cell membranes—current concepts and trends, a microfluorimetric study of translational diffusion in erythrocyte membranes, endosome fusion in living cells overexpressing gfp-rab5, urokinase-type plasminogen activator receptor reversibly dissociates from complement receptor type 3 (α<inf>m</inf>β<sup>2</sup>, cd11b/cd18) during neutrophil polarization, electrophoresis of concanavalin a receptors along embryonic muscle cell membrane.
An official website of the United States government
The .gov means it’s official. Federal government websites often end in .gov or .mil. Before sharing sensitive information, make sure you’re on a federal government site.
The site is secure. The https:// ensures that you are connecting to the official website and that any information you provide is encrypted and transmitted securely.
- Publications
- Account settings
The PMC website is updating on October 15, 2024. Learn More or Try it out now .
- Advanced Search
- Journal List
- v.108(3); 2015 Feb 3
Light and Life in Baltimore—and Beyond
Michael edidin.
1 Biology Department, Johns Hopkins University, Baltimore, Maryland
Baltimore has been the home of numerous biophysical studies using light to probe cells. One such study, quantitative measurement of lateral diffusion of rhodopsin, set the standard for experiments in which recovery after photobleaching is used to measure lateral diffusion. Development of this method from specialized microscopes to commercial scanning confocal microscopes has led to widespread use of the technique to measure lateral diffusion of membrane proteins and lipids, and as well diffusion and binding interactions in cell organelles and cytoplasm. Perturbation of equilibrium distributions by photobleaching has also been developed into a robust method to image molecular proximity in terms of fluorescence resonance energy transfer between donor and acceptor fluorophores.
In this year, proclaimed a “Year of Light” by the United Nations, the Biophysical Society is meeting in Baltimore, whose local newspaper, the Sun, has the motto “Light for All”. Fifty-five years ago, another meeting was held in Baltimore, “Light and Life”. This symposium at Johns Hopkins University, which was introduced by Niels Bohr and attended by James Franck and Max Delbruck among many others, covered the physics of light interacting with biological molecules and the chemistry of light generated in biological systems ( 1 ).
The Symposium grew out of the work and interests of W. D. McElroy, Baltimore’s “firefly man”, who with his colleagues, notably Howard Seliger, worked out the chemical basis of firefly luminescence. However, the range of topics was much broader than this. Papers on excited states, light emission by chemical reactions and biological responses to light described topics that were the foundation of work on molecular and cellular biophysics. The symposium was the prelude to the fluorescence studies of protein structure and dynamics by Ludwig Brand (Beechem and Brand ( 2 )) at Johns Hopkins and Joseph Lakowicz ( 3 ) at the University of Maryland. Also, in the decade after the meeting, laboratories in Baltimore were among the first to develop effective fluorescence microscopy, and methods for measuring lateral diffusion of membrane proteins and lipids.
“Light and Life” neglected a small but developing field of fluorescent-labeled antibodies and fluorescence microscopy. Albert Coons ( 4 ) at Harvard built on earlier work conjugating dyes to antibodies to pioneer fluorescent labeling of antibodies and used these with early fluorescence microscopes to determine the tissue distribution of antigens. The change from imaging contrast from light absorbing dyes to imaging contrast from fluorescence gave a great improvement in sensitivity of detecting of pathogens in tissues. As we will see, this difference in sensitivity was recapitulated in early experiments measuring lateral diffusion of membrane proteins.
Although fluorescence microscopy greatly improved the sensitivity of detection of small numbers of molecules, fluorescence microscopes of the 1940s to the 1960s used dark-field condensers that gave high backgrounds and limited the numerical aperture of objectives to n.a. < n.a. of the condenser (typically n.a. < 1.0). These and other problems led J. S. Ploem to develop an epi-illuminator in which both the exciting light and the emitted fluorescence passed through the objective. Ploem’s illuminator was based on metallurgical microscopes, which used a plain glass beam splitter to illuminate, and to collect reflected light from, solid samples. Ploem developed this geometry further by substituting a wavelength-selective dichroic mirror for the beam splitter ( Fig. 1 ). When the Ploem vertical illuminator was commercialized in the 1970s it revolutionized fluorescence microcopy.

Epi-illumination after Ploem ( 5 ). Light from a mercury or xenon arc lamp is filtered by the excitation filter to yield a blue excitation beam. The beam is reflected by a dichroic mirror, and focused by the objective (not shown) onto a specimen ( gray blue ). The specimen emits green fluorescence, which is transmitted by the dichroic mirror and through a barrier filter to the detector (not shown). Scattered light from the excitation beam ( dashed blue lines ) is blocked by both the dichroic mirror and the barrier filter. After Fig. 2 of Ploem ( 5 ).
Ploem published his illuminator in 1967 ( 5 ) and within a year John Cebra in the Johns Hopkins Biology Department built what I believe was the first Ploem illuminator in the United States. My student Larry Frye used this microscope and the antibody-labeling method developed by Albert Coons, to demonstrate lateral mobility of proteins in the cell plasma membrane (Frye and Edidin ( 6 )).
Frye’s experiment was the first in a series of probes of lateral mobility in cell plasma that all used the same general approach—brief perturbation of an equilibrium distribution and measurement of its return to equilibrium ( Fig. 2 ).

( A and B ) Redistribution of mouse and human cell surface marker proteins with time after fusion of parent cells to form heterokaryons. The initial distribution of surface markers, approximately uniform, was perturbed by adding a bolus of Sendai virus to mixture of mouse (L) and human (VA-2) cultured cells. Sendai virus fusion protein is active at neutral pH and so fuses cell plasma membranes. After 3 min the mixture was chilled and fetal calf serum added, which blocks fusion. Cells were returned to 37°C and sampled at intervals. Label was added after sampling, so redistribution of marker antigens was not impeded by bound antibody. ( C ) Initial condition after a 3-min fusion step. The majority of the fused cells have separate areas of human ( red ) and mouse ( green ) membrane markers. ( D and E ) An intermediate step of intermixing; mouse membrane markers are limited to one region of membrane, ( D ) while human membrane markers have spread over most of the cell surface. ( F ) Completed redistribution of mouse marker antigens. The human membrane markers had the same distribution (not shown). Reproduced from Frye and Edidin ( 6 ), by permission of the Company of Biologists.
The perturbation time in the experiment was three minutes; virus-mediated cell fusion was quenched after this. Relaxation to homogeneous labeling of an area of thousands of square micrometers took ∼40 min and involved ∼10 5 molecules each of mouse and human cell marker proteins. Though it was clear that the redistribution of membrane proteins after virus-induced cell fusion was a diffusional process, quantitation of the diffusion coefficient was difficult, although a solution was offered by Huang ( 7 ).
The first quantitative measurement of lateral diffusion of membrane proteins was made by Richard Cone and his student Mu-ming Poo, in the early 1970s ( 8 ). Their work is the grandfather of all photobleaching and recovery experiments. Leveraging spectral changes in visual rhodopsin after bleaching, Poo and Cone showed diffusional recovery of absorbance after bleaching an area of disks in amphibian rod outer segments. Their calculated value for lateral diffusion, ∼4 × 10 −9 cm 2 s −1 , remains the canonical value for unimpeded lateral diffusion of membrane proteins. This work, together with an earlier measurement of rotational diffusion of rhodopsin ( 9 ), also gave a reasonable figure for the viscosity of the plasma membrane lipid bilayer, ∼1 poise. The instrument used for the measurement was a specialized though commercial microspectrophotometer (Shimadzu, Kyoto, Japan) and the biggest change measured was <0.05 absorbance unit ( Fig. 3 ). As can be seen from Fig. 3 , the perturbation time was ∼10 s, ∼20-times shorter than in the Frye and Edidin experiment; relaxation to homogeneity took ∼60 s, over a membrane area (per disk) of tens of square micrometers, and involving 10 4 –10 5 rhodopsin molecules. However, because there are hundreds of disks per rod outer segment, the experiment characterized the average diffusion of 10 6 –10 7 rhodopsin molecules (see Palczewski ( 10 ) for quantitation of numbers of disks per rod outer segment and numbers of rhodopsins per disk).

The photobleaching and recovery experiment of Poo and Cone ( 8 ). The diagrams of two rods on the left depict the distribution of unbleached rhodopsin corresponding in time with the prebleach and immediate postbleach absorbance measurements shown below. The rod on the right is a control, which was fully bleached and showed no recovery of unbleached rhodopsin. ( Arrows ) Location on the rod at which each absorbance measurement was made. Recordings made from two different rods are shown to give an indication of the repeatability of the experiments. Reproduced from Poo and Cone ( 8 ) with permission of Nature Publishing Group.
The low sensitivity of absorbance measurements limited the Poo and Cone experiment to membranes with high concentrations of proteins with chromophores whose absorbance changed after bleaching. However, the quantitative results of Poo and Cone ( 8 ) and the qualitative result of Frye and Edidin ( 6 ) influenced others to quantitate lateral diffusion by combining the photobleaching/recovery technique of Poo and Cone ( 8 ) with fluorescent labels that allowed photobleaching and recovery techniques application to membrane proteins at low concentrations and to any cell membrane. In a pioneering effort in the development of fluorescence recovery and photobleaching experiments, Reiner Peters and his colleagues (Peters et al. ( 11 )) probed for lateral diffusion of erythrocyte membrane proteins labeled by covalent conjugation with fluorescein isothiocyanate. Their photobleaching and recovery experiment was modeled on the design of Poo and Cone ( 8 ); as well as following return of fluorescence to a bleached region, they measured loss of fluorescence from an unbleached region. Although no measurable fluorescence recovery was detected ( D < 3 × 10 −12 cm 2 s −1 ), the experiment was significant in showing how to generalize photobleaching and recovery measurements of lateral mobility.
A full flowering of fluorescence photobleaching and recovery measurements (usually termed fluorescence recovery after photobleaching, or FRAP) came in 1976. Three laboratories, my own ( 12,13 ), that of Ken Jacobson (Jacobson et al. ( 14 )), and most prominently that of Watt Webb (Schlessinger et al. ( 15,16 ) and Axelrod et al ( 17 )) used a focused laser to bleach and probe diffusion of lipid and protein fluorescent probes. The perturbation times of these laser-based systems are milliseconds and the area probed is a few square micrometers. Depending on the protein and the spot size, the experiment measures the lateral diffusion of as few as 500 labeled molecules.
The series solution to the diffusion equation for bleaching with a Gaussian laser beam converges slowly ( 15 ). In practice, recovery curves have been fit by approximation, notably nonlinear least-squares approximations ( 18,19 ). A schematic photobleaching and recovery experiment is shown in Fig. 4 (see also Edidin ( 20 )).

Fluorescence photobleaching and recovery. A laser beam is focused to a small spot on the membrane ( left ). The Gaussian intensity profile of the laser beam produces a Gaussian concentration gradient of unbleached fluorophore ( top right ). The solution to the diffusion equations requires that the bleaching energy is never sufficient to approach a step distribution of unbleached fluorophore ( lowest curve , top right ). The diagram on the lower right schematizes fluorescence recovery after photobleaching in dimensionless time units. The initial intensity excited by the attenuated laser beam is indicated by B . The asymptote of intensity after recovery is shown by A . The half-time to reach the asymptote and the 1/ e 2 width of the laser spot, ω , yield a diffusion coefficient as t 1/2 = ω 2 /4 D . Reproduced from Edidin ( 20 ).
The Webb laboratory turned to photobleaching recovery methods as an extension of their work using fluorescence correlation spectroscopy (FCS) to measure diffusion in two and three dimensions. The value D of a fluorescent lipid analog measured this way was approximately that expected for free diffusion in a lipid bilayer. However, as noted by one of the founders of the method ( 21 ),
Immediately after the first successful demonstration of FCS with the EB-DNA system, the experiment was performed on a confocal microscope for the study of the mobility of molecules on cell surfaces. At that stage of its development, however, FCS was no longer suitable. To obtain a statistically adequate fluctuation record required excessively long times for measurements on labile systems like live cells. It became clear that fluorescence photobleaching, which had previously been introduced by Peters et al. and Edidin et al., would be more useful.
In contrast to the FCS result for lipid analogs, fluorescence photobleaching and recovery reported diffusion of proteins that was orders of magnitude lower than that measured by Poo and Cone. This was the case whether the proteins were labeled with reactive fluorescein ( 11,12,16 ) or with concanavalin A, a multivalent lectin ( 13–15 ). Also, while diffusion recovery of rhodopsin was complete ( 8 ), a typical FRAP experiment on labeled proteins showed that a significant fraction of label was immobile in the time of the experiment, defining a second FRAP parameter, the mobile fraction. As noted in Schlessinger et al. ( 15 ),
This large difference and the presence of apparently immobile concanavalin A receptors suggests that factors beyond the fluidity of the phospholipid bilayer membrane matrix control the rate of lateral transport of the complexes.
In the next decade photobleaching recovery experiments took two different directions. One was its application to diffusion of molecules in liposomes and supported bilayers. Such measurements gave useful information on absolute diffusion coefficients for lipids and proteins in membrane lipid bilayers of defined composition. Hybrid experiments, cells interacting with bilayers containing proteins of interest, showed up requirements for receptor mobility in cell/cell interactions ( 22 ). In contrast to measurements of absolute D in model membranes, what I would term biological FRAP measurements of lateral diffusion on cell plasma membranes were best done by comparison of D for different cell states, emphasizing relative, not absolute, changes in diffusion coefficients. FRAP investigation of cells also moved from emphasis on diffusion coefficients to emphasis on obstacles and hindrances to lateral diffusion. The immobile fraction, rather than the diffusion coefficient, became the parameter of greatest interest. This was aided by the development of Fab fragments of immunoglobulins as monovalent labeling reagents that could be applied to many cell types (the first use of such reagents that I know of was by Woda et al. ( 23 )). Analysis of recovery curves in the context of particular biological systems gave evidence for molecular associations in the plane of the plasma membrane, and barriers to diffusion within or beneath the plasma membrane bilayer ( 24,25 ). However, the resolution of FRAP was not sufficient to resolve these barriers and associations. Single particle tracking, on a scale smaller than the micrometer scale of FRAP, helped to define these barriers ( 26 ). Models of membrane heterogeneity grew out of the combination of these experiments ( 27 ).
With the development of genetic tagging of proteins by jellyfish green fluorescent proteins and their progeny, FRAP measurements were, at last, able to reach into organelle lumens ( 28 ) and endomembranes ( 29–31 ). These gave some surprising results for lateral diffusion, which echoed the result of Poo and Cone ( 8 ). Although membrane protein concentrations of the endoplasmic reticulum are high, their diffusion coefficients approach those for proteins reconstituted in liposomes. This contrasts with the lower D value often found for plasma membrane proteins.
FRAP technique was generalized for scanning confocal microscopy (another child of J. S. Ploem’s vertical illuminator), and so became widely available to a community, cell biologists, who formerly had to rely on specialized microscopes in a limited number of laboratories. Although simplifying approximations were required to solve the diffusion equations, especially for the complex geometry of organelles such as endoplasmic reticulum ( 32 ), useful data were be obtained on mobility and on organelle and plasma membrane structure. Confocal FRAP also allowed reliable imaging of bleached and unbleached regions, therefore accounting for loss of fluorescence from unbleached regions as well as recovery of fluorescence in bleached regions in the manner of Poo and Cone ( 8 ). The wide availability of FRAP in commercial instruments allowed its increasing application to problems of protein/protein interactions in three as well as in two dimensions ( 33,34 ). FRAP is also a useful tool in pharmaceutical research, to characterize drug and particle diffusion through biomaterials such as mucus and within drug delivery vehicles, for example hydrogel capsules ( 35 ). Active interest and use of FRAP is evidenced by the continued appearance of new applications for the technique ( 36 ).
Just as FRAP microscopes grew out of hardware originally designed for other purposes (immunofluorescence, cytometry, FCS), new techniques, notably a widely applicable fluorescence resonance energy transfer (FRET), grew out of the FRAP combination of a vertical illuminator and a laser light source for bleaching ( 37 ). FRET is detected in terms of donor dequenching after acceptor photobleaching. An early use of the method is shown in Fig. 5 ( 38 ). As in FRAP experiments, this FRET experiment averages results for a heterogeneous population of molecules that are quenched to different extents. However, the method is robust and needs no special equipment. There are even several IMAGEJ plugins (National Institutes of Health, Bethesda, MD) for analysis. However, the method is gradually being supplanted by fluorescence lifetime methods for FRET in cells ( 39 ).

Practice and analysis of FRET measurements by acceptor photobleaching. ( Top left ) Donor fluorophores ( blue ) in FRET are quenched if they are in proximity (<100 Å) to acceptors ( yellow ). Bleaching the acceptors ( top right ) dequenches donor fluorescence. FRET efficiency is calculated in terms of the change in donor intensity. The dependence of FRET on acceptor concentration reports the extent of molecular clustering ( lower panels ). Based on Kenworthy and Edidin ( 38 ).
FRAP matured to be one of many cell biophysical techniques for the study of membrane dynamics and for high spatial resolution of molecular associations. Its techniques and results also helped to drive newer methods for probing cell membranes and their molecules at increasing resolutions. This year’s Nobel prizes in chemistry are for superresolution microscopies. We are beginning another cycle of instrument development and application. We look forward to dissemination of these techniques and another chapter in the interplay of light and life.
IMAGES
VIDEO
COMMENTS
The Frye-Edidin experiment showed that when two cells are fused the proteins of both diffuse around the membrane and mingle rather than being locked to their area of the membrane. An important experiment that provided evidence supporting fluid and dynamic biological was performed by Frye and Edidin.
The third advance in the understanding of membranes came when it was realized that the membrane is a "fluid" structure in which component molecules are in constant and rapid motion. Although several key measurements and experiments contributed to this breakthrough in our understanding, perhaps the most dramatic was a cell fusion experiment conducted by Larry Frye and Michael Edidin at ...
The classical experiment of Frye and Edidin proved that major histocompatibility complex (MHC) proteins are mobile in the plasma membrane of heterokaryons of human and mouse lymphocytes (Frye and Edidin, 1970).This conclusion was incorporated by Singer and Nicolson into their fluid mosaic membrane model of 1972, which emphasized the random distribution and free lateral mobility of membrane ...
The classic Frye and Edidin heterokaryon surface-protein-mixing experiment using fluorescent-dye-labeled antibodies provided the first indication that proteins on membranes can be mobile. Their study revealed that plasma membrane proteins from two different cells exchange and mix within the fused plasma membrane of the two formerly distinct cells.
A giant step forward was made in 1970 by Frye and Edidin when they fused two cells (one human, one mouse) together in order to monitor the fate of their membranes ( dark green boxes in Figure 3). Each cell carried different surface antigens whose movements could be monitored using a fluorescent antibody.
The Frye and Edidin experiment demonstrated that lateral protein movement within the membrane is affected by. The smooth endoplasmic reticulum is where most eukaryotic membrane. Blank 1: phospholipids, lipids, or components. Phospholipid bilayers are an effective barrier to many charged or polar solutes because of their.
Which of the following is a valid conclusion of the Frye and Edidin experiment? Lateral protein movements within the membrane are temperature-dependent. Match each type of membrane protein with the way it is associated with the plasma membrane. Transmembrane protein: A segment of amino acids is inserted into the phospholipid bilayer. ...
L. D. Frye, M. Edidin; The rapid intermixing of cell surface antigens after formation of mouse human heterokaryons. J Cell ... counted and checked for viability (nigrosin dye exclusion test). Viability was greater than 95 %. The experiment was then continued, using the same procedures as for the short-term inhibition experiments. Table 3 gives ...
WELCOME TO GYANVARSHA TOPIC:- FRYE AND EDIDIN EXPERIMENT || MOBILITY OF MEMBRANE PROTEINSIMPORTANT LINKS:-You can mail us for any query :- gyanvarshaquery@gm...
The Frye and Edidin experiment showed that lateral protein movements within the membrane are temperature dependent. The smooth endoplasmic reticulum is where most eukaryotic membrane _____ are synthesized.
CSIR UGC NET. About Press Copyright Contact us Creators Advertise Developers Terms Privacy Policy & Safety How YouTube works Test new features NFL Sunday Ticket
The Frye-Edidin experiments can be rationalized by the fluid mosaic model of membrane structure as being the result of the free diffusion and intermixing of the lipids and the proteins (or lipoproteins) within the fluid lipid matrix. Some experiments, however, appear to suggest that the lipids of membranes are not readily interchangeable within ...
this video is about membrane protein and lipid movementlateral, rotational, flip-flop, and scramblase movement of lipid. frey and edidin cell fusion experim...
We then discuss the results of the Frye-Edidin (1970) experiments and compare the data with our theoretical values. We conclude that the (human and mouse cell) membranes of the Frye-Edidin experiments are in a phase transition or critical region at 37 °C. ... In a more recent experiment, Taylor, Duffus, Raff & DePetris (1971) observed that ...
This lateral movement was first shown directly in an experiment reported by Larry Frye and Michael Edidin in 1970, which provided support for the fluid mosaic model. Frye and Edidin fused human and mouse cells in culture to produce human-mouse cell hybrids (Figure 12.11). They then analyzed the distribution of proteins in the membranes of these ...
Although the results of this experiment were accurate, Fricke misinterpreted the data to mean that the cell membrane is a single molecular layer. ... This same lateral fluidity was first demonstrated conclusively on the cell surface by Frye and Edidin in 1970. ... M Edidin."Lipids on the frontier: a century of cell-membrane bilayers." Nature ...
Membrane protein fluidity. Frye-Edidin experiment. Click the card to flip 👆. fused to cells with. differently labeled proteins and see what happens. conclusion: membranes are fluid and proteins within the lipid bilayer disperse and temp is the one factor that alters membrane fluidity. Click the card to flip 👆.
The Frye-Edidin experiment was carried out by Larry Frye and Michael Edidin, two researchers at Johns Hopkins University, in 1970. They used cell fusion to elucidate important principles of cell membrane biology.
L D Frye, M Edidin. PMID: 4098863 DOI: 10.1242/jcs.7.2.319 No abstract available. MeSH terms Adenosine Triphosphate / metabolism Animals Antigens* / metabolism Cell Line Cell Membrane / drug effects ...
About Press Copyright Contact us Creators Advertise Developers Terms Privacy Policy & Safety How YouTube works Test new features NFL Sunday Ticket Press Copyright ...
We then discuss the results of the Frye-Edidin (1970) experiments and compare the data with our theoretical values. We conclude that the (human and mouse cell) membranes of the Frye-Edidin experiments are in a phase transition or critical region at 37 °C. Further experiments are proposed to test our assertion.
My student Larry Frye used this microscope and the antibody-labeling method developed by Albert Coons, to demonstrate lateral mobility of proteins in the cell plasma membrane (Frye and Edidin ). Frye's experiment was the first in a series of probes of lateral mobility in cell plasma that all used the same general approach—brief perturbation ...