- Privacy Policy
Home » Research Results Section – Writing Guide and Examples

Research Results Section – Writing Guide and Examples
Table of Contents

Research Results
Research results refer to the findings and conclusions derived from a systematic investigation or study conducted to answer a specific question or hypothesis. These results are typically presented in a written report or paper and can include various forms of data such as numerical data, qualitative data, statistics, charts, graphs, and visual aids.
Results Section in Research
The results section of the research paper presents the findings of the study. It is the part of the paper where the researcher reports the data collected during the study and analyzes it to draw conclusions.
In the results section, the researcher should describe the data that was collected, the statistical analysis performed, and the findings of the study. It is important to be objective and not interpret the data in this section. Instead, the researcher should report the data as accurately and objectively as possible.
Structure of Research Results Section
The structure of the research results section can vary depending on the type of research conducted, but in general, it should contain the following components:
- Introduction: The introduction should provide an overview of the study, its aims, and its research questions. It should also briefly explain the methodology used to conduct the study.
- Data presentation : This section presents the data collected during the study. It may include tables, graphs, or other visual aids to help readers better understand the data. The data presented should be organized in a logical and coherent way, with headings and subheadings used to help guide the reader.
- Data analysis: In this section, the data presented in the previous section are analyzed and interpreted. The statistical tests used to analyze the data should be clearly explained, and the results of the tests should be presented in a way that is easy to understand.
- Discussion of results : This section should provide an interpretation of the results of the study, including a discussion of any unexpected findings. The discussion should also address the study’s research questions and explain how the results contribute to the field of study.
- Limitations: This section should acknowledge any limitations of the study, such as sample size, data collection methods, or other factors that may have influenced the results.
- Conclusions: The conclusions should summarize the main findings of the study and provide a final interpretation of the results. The conclusions should also address the study’s research questions and explain how the results contribute to the field of study.
- Recommendations : This section may provide recommendations for future research based on the study’s findings. It may also suggest practical applications for the study’s results in real-world settings.
Outline of Research Results Section
The following is an outline of the key components typically included in the Results section:
I. Introduction
- A brief overview of the research objectives and hypotheses
- A statement of the research question
II. Descriptive statistics
- Summary statistics (e.g., mean, standard deviation) for each variable analyzed
- Frequencies and percentages for categorical variables
III. Inferential statistics
- Results of statistical analyses, including tests of hypotheses
- Tables or figures to display statistical results
IV. Effect sizes and confidence intervals
- Effect sizes (e.g., Cohen’s d, odds ratio) to quantify the strength of the relationship between variables
- Confidence intervals to estimate the range of plausible values for the effect size
V. Subgroup analyses
- Results of analyses that examined differences between subgroups (e.g., by gender, age, treatment group)
VI. Limitations and assumptions
- Discussion of any limitations of the study and potential sources of bias
- Assumptions made in the statistical analyses
VII. Conclusions
- A summary of the key findings and their implications
- A statement of whether the hypotheses were supported or not
- Suggestions for future research
Example of Research Results Section
An Example of a Research Results Section could be:
- This study sought to examine the relationship between sleep quality and academic performance in college students.
- Hypothesis : College students who report better sleep quality will have higher GPAs than those who report poor sleep quality.
- Methodology : Participants completed a survey about their sleep habits and academic performance.
II. Participants
- Participants were college students (N=200) from a mid-sized public university in the United States.
- The sample was evenly split by gender (50% female, 50% male) and predominantly white (85%).
- Participants were recruited through flyers and online advertisements.
III. Results
- Participants who reported better sleep quality had significantly higher GPAs (M=3.5, SD=0.5) than those who reported poor sleep quality (M=2.9, SD=0.6).
- See Table 1 for a summary of the results.
- Participants who reported consistent sleep schedules had higher GPAs than those with irregular sleep schedules.
IV. Discussion
- The results support the hypothesis that better sleep quality is associated with higher academic performance in college students.
- These findings have implications for college students, as prioritizing sleep could lead to better academic outcomes.
- Limitations of the study include self-reported data and the lack of control for other variables that could impact academic performance.
V. Conclusion
- College students who prioritize sleep may see a positive impact on their academic performance.
- These findings highlight the importance of sleep in academic success.
- Future research could explore interventions to improve sleep quality in college students.
Example of Research Results in Research Paper :
Our study aimed to compare the performance of three different machine learning algorithms (Random Forest, Support Vector Machine, and Neural Network) in predicting customer churn in a telecommunications company. We collected a dataset of 10,000 customer records, with 20 predictor variables and a binary churn outcome variable.
Our analysis revealed that all three algorithms performed well in predicting customer churn, with an overall accuracy of 85%. However, the Random Forest algorithm showed the highest accuracy (88%), followed by the Support Vector Machine (86%) and the Neural Network (84%).
Furthermore, we found that the most important predictor variables for customer churn were monthly charges, contract type, and tenure. Random Forest identified monthly charges as the most important variable, while Support Vector Machine and Neural Network identified contract type as the most important.
Overall, our results suggest that machine learning algorithms can be effective in predicting customer churn in a telecommunications company, and that Random Forest is the most accurate algorithm for this task.
Example 3 :
Title : The Impact of Social Media on Body Image and Self-Esteem
Abstract : This study aimed to investigate the relationship between social media use, body image, and self-esteem among young adults. A total of 200 participants were recruited from a university and completed self-report measures of social media use, body image satisfaction, and self-esteem.
Results: The results showed that social media use was significantly associated with body image dissatisfaction and lower self-esteem. Specifically, participants who reported spending more time on social media platforms had lower levels of body image satisfaction and self-esteem compared to those who reported less social media use. Moreover, the study found that comparing oneself to others on social media was a significant predictor of body image dissatisfaction and lower self-esteem.
Conclusion : These results suggest that social media use can have negative effects on body image satisfaction and self-esteem among young adults. It is important for individuals to be mindful of their social media use and to recognize the potential negative impact it can have on their mental health. Furthermore, interventions aimed at promoting positive body image and self-esteem should take into account the role of social media in shaping these attitudes and behaviors.
Importance of Research Results
Research results are important for several reasons, including:
- Advancing knowledge: Research results can contribute to the advancement of knowledge in a particular field, whether it be in science, technology, medicine, social sciences, or humanities.
- Developing theories: Research results can help to develop or modify existing theories and create new ones.
- Improving practices: Research results can inform and improve practices in various fields, such as education, healthcare, business, and public policy.
- Identifying problems and solutions: Research results can identify problems and provide solutions to complex issues in society, including issues related to health, environment, social justice, and economics.
- Validating claims : Research results can validate or refute claims made by individuals or groups in society, such as politicians, corporations, or activists.
- Providing evidence: Research results can provide evidence to support decision-making, policy-making, and resource allocation in various fields.
How to Write Results in A Research Paper
Here are some general guidelines on how to write results in a research paper:
- Organize the results section: Start by organizing the results section in a logical and coherent manner. Divide the section into subsections if necessary, based on the research questions or hypotheses.
- Present the findings: Present the findings in a clear and concise manner. Use tables, graphs, and figures to illustrate the data and make the presentation more engaging.
- Describe the data: Describe the data in detail, including the sample size, response rate, and any missing data. Provide relevant descriptive statistics such as means, standard deviations, and ranges.
- Interpret the findings: Interpret the findings in light of the research questions or hypotheses. Discuss the implications of the findings and the extent to which they support or contradict existing theories or previous research.
- Discuss the limitations : Discuss the limitations of the study, including any potential sources of bias or confounding factors that may have affected the results.
- Compare the results : Compare the results with those of previous studies or theoretical predictions. Discuss any similarities, differences, or inconsistencies.
- Avoid redundancy: Avoid repeating information that has already been presented in the introduction or methods sections. Instead, focus on presenting new and relevant information.
- Be objective: Be objective in presenting the results, avoiding any personal biases or interpretations.
When to Write Research Results
Here are situations When to Write Research Results”
- After conducting research on the chosen topic and obtaining relevant data, organize the findings in a structured format that accurately represents the information gathered.
- Once the data has been analyzed and interpreted, and conclusions have been drawn, begin the writing process.
- Before starting to write, ensure that the research results adhere to the guidelines and requirements of the intended audience, such as a scientific journal or academic conference.
- Begin by writing an abstract that briefly summarizes the research question, methodology, findings, and conclusions.
- Follow the abstract with an introduction that provides context for the research, explains its significance, and outlines the research question and objectives.
- The next section should be a literature review that provides an overview of existing research on the topic and highlights the gaps in knowledge that the current research seeks to address.
- The methodology section should provide a detailed explanation of the research design, including the sample size, data collection methods, and analytical techniques used.
- Present the research results in a clear and concise manner, using graphs, tables, and figures to illustrate the findings.
- Discuss the implications of the research results, including how they contribute to the existing body of knowledge on the topic and what further research is needed.
- Conclude the paper by summarizing the main findings, reiterating the significance of the research, and offering suggestions for future research.
Purpose of Research Results
The purposes of Research Results are as follows:
- Informing policy and practice: Research results can provide evidence-based information to inform policy decisions, such as in the fields of healthcare, education, and environmental regulation. They can also inform best practices in fields such as business, engineering, and social work.
- Addressing societal problems : Research results can be used to help address societal problems, such as reducing poverty, improving public health, and promoting social justice.
- Generating economic benefits : Research results can lead to the development of new products, services, and technologies that can create economic value and improve quality of life.
- Supporting academic and professional development : Research results can be used to support academic and professional development by providing opportunities for students, researchers, and practitioners to learn about new findings and methodologies in their field.
- Enhancing public understanding: Research results can help to educate the public about important issues and promote scientific literacy, leading to more informed decision-making and better public policy.
- Evaluating interventions: Research results can be used to evaluate the effectiveness of interventions, such as treatments, educational programs, and social policies. This can help to identify areas where improvements are needed and guide future interventions.
- Contributing to scientific progress: Research results can contribute to the advancement of science by providing new insights and discoveries that can lead to new theories, methods, and techniques.
- Informing decision-making : Research results can provide decision-makers with the information they need to make informed decisions. This can include decision-making at the individual, organizational, or governmental levels.
- Fostering collaboration : Research results can facilitate collaboration between researchers and practitioners, leading to new partnerships, interdisciplinary approaches, and innovative solutions to complex problems.
Advantages of Research Results
Some Advantages of Research Results are as follows:
- Improved decision-making: Research results can help inform decision-making in various fields, including medicine, business, and government. For example, research on the effectiveness of different treatments for a particular disease can help doctors make informed decisions about the best course of treatment for their patients.
- Innovation : Research results can lead to the development of new technologies, products, and services. For example, research on renewable energy sources can lead to the development of new and more efficient ways to harness renewable energy.
- Economic benefits: Research results can stimulate economic growth by providing new opportunities for businesses and entrepreneurs. For example, research on new materials or manufacturing techniques can lead to the development of new products and processes that can create new jobs and boost economic activity.
- Improved quality of life: Research results can contribute to improving the quality of life for individuals and society as a whole. For example, research on the causes of a particular disease can lead to the development of new treatments and cures, improving the health and well-being of millions of people.
About the author

Muhammad Hassan
Researcher, Academic Writer, Web developer
You may also like

Scope of the Research – Writing Guide and...

Data Analysis – Process, Methods and Types

Research Paper – Structure, Examples and Writing...

Critical Analysis – Types, Examples and Writing...

APA Research Paper Format – Example, Sample and...

Informed Consent in Research – Types, Templates...
Generate accurate APA citations for free
- Knowledge Base
- APA Style 7th edition
- How to write an APA results section
Reporting Research Results in APA Style | Tips & Examples
Published on December 21, 2020 by Pritha Bhandari . Revised on January 17, 2024.
The results section of a quantitative research paper is where you summarize your data and report the findings of any relevant statistical analyses.
The APA manual provides rigorous guidelines for what to report in quantitative research papers in the fields of psychology, education, and other social sciences.
Use these standards to answer your research questions and report your data analyses in a complete and transparent way.
Instantly correct all language mistakes in your text
Upload your document to correct all your mistakes in minutes

Table of contents
What goes in your results section, introduce your data, summarize your data, report statistical results, presenting numbers effectively, what doesn’t belong in your results section, frequently asked questions about results in apa.
In APA style, the results section includes preliminary information about the participants and data, descriptive and inferential statistics, and the results of any exploratory analyses.
Include these in your results section:
- Participant flow and recruitment period. Report the number of participants at every stage of the study, as well as the dates when recruitment took place.
- Missing data . Identify the proportion of data that wasn’t included in your final analysis and state the reasons.
- Any adverse events. Make sure to report any unexpected events or side effects (for clinical studies).
- Descriptive statistics . Summarize the primary and secondary outcomes of the study.
- Inferential statistics , including confidence intervals and effect sizes. Address the primary and secondary research questions by reporting the detailed results of your main analyses.
- Results of subgroup or exploratory analyses, if applicable. Place detailed results in supplementary materials.
Write up the results in the past tense because you’re describing the outcomes of a completed research study.
Scribbr Citation Checker New
The AI-powered Citation Checker helps you avoid common mistakes such as:
- Missing commas and periods
- Incorrect usage of “et al.”
- Ampersands (&) in narrative citations
- Missing reference entries

Before diving into your research findings, first describe the flow of participants at every stage of your study and whether any data were excluded from the final analysis.
Participant flow and recruitment period
It’s necessary to report any attrition, which is the decline in participants at every sequential stage of a study. That’s because an uneven number of participants across groups sometimes threatens internal validity and makes it difficult to compare groups. Be sure to also state all reasons for attrition.
If your study has multiple stages (e.g., pre-test, intervention, and post-test) and groups (e.g., experimental and control groups), a flow chart is the best way to report the number of participants in each group per stage and reasons for attrition.
Also report the dates for when you recruited participants or performed follow-up sessions.
Missing data
Another key issue is the completeness of your dataset. It’s necessary to report both the amount and reasons for data that was missing or excluded.
Data can become unusable due to equipment malfunctions, improper storage, unexpected events, participant ineligibility, and so on. For each case, state the reason why the data were unusable.
Some data points may be removed from the final analysis because they are outliers—but you must be able to justify how you decided what to exclude.
If you applied any techniques for overcoming or compensating for lost data, report those as well.
Adverse events
For clinical studies, report all events with serious consequences or any side effects that occured.
Descriptive statistics summarize your data for the reader. Present descriptive statistics for each primary, secondary, and subgroup analysis.
Don’t provide formulas or citations for commonly used statistics (e.g., standard deviation) – but do provide them for new or rare equations.
Descriptive statistics
The exact descriptive statistics that you report depends on the types of data in your study. Categorical variables can be reported using proportions, while quantitative data can be reported using means and standard deviations . For a large set of numbers, a table is the most effective presentation format.
Include sample sizes (overall and for each group) as well as appropriate measures of central tendency and variability for the outcomes in your results section. For every point estimate , add a clearly labelled measure of variability as well.
Be sure to note how you combined data to come up with variables of interest. For every variable of interest, explain how you operationalized it.
According to APA journal standards, it’s necessary to report all relevant hypothesis tests performed, estimates of effect sizes, and confidence intervals.
When reporting statistical results, you should first address primary research questions before moving onto secondary research questions and any exploratory or subgroup analyses.
Present the results of tests in the order that you performed them—report the outcomes of main tests before post-hoc tests, for example. Don’t leave out any relevant results, even if they don’t support your hypothesis.
Inferential statistics
For each statistical test performed, first restate the hypothesis , then state whether your hypothesis was supported and provide the outcomes that led you to that conclusion.
Report the following for each hypothesis test:
- the test statistic value,
- the degrees of freedom ,
- the exact p- value (unless it is less than 0.001),
- the magnitude and direction of the effect.
When reporting complex data analyses, such as factor analysis or multivariate analysis, present the models estimated in detail, and state the statistical software used. Make sure to report any violations of statistical assumptions or problems with estimation.
Effect sizes and confidence intervals
For each hypothesis test performed, you should present confidence intervals and estimates of effect sizes .
Confidence intervals are useful for showing the variability around point estimates. They should be included whenever you report population parameter estimates.
Effect sizes indicate how impactful the outcomes of a study are. But since they are estimates, it’s recommended that you also provide confidence intervals of effect sizes.
Subgroup or exploratory analyses
Briefly report the results of any other planned or exploratory analyses you performed. These may include subgroup analyses as well.
Subgroup analyses come with a high chance of false positive results, because performing a large number of comparison or correlation tests increases the chances of finding significant results.
If you find significant results in these analyses, make sure to appropriately report them as exploratory (rather than confirmatory) results to avoid overstating their importance.
While these analyses can be reported in less detail in the main text, you can provide the full analyses in supplementary materials.
Are your APA in-text citations flawless?
The AI-powered APA Citation Checker points out every error, tells you exactly what’s wrong, and explains how to fix it. Say goodbye to losing marks on your assignment!
Get started!
To effectively present numbers, use a mix of text, tables , and figures where appropriate:
- To present three or fewer numbers, try a sentence ,
- To present between 4 and 20 numbers, try a table ,
- To present more than 20 numbers, try a figure .
Since these are general guidelines, use your own judgment and feedback from others for effective presentation of numbers.
Tables and figures should be numbered and have titles, along with relevant notes. Make sure to present data only once throughout the paper and refer to any tables and figures in the text.
Formatting statistics and numbers
It’s important to follow capitalization , italicization, and abbreviation rules when referring to statistics in your paper. There are specific format guidelines for reporting statistics in APA , as well as general rules about writing numbers .
If you are unsure of how to present specific symbols, look up the detailed APA guidelines or other papers in your field.
It’s important to provide a complete picture of your data analyses and outcomes in a concise way. For that reason, raw data and any interpretations of your results are not included in the results section.
It’s rarely appropriate to include raw data in your results section. Instead, you should always save the raw data securely and make them available and accessible to any other researchers who request them.
Making scientific research available to others is a key part of academic integrity and open science.
Interpretation or discussion of results
This belongs in your discussion section. Your results section is where you objectively report all relevant findings and leave them open for interpretation by readers.
While you should state whether the findings of statistical tests lend support to your hypotheses, refrain from forming conclusions to your research questions in the results section.
Explanation of how statistics tests work
For the sake of concise writing, you can safely assume that readers of your paper have professional knowledge of how statistical inferences work.
In an APA results section , you should generally report the following:
- Participant flow and recruitment period.
- Missing data and any adverse events.
- Descriptive statistics about your samples.
- Inferential statistics , including confidence intervals and effect sizes.
- Results of any subgroup or exploratory analyses, if applicable.
According to the APA guidelines, you should report enough detail on inferential statistics so that your readers understand your analyses.
- the test statistic value
- the degrees of freedom
- the exact p value (unless it is less than 0.001)
- the magnitude and direction of the effect
You should also present confidence intervals and estimates of effect sizes where relevant.
In APA style, statistics can be presented in the main text or as tables or figures . To decide how to present numbers, you can follow APA guidelines:
- To present three or fewer numbers, try a sentence,
- To present between 4 and 20 numbers, try a table,
- To present more than 20 numbers, try a figure.
Results are usually written in the past tense , because they are describing the outcome of completed actions.
The results chapter or section simply and objectively reports what you found, without speculating on why you found these results. The discussion interprets the meaning of the results, puts them in context, and explains why they matter.
In qualitative research , results and discussion are sometimes combined. But in quantitative research , it’s considered important to separate the objective results from your interpretation of them.
Cite this Scribbr article
If you want to cite this source, you can copy and paste the citation or click the “Cite this Scribbr article” button to automatically add the citation to our free Citation Generator.
Bhandari, P. (2024, January 17). Reporting Research Results in APA Style | Tips & Examples. Scribbr. Retrieved July 2, 2024, from https://www.scribbr.com/apa-style/results-section/
Is this article helpful?

Pritha Bhandari
Other students also liked, how to write an apa methods section, how to format tables and figures in apa style, reporting statistics in apa style | guidelines & examples, "i thought ai proofreading was useless but..".
I've been using Scribbr for years now and I know it's a service that won't disappoint. It does a good job spotting mistakes”

- Langson Library
- Science Library
- Grunigen Medical Library
- Law Library
- Connect From Off-Campus
- Accessibility
- Gateway Study Center
Email this link
Writing a scientific paper.
- Writing a lab report
- INTRODUCTION
Writing a "good" results section
Figures and Captions in Lab Reports
"Results Checklist" from: How to Write a Good Scientific Paper. Chris A. Mack. SPIE. 2018.
Additional tips for results sections.
- LITERATURE CITED
- Bibliography of guides to scientific writing and presenting
- Peer Review
- Presentations
- Lab Report Writing Guides on the Web
This is the core of the paper. Don't start the results sections with methods you left out of the Materials and Methods section. You need to give an overall description of the experiments and present the data you found.
- Factual statements supported by evidence. Short and sweet without excess words
- Present representative data rather than endlessly repetitive data
- Discuss variables only if they had an effect (positive or negative)
- Use meaningful statistics
- Avoid redundancy. If it is in the tables or captions you may not need to repeat it
A short article by Dr. Brett Couch and Dr. Deena Wassenberg, Biology Program, University of Minnesota
- Present the results of the paper, in logical order, using tables and graphs as necessary.
- Explain the results and show how they help to answer the research questions posed in the Introduction. Evidence does not explain itself; the results must be presented and then explained.
- Avoid: presenting results that are never discussed; presenting results in chronological order rather than logical order; ignoring results that do not support the conclusions;
- Number tables and figures separately beginning with 1 (i.e. Table 1, Table 2, Figure 1, etc.).
- Do not attempt to evaluate the results in this section. Report only what you found; hold all discussion of the significance of the results for the Discussion section.
- It is not necessary to describe every step of your statistical analyses. Scientists understand all about null hypotheses, rejection rules, and so forth and do not need to be reminded of them. Just say something like, "Honeybees did not use the flowers in proportion to their availability (X2 = 7.9, p<0.05, d.f.= 4, chi-square test)." Likewise, cite tables and figures without describing in detail how the data were manipulated. Explanations of this sort should appear in a legend or caption written on the same page as the figure or table.
- You must refer in the text to each figure or table you include in your paper.
- Tables generally should report summary-level data, such as means ± standard deviations, rather than all your raw data. A long list of all your individual observations will mean much less than a few concise, easy-to-read tables or figures that bring out the main findings of your study.
- Only use a figure (graph) when the data lend themselves to a good visual representation. Avoid using figures that show too many variables or trends at once, because they can be hard to understand.
From: https://writingcenter.gmu.edu/guides/imrad-results-discussion
- << Previous: METHODS
- Next: DISCUSSION >>
- Last Updated: Aug 4, 2023 9:33 AM
- URL: https://guides.lib.uci.edu/scientificwriting
Off-campus? Please use the Software VPN and choose the group UCIFull to access licensed content. For more information, please Click here
Software VPN is not available for guests, so they may not have access to some content when connecting from off-campus.
- Affiliate Program

- UNITED STATES
- 台灣 (TAIWAN)
- TÜRKIYE (TURKEY)
- Academic Editing Services
- - Research Paper
- - Journal Manuscript
- - Dissertation
- - College & University Assignments
- Admissions Editing Services
- - Application Essay
- - Personal Statement
- - Recommendation Letter
- - Cover Letter
- - CV/Resume
- Business Editing Services
- - Business Documents
- - Report & Brochure
- - Website & Blog
- Writer Editing Services
- - Script & Screenplay
- Our Editors
- Client Reviews
- Editing & Proofreading Prices
- Wordvice Points
- Partner Discount
- Plagiarism Checker
- APA Citation Generator
- MLA Citation Generator
- Chicago Citation Generator
- Vancouver Citation Generator
- - APA Style
- - MLA Style
- - Chicago Style
- - Vancouver Style
- Writing & Editing Guide
- Academic Resources
- Admissions Resources
How to Write the Results/Findings Section in Research
What is the research paper Results section and what does it do?
The Results section of a scientific research paper represents the core findings of a study derived from the methods applied to gather and analyze information. It presents these findings in a logical sequence without bias or interpretation from the author, setting up the reader for later interpretation and evaluation in the Discussion section. A major purpose of the Results section is to break down the data into sentences that show its significance to the research question(s).
The Results section appears third in the section sequence in most scientific papers. It follows the presentation of the Methods and Materials and is presented before the Discussion section —although the Results and Discussion are presented together in many journals. This section answers the basic question “What did you find in your research?”
What is included in the Results section?
The Results section should include the findings of your study and ONLY the findings of your study. The findings include:
- Data presented in tables, charts, graphs, and other figures (may be placed into the text or on separate pages at the end of the manuscript)
- A contextual analysis of this data explaining its meaning in sentence form
- All data that corresponds to the central research question(s)
- All secondary findings (secondary outcomes, subgroup analyses, etc.)
If the scope of the study is broad, or if you studied a variety of variables, or if the methodology used yields a wide range of different results, the author should present only those results that are most relevant to the research question stated in the Introduction section .
As a general rule, any information that does not present the direct findings or outcome of the study should be left out of this section. Unless the journal requests that authors combine the Results and Discussion sections, explanations and interpretations should be omitted from the Results.
How are the results organized?
The best way to organize your Results section is “logically.” One logical and clear method of organizing research results is to provide them alongside the research questions—within each research question, present the type of data that addresses that research question.
Let’s look at an example. Your research question is based on a survey among patients who were treated at a hospital and received postoperative care. Let’s say your first research question is:

“What do hospital patients over age 55 think about postoperative care?”
This can actually be represented as a heading within your Results section, though it might be presented as a statement rather than a question:
Attitudes towards postoperative care in patients over the age of 55
Now present the results that address this specific research question first. In this case, perhaps a table illustrating data from a survey. Likert items can be included in this example. Tables can also present standard deviations, probabilities, correlation matrices, etc.
Following this, present a content analysis, in words, of one end of the spectrum of the survey or data table. In our example case, start with the POSITIVE survey responses regarding postoperative care, using descriptive phrases. For example:
“Sixty-five percent of patients over 55 responded positively to the question “ Are you satisfied with your hospital’s postoperative care ?” (Fig. 2)
Include other results such as subcategory analyses. The amount of textual description used will depend on how much interpretation of tables and figures is necessary and how many examples the reader needs in order to understand the significance of your research findings.
Next, present a content analysis of another part of the spectrum of the same research question, perhaps the NEGATIVE or NEUTRAL responses to the survey. For instance:
“As Figure 1 shows, 15 out of 60 patients in Group A responded negatively to Question 2.”
After you have assessed the data in one figure and explained it sufficiently, move on to your next research question. For example:
“How does patient satisfaction correspond to in-hospital improvements made to postoperative care?”

This kind of data may be presented through a figure or set of figures (for instance, a paired T-test table).
Explain the data you present, here in a table, with a concise content analysis:
“The p-value for the comparison between the before and after groups of patients was .03% (Fig. 2), indicating that the greater the dissatisfaction among patients, the more frequent the improvements that were made to postoperative care.”
Let’s examine another example of a Results section from a study on plant tolerance to heavy metal stress . In the Introduction section, the aims of the study are presented as “determining the physiological and morphological responses of Allium cepa L. towards increased cadmium toxicity” and “evaluating its potential to accumulate the metal and its associated environmental consequences.” The Results section presents data showing how these aims are achieved in tables alongside a content analysis, beginning with an overview of the findings:
“Cadmium caused inhibition of root and leave elongation, with increasing effects at higher exposure doses (Fig. 1a-c).”
The figure containing this data is cited in parentheses. Note that this author has combined three graphs into one single figure. Separating the data into separate graphs focusing on specific aspects makes it easier for the reader to assess the findings, and consolidating this information into one figure saves space and makes it easy to locate the most relevant results.

Following this overall summary, the relevant data in the tables is broken down into greater detail in text form in the Results section.
- “Results on the bio-accumulation of cadmium were found to be the highest (17.5 mg kgG1) in the bulb, when the concentration of cadmium in the solution was 1×10G2 M and lowest (0.11 mg kgG1) in the leaves when the concentration was 1×10G3 M.”
Captioning and Referencing Tables and Figures
Tables and figures are central components of your Results section and you need to carefully think about the most effective way to use graphs and tables to present your findings . Therefore, it is crucial to know how to write strong figure captions and to refer to them within the text of the Results section.
The most important advice one can give here as well as throughout the paper is to check the requirements and standards of the journal to which you are submitting your work. Every journal has its own design and layout standards, which you can find in the author instructions on the target journal’s website. Perusing a journal’s published articles will also give you an idea of the proper number, size, and complexity of your figures.
Regardless of which format you use, the figures should be placed in the order they are referenced in the Results section and be as clear and easy to understand as possible. If there are multiple variables being considered (within one or more research questions), it can be a good idea to split these up into separate figures. Subsequently, these can be referenced and analyzed under separate headings and paragraphs in the text.
To create a caption, consider the research question being asked and change it into a phrase. For instance, if one question is “Which color did participants choose?”, the caption might be “Color choice by participant group.” Or in our last research paper example, where the question was “What is the concentration of cadmium in different parts of the onion after 14 days?” the caption reads:
“Fig. 1(a-c): Mean concentration of Cd determined in (a) bulbs, (b) leaves, and (c) roots of onions after a 14-day period.”
Steps for Composing the Results Section
Because each study is unique, there is no one-size-fits-all approach when it comes to designing a strategy for structuring and writing the section of a research paper where findings are presented. The content and layout of this section will be determined by the specific area of research, the design of the study and its particular methodologies, and the guidelines of the target journal and its editors. However, the following steps can be used to compose the results of most scientific research studies and are essential for researchers who are new to preparing a manuscript for publication or who need a reminder of how to construct the Results section.
Step 1 : Consult the guidelines or instructions that the target journal or publisher provides authors and read research papers it has published, especially those with similar topics, methods, or results to your study.
- The guidelines will generally outline specific requirements for the results or findings section, and the published articles will provide sound examples of successful approaches.
- Note length limitations on restrictions on content. For instance, while many journals require the Results and Discussion sections to be separate, others do not—qualitative research papers often include results and interpretations in the same section (“Results and Discussion”).
- Reading the aims and scope in the journal’s “ guide for authors ” section and understanding the interests of its readers will be invaluable in preparing to write the Results section.
Step 2 : Consider your research results in relation to the journal’s requirements and catalogue your results.
- Focus on experimental results and other findings that are especially relevant to your research questions and objectives and include them even if they are unexpected or do not support your ideas and hypotheses.
- Catalogue your findings—use subheadings to streamline and clarify your report. This will help you avoid excessive and peripheral details as you write and also help your reader understand and remember your findings. Create appendices that might interest specialists but prove too long or distracting for other readers.
- Decide how you will structure of your results. You might match the order of the research questions and hypotheses to your results, or you could arrange them according to the order presented in the Methods section. A chronological order or even a hierarchy of importance or meaningful grouping of main themes or categories might prove effective. Consider your audience, evidence, and most importantly, the objectives of your research when choosing a structure for presenting your findings.
Step 3 : Design figures and tables to present and illustrate your data.
- Tables and figures should be numbered according to the order in which they are mentioned in the main text of the paper.
- Information in figures should be relatively self-explanatory (with the aid of captions), and their design should include all definitions and other information necessary for readers to understand the findings without reading all of the text.
- Use tables and figures as a focal point to tell a clear and informative story about your research and avoid repeating information. But remember that while figures clarify and enhance the text, they cannot replace it.
Step 4 : Draft your Results section using the findings and figures you have organized.
- The goal is to communicate this complex information as clearly and precisely as possible; precise and compact phrases and sentences are most effective.
- In the opening paragraph of this section, restate your research questions or aims to focus the reader’s attention to what the results are trying to show. It is also a good idea to summarize key findings at the end of this section to create a logical transition to the interpretation and discussion that follows.
- Try to write in the past tense and the active voice to relay the findings since the research has already been done and the agent is usually clear. This will ensure that your explanations are also clear and logical.
- Make sure that any specialized terminology or abbreviation you have used here has been defined and clarified in the Introduction section .
Step 5 : Review your draft; edit and revise until it reports results exactly as you would like to have them reported to your readers.
- Double-check the accuracy and consistency of all the data, as well as all of the visual elements included.
- Read your draft aloud to catch language errors (grammar, spelling, and mechanics), awkward phrases, and missing transitions.
- Ensure that your results are presented in the best order to focus on objectives and prepare readers for interpretations, valuations, and recommendations in the Discussion section . Look back over the paper’s Introduction and background while anticipating the Discussion and Conclusion sections to ensure that the presentation of your results is consistent and effective.
- Consider seeking additional guidance on your paper. Find additional readers to look over your Results section and see if it can be improved in any way. Peers, professors, or qualified experts can provide valuable insights.
One excellent option is to use a professional English proofreading and editing service such as Wordvice, including our paper editing service . With hundreds of qualified editors from dozens of scientific fields, Wordvice has helped thousands of authors revise their manuscripts and get accepted into their target journals. Read more about the proofreading and editing process before proceeding with getting academic editing services and manuscript editing services for your manuscript.
As the representation of your study’s data output, the Results section presents the core information in your research paper. By writing with clarity and conciseness and by highlighting and explaining the crucial findings of their study, authors increase the impact and effectiveness of their research manuscripts.
For more articles and videos on writing your research manuscript, visit Wordvice’s Resources page.
Wordvice Resources
- How to Write a Research Paper Introduction
- Which Verb Tenses to Use in a Research Paper
- How to Write an Abstract for a Research Paper
- How to Write a Research Paper Title
- Useful Phrases for Academic Writing
- Common Transition Terms in Academic Papers
- Active and Passive Voice in Research Papers
- 100+ Verbs That Will Make Your Research Writing Amazing
- Tips for Paraphrasing in Research Papers
- Research Process
- Manuscript Preparation
- Manuscript Review
- Publication Process
- Publication Recognition
- Language Editing Services
- Translation Services

How to write the results section of a research paper
- 3 minute read
Table of Contents
At its core, a research paper aims to fill a gap in the research on a given topic. As a result, the results section of the paper, which describes the key findings of the study, is often considered the core of the paper. This is the section that gets the most attention from reviewers, peers, students, and any news organization reporting on your findings. Writing a clear, concise, and logical results section is, therefore, one of the most important parts of preparing your manuscript.
Difference between results and discussion
Before delving into how to write the results section, it is important to first understand the difference between the results and discussion sections. The results section needs to detail the findings of the study. The aim of this section is not to draw connections between the different findings or to compare it to previous findings in literature—that is the purview of the discussion section. Unlike the discussion section, which can touch upon the hypothetical, the results section needs to focus on the purely factual. In some cases, it may even be preferable to club these two sections together into a single section. For example, while writing a review article, it can be worthwhile to club these two sections together, as the main results in this case are the conclusions that can be drawn from the literature.
Structure of the results section
Although the main purpose of the results section in a research paper is to report the findings, it is necessary to present an introduction and repeat the research question. This establishes a connection to the previous section of the paper and creates a smooth flow of information.
Next, the results section needs to communicate the findings of your research in a systematic manner. The section needs to be organized such that the primary research question is addressed first, then the secondary research questions. If the research addresses multiple questions, the results section must individually connect with each of the questions. This ensures clarity and minimizes confusion while reading.
Consider representing your results visually. For example, graphs, tables, and other figures can help illustrate the findings of your paper, especially if there is a large amount of data in the results.
Remember, an appealing results section can help peer reviewers better understand the merits of your research, thereby increasing your chances of publication.
Practical guidance for writing an effective results section for a research paper
- Always use simple and clear language. Avoid the use of uncertain or out-of-focus expressions.
- The findings of the study must be expressed in an objective and unbiased manner. While it is acceptable to correlate certain findings in the discussion section, it is best to avoid overinterpreting the results.
- If the research addresses more than one hypothesis, use sub-sections to describe the results. This prevents confusion and promotes understanding.
- Ensure that negative results are included in this section, even if they do not support the research hypothesis.
- Wherever possible, use illustrations like tables, figures, charts, or other visual representations to showcase the results of your research paper. Mention these illustrations in the text, but do not repeat the information that they convey.
- For statistical data, it is adequate to highlight the tests and explain their results. The initial or raw data should not be mentioned in the results section of a research paper.
The results section of a research paper is usually the most impactful section because it draws the greatest attention. Regardless of the subject of your research paper, a well-written results section is capable of generating interest in your research.
For detailed information and assistance on writing the results of a research paper, refer to Elsevier Author Services.

Writing a good review article

Why is data validation important in research?
You may also like.

Page-Turner Articles are More Than Just Good Arguments: Be Mindful of Tone and Structure!

A Must-see for Researchers! How to Ensure Inclusivity in Your Scientific Writing

Make Hook, Line, and Sinker: The Art of Crafting Engaging Introductions

Can Describing Study Limitations Improve the Quality of Your Paper?

A Guide to Crafting Shorter, Impactful Sentences in Academic Writing

6 Steps to Write an Excellent Discussion in Your Manuscript

How to Write Clear and Crisp Civil Engineering Papers? Here are 5 Key Tips to Consider

The Clear Path to An Impactful Paper: ②
Input your search keywords and press Enter.
- USC Libraries
- Research Guides
Organizing Your Social Sciences Research Paper
- 7. The Results
- Purpose of Guide
- Design Flaws to Avoid
- Independent and Dependent Variables
- Glossary of Research Terms
- Reading Research Effectively
- Narrowing a Topic Idea
- Broadening a Topic Idea
- Extending the Timeliness of a Topic Idea
- Academic Writing Style
- Applying Critical Thinking
- Choosing a Title
- Making an Outline
- Paragraph Development
- Research Process Video Series
- Executive Summary
- The C.A.R.S. Model
- Background Information
- The Research Problem/Question
- Theoretical Framework
- Citation Tracking
- Content Alert Services
- Evaluating Sources
- Primary Sources
- Secondary Sources
- Tiertiary Sources
- Scholarly vs. Popular Publications
- Qualitative Methods
- Quantitative Methods
- Insiderness
- Using Non-Textual Elements
- Limitations of the Study
- Common Grammar Mistakes
- Writing Concisely
- Avoiding Plagiarism
- Footnotes or Endnotes?
- Further Readings
- Generative AI and Writing
- USC Libraries Tutorials and Other Guides
- Bibliography
The results section is where you report the findings of your study based upon the methodology [or methodologies] you applied to gather information. The results section should state the findings of the research arranged in a logical sequence without bias or interpretation. A section describing results should be particularly detailed if your paper includes data generated from your own research.
Annesley, Thomas M. "Show Your Cards: The Results Section and the Poker Game." Clinical Chemistry 56 (July 2010): 1066-1070.
Importance of a Good Results Section
When formulating the results section, it's important to remember that the results of a study do not prove anything . Findings can only confirm or reject the hypothesis underpinning your study. However, the act of articulating the results helps you to understand the problem from within, to break it into pieces, and to view the research problem from various perspectives.
The page length of this section is set by the amount and types of data to be reported . Be concise. Use non-textual elements appropriately, such as figures and tables, to present findings more effectively. In deciding what data to describe in your results section, you must clearly distinguish information that would normally be included in a research paper from any raw data or other content that could be included as an appendix. In general, raw data that has not been summarized should not be included in the main text of your paper unless requested to do so by your professor.
Avoid providing data that is not critical to answering the research question . The background information you described in the introduction section should provide the reader with any additional context or explanation needed to understand the results. A good strategy is to always re-read the background section of your paper after you have written up your results to ensure that the reader has enough context to understand the results [and, later, how you interpreted the results in the discussion section of your paper that follows].
Bavdekar, Sandeep B. and Sneha Chandak. "Results: Unraveling the Findings." Journal of the Association of Physicians of India 63 (September 2015): 44-46; Brett, Paul. "A Genre Analysis of the Results Section of Sociology Articles." English for Specific Speakers 13 (1994): 47-59; Go to English for Specific Purposes on ScienceDirect;Burton, Neil et al. Doing Your Education Research Project . Los Angeles, CA: SAGE, 2008; Results. The Structure, Format, Content, and Style of a Journal-Style Scientific Paper. Department of Biology. Bates College; Kretchmer, Paul. Twelve Steps to Writing an Effective Results Section. San Francisco Edit; "Reporting Findings." In Making Sense of Social Research Malcolm Williams, editor. (London;: SAGE Publications, 2003) pp. 188-207.
Structure and Writing Style
I. Organization and Approach
For most research papers in the social and behavioral sciences, there are two possible ways of organizing the results . Both approaches are appropriate in how you report your findings, but use only one approach.
- Present a synopsis of the results followed by an explanation of key findings . This approach can be used to highlight important findings. For example, you may have noticed an unusual correlation between two variables during the analysis of your findings. It is appropriate to highlight this finding in the results section. However, speculating as to why this correlation exists and offering a hypothesis about what may be happening belongs in the discussion section of your paper.
- Present a result and then explain it, before presenting the next result then explaining it, and so on, then end with an overall synopsis . This is the preferred approach if you have multiple results of equal significance. It is more common in longer papers because it helps the reader to better understand each finding. In this model, it is helpful to provide a brief conclusion that ties each of the findings together and provides a narrative bridge to the discussion section of the your paper.
NOTE: Just as the literature review should be arranged under conceptual categories rather than systematically describing each source, you should also organize your findings under key themes related to addressing the research problem. This can be done under either format noted above [i.e., a thorough explanation of the key results or a sequential, thematic description and explanation of each finding].
II. Content
In general, the content of your results section should include the following:
- Introductory context for understanding the results by restating the research problem underpinning your study . This is useful in re-orientating the reader's focus back to the research problem after having read a review of the literature and your explanation of the methods used for gathering and analyzing information.
- Inclusion of non-textual elements, such as, figures, charts, photos, maps, tables, etc. to further illustrate key findings, if appropriate . Rather than relying entirely on descriptive text, consider how your findings can be presented visually. This is a helpful way of condensing a lot of data into one place that can then be referred to in the text. Consider referring to appendices if there is a lot of non-textual elements.
- A systematic description of your results, highlighting for the reader observations that are most relevant to the topic under investigation . Not all results that emerge from the methodology used to gather information may be related to answering the " So What? " question. Do not confuse observations with interpretations; observations in this context refers to highlighting important findings you discovered through a process of reviewing prior literature and gathering data.
- The page length of your results section is guided by the amount and types of data to be reported . However, focus on findings that are important and related to addressing the research problem. It is not uncommon to have unanticipated results that are not relevant to answering the research question. This is not to say that you don't acknowledge tangential findings and, in fact, can be referred to as areas for further research in the conclusion of your paper. However, spending time in the results section describing tangential findings clutters your overall results section and distracts the reader.
- A short paragraph that concludes the results section by synthesizing the key findings of the study . Highlight the most important findings you want readers to remember as they transition into the discussion section. This is particularly important if, for example, there are many results to report, the findings are complicated or unanticipated, or they are impactful or actionable in some way [i.e., able to be pursued in a feasible way applied to practice].
NOTE: Always use the past tense when referring to your study's findings. Reference to findings should always be described as having already happened because the method used to gather the information has been completed.
III. Problems to Avoid
When writing the results section, avoid doing the following :
- Discussing or interpreting your results . Save this for the discussion section of your paper, although where appropriate, you should compare or contrast specific results to those found in other studies [e.g., "Similar to the work of Smith [1990], one of the findings of this study is the strong correlation between motivation and academic achievement...."].
- Reporting background information or attempting to explain your findings. This should have been done in your introduction section, but don't panic! Often the results of a study point to the need for additional background information or to explain the topic further, so don't think you did something wrong. Writing up research is rarely a linear process. Always revise your introduction as needed.
- Ignoring negative results . A negative result generally refers to a finding that does not support the underlying assumptions of your study. Do not ignore them. Document these findings and then state in your discussion section why you believe a negative result emerged from your study. Note that negative results, and how you handle them, can give you an opportunity to write a more engaging discussion section, therefore, don't be hesitant to highlight them.
- Including raw data or intermediate calculations . Ask your professor if you need to include any raw data generated by your study, such as transcripts from interviews or data files. If raw data is to be included, place it in an appendix or set of appendices that are referred to in the text.
- Be as factual and concise as possible in reporting your findings . Do not use phrases that are vague or non-specific, such as, "appeared to be greater than other variables..." or "demonstrates promising trends that...." Subjective modifiers should be explained in the discussion section of the paper [i.e., why did one variable appear greater? Or, how does the finding demonstrate a promising trend?].
- Presenting the same data or repeating the same information more than once . If you want to highlight a particular finding, it is appropriate to do so in the results section. However, you should emphasize its significance in relation to addressing the research problem in the discussion section. Do not repeat it in your results section because you can do that in the conclusion of your paper.
- Confusing figures with tables . Be sure to properly label any non-textual elements in your paper. Don't call a chart an illustration or a figure a table. If you are not sure, go here .
Annesley, Thomas M. "Show Your Cards: The Results Section and the Poker Game." Clinical Chemistry 56 (July 2010): 1066-1070; Bavdekar, Sandeep B. and Sneha Chandak. "Results: Unraveling the Findings." Journal of the Association of Physicians of India 63 (September 2015): 44-46; Burton, Neil et al. Doing Your Education Research Project . Los Angeles, CA: SAGE, 2008; Caprette, David R. Writing Research Papers. Experimental Biosciences Resources. Rice University; Hancock, Dawson R. and Bob Algozzine. Doing Case Study Research: A Practical Guide for Beginning Researchers . 2nd ed. New York: Teachers College Press, 2011; Introduction to Nursing Research: Reporting Research Findings. Nursing Research: Open Access Nursing Research and Review Articles. (January 4, 2012); Kretchmer, Paul. Twelve Steps to Writing an Effective Results Section. San Francisco Edit ; Ng, K. H. and W. C. Peh. "Writing the Results." Singapore Medical Journal 49 (2008): 967-968; Reporting Research Findings. Wilder Research, in partnership with the Minnesota Department of Human Services. (February 2009); Results. The Structure, Format, Content, and Style of a Journal-Style Scientific Paper. Department of Biology. Bates College; Schafer, Mickey S. Writing the Results. Thesis Writing in the Sciences. Course Syllabus. University of Florida.
Writing Tip
Why Don't I Just Combine the Results Section with the Discussion Section?
It's not unusual to find articles in scholarly social science journals where the author(s) have combined a description of the findings with a discussion about their significance and implications. You could do this. However, if you are inexperienced writing research papers, consider creating two distinct sections for each section in your paper as a way to better organize your thoughts and, by extension, your paper. Think of the results section as the place where you report what your study found; think of the discussion section as the place where you interpret the information and answer the "So What?" question. As you become more skilled writing research papers, you can consider melding the results of your study with a discussion of its implications.
Driscoll, Dana Lynn and Aleksandra Kasztalska. Writing the Experimental Report: Methods, Results, and Discussion. The Writing Lab and The OWL. Purdue University.
- << Previous: Insiderness
- Next: Using Non-Textual Elements >>
- Last Updated: Jun 18, 2024 10:45 AM
- URL: https://libguides.usc.edu/writingguide
How To Write The Results/Findings Chapter
For quantitative studies (dissertations & theses).
By: Derek Jansen (MBA) | Expert Reviewed By: Kerryn Warren (PhD) | July 2021
So, you’ve completed your quantitative data analysis and it’s time to report on your findings. But where do you start? In this post, we’ll walk you through the results chapter (also called the findings or analysis chapter), step by step, so that you can craft this section of your dissertation or thesis with confidence. If you’re looking for information regarding the results chapter for qualitative studies, you can find that here .
Overview: Quantitative Results Chapter
- What exactly the results chapter is
- What you need to include in your chapter
- How to structure the chapter
- Tips and tricks for writing a top-notch chapter
- Free results chapter template
What exactly is the results chapter?
The results chapter (also referred to as the findings or analysis chapter) is one of the most important chapters of your dissertation or thesis because it shows the reader what you’ve found in terms of the quantitative data you’ve collected. It presents the data using a clear text narrative, supported by tables, graphs and charts. In doing so, it also highlights any potential issues (such as outliers or unusual findings) you’ve come across.
But how’s that different from the discussion chapter?
Well, in the results chapter, you only present your statistical findings. Only the numbers, so to speak – no more, no less. Contrasted to this, in the discussion chapter , you interpret your findings and link them to prior research (i.e. your literature review), as well as your research objectives and research questions . In other words, the results chapter presents and describes the data, while the discussion chapter interprets the data.
Let’s look at an example.
In your results chapter, you may have a plot that shows how respondents to a survey responded: the numbers of respondents per category, for instance. You may also state whether this supports a hypothesis by using a p-value from a statistical test. But it is only in the discussion chapter where you will say why this is relevant or how it compares with the literature or the broader picture. So, in your results chapter, make sure that you don’t present anything other than the hard facts – this is not the place for subjectivity.
It’s worth mentioning that some universities prefer you to combine the results and discussion chapters. Even so, it is good practice to separate the results and discussion elements within the chapter, as this ensures your findings are fully described. Typically, though, the results and discussion chapters are split up in quantitative studies. If you’re unsure, chat with your research supervisor or chair to find out what their preference is.

What should you include in the results chapter?
Following your analysis, it’s likely you’ll have far more data than are necessary to include in your chapter. In all likelihood, you’ll have a mountain of SPSS or R output data, and it’s your job to decide what’s most relevant. You’ll need to cut through the noise and focus on the data that matters.
This doesn’t mean that those analyses were a waste of time – on the contrary, those analyses ensure that you have a good understanding of your dataset and how to interpret it. However, that doesn’t mean your reader or examiner needs to see the 165 histograms you created! Relevance is key.
How do I decide what’s relevant?
At this point, it can be difficult to strike a balance between what is and isn’t important. But the most important thing is to ensure your results reflect and align with the purpose of your study . So, you need to revisit your research aims, objectives and research questions and use these as a litmus test for relevance. Make sure that you refer back to these constantly when writing up your chapter so that you stay on track.

As a general guide, your results chapter will typically include the following:
- Some demographic data about your sample
- Reliability tests (if you used measurement scales)
- Descriptive statistics
- Inferential statistics (if your research objectives and questions require these)
- Hypothesis tests (again, if your research objectives and questions require these)
We’ll discuss each of these points in more detail in the next section.
Importantly, your results chapter needs to lay the foundation for your discussion chapter . This means that, in your results chapter, you need to include all the data that you will use as the basis for your interpretation in the discussion chapter.
For example, if you plan to highlight the strong relationship between Variable X and Variable Y in your discussion chapter, you need to present the respective analysis in your results chapter – perhaps a correlation or regression analysis.
Need a helping hand?
How do I write the results chapter?
There are multiple steps involved in writing up the results chapter for your quantitative research. The exact number of steps applicable to you will vary from study to study and will depend on the nature of the research aims, objectives and research questions . However, we’ll outline the generic steps below.
Step 1 – Revisit your research questions
The first step in writing your results chapter is to revisit your research objectives and research questions . These will be (or at least, should be!) the driving force behind your results and discussion chapters, so you need to review them and then ask yourself which statistical analyses and tests (from your mountain of data) would specifically help you address these . For each research objective and research question, list the specific piece (or pieces) of analysis that address it.
At this stage, it’s also useful to think about the key points that you want to raise in your discussion chapter and note these down so that you have a clear reminder of which data points and analyses you want to highlight in the results chapter. Again, list your points and then list the specific piece of analysis that addresses each point.
Next, you should draw up a rough outline of how you plan to structure your chapter . Which analyses and statistical tests will you present and in what order? We’ll discuss the “standard structure” in more detail later, but it’s worth mentioning now that it’s always useful to draw up a rough outline before you start writing (this advice applies to any chapter).
Step 2 – Craft an overview introduction
As with all chapters in your dissertation or thesis, you should start your quantitative results chapter by providing a brief overview of what you’ll do in the chapter and why . For example, you’d explain that you will start by presenting demographic data to understand the representativeness of the sample, before moving onto X, Y and Z.
This section shouldn’t be lengthy – a paragraph or two maximum. Also, it’s a good idea to weave the research questions into this section so that there’s a golden thread that runs through the document.

Step 3 – Present the sample demographic data
The first set of data that you’ll present is an overview of the sample demographics – in other words, the demographics of your respondents.
For example:
- What age range are they?
- How is gender distributed?
- How is ethnicity distributed?
- What areas do the participants live in?
The purpose of this is to assess how representative the sample is of the broader population. This is important for the sake of the generalisability of the results. If your sample is not representative of the population, you will not be able to generalise your findings. This is not necessarily the end of the world, but it is a limitation you’ll need to acknowledge.
Of course, to make this representativeness assessment, you’ll need to have a clear view of the demographics of the population. So, make sure that you design your survey to capture the correct demographic information that you will compare your sample to.
But what if I’m not interested in generalisability?
Well, even if your purpose is not necessarily to extrapolate your findings to the broader population, understanding your sample will allow you to interpret your findings appropriately, considering who responded. In other words, it will help you contextualise your findings . For example, if 80% of your sample was aged over 65, this may be a significant contextual factor to consider when interpreting the data. Therefore, it’s important to understand and present the demographic data.
Step 4 – Review composite measures and the data “shape”.
Before you undertake any statistical analysis, you’ll need to do some checks to ensure that your data are suitable for the analysis methods and techniques you plan to use. If you try to analyse data that doesn’t meet the assumptions of a specific statistical technique, your results will be largely meaningless. Therefore, you may need to show that the methods and techniques you’ll use are “allowed”.
Most commonly, there are two areas you need to pay attention to:
#1: Composite measures
The first is when you have multiple scale-based measures that combine to capture one construct – this is called a composite measure . For example, you may have four Likert scale-based measures that (should) all measure the same thing, but in different ways. In other words, in a survey, these four scales should all receive similar ratings. This is called “ internal consistency ”.
Internal consistency is not guaranteed though (especially if you developed the measures yourself), so you need to assess the reliability of each composite measure using a test. Typically, Cronbach’s Alpha is a common test used to assess internal consistency – i.e., to show that the items you’re combining are more or less saying the same thing. A high alpha score means that your measure is internally consistent. A low alpha score means you may need to consider scrapping one or more of the measures.
#2: Data shape
The second matter that you should address early on in your results chapter is data shape. In other words, you need to assess whether the data in your set are symmetrical (i.e. normally distributed) or not, as this will directly impact what type of analyses you can use. For many common inferential tests such as T-tests or ANOVAs (we’ll discuss these a bit later), your data needs to be normally distributed. If it’s not, you’ll need to adjust your strategy and use alternative tests.
To assess the shape of the data, you’ll usually assess a variety of descriptive statistics (such as the mean, median and skewness), which is what we’ll look at next.

Step 5 – Present the descriptive statistics
Now that you’ve laid the foundation by discussing the representativeness of your sample, as well as the reliability of your measures and the shape of your data, you can get started with the actual statistical analysis. The first step is to present the descriptive statistics for your variables.
For scaled data, this usually includes statistics such as:
- The mean – this is simply the mathematical average of a range of numbers.
- The median – this is the midpoint in a range of numbers when the numbers are arranged in order.
- The mode – this is the most commonly repeated number in the data set.
- Standard deviation – this metric indicates how dispersed a range of numbers is. In other words, how close all the numbers are to the mean (the average).
- Skewness – this indicates how symmetrical a range of numbers is. In other words, do they tend to cluster into a smooth bell curve shape in the middle of the graph (this is called a normal or parametric distribution), or do they lean to the left or right (this is called a non-normal or non-parametric distribution).
- Kurtosis – this metric indicates whether the data are heavily or lightly-tailed, relative to the normal distribution. In other words, how peaked or flat the distribution is.
A large table that indicates all the above for multiple variables can be a very effective way to present your data economically. You can also use colour coding to help make the data more easily digestible.
For categorical data, where you show the percentage of people who chose or fit into a category, for instance, you can either just plain describe the percentages or numbers of people who responded to something or use graphs and charts (such as bar graphs and pie charts) to present your data in this section of the chapter.
When using figures, make sure that you label them simply and clearly , so that your reader can easily understand them. There’s nothing more frustrating than a graph that’s missing axis labels! Keep in mind that although you’ll be presenting charts and graphs, your text content needs to present a clear narrative that can stand on its own. In other words, don’t rely purely on your figures and tables to convey your key points: highlight the crucial trends and values in the text. Figures and tables should complement the writing, not carry it .
Depending on your research aims, objectives and research questions, you may stop your analysis at this point (i.e. descriptive statistics). However, if your study requires inferential statistics, then it’s time to deep dive into those .

Step 6 – Present the inferential statistics
Inferential statistics are used to make generalisations about a population , whereas descriptive statistics focus purely on the sample . Inferential statistical techniques, broadly speaking, can be broken down into two groups .
First, there are those that compare measurements between groups , such as t-tests (which measure differences between two groups) and ANOVAs (which measure differences between multiple groups). Second, there are techniques that assess the relationships between variables , such as correlation analysis and regression analysis. Within each of these, some tests can be used for normally distributed (parametric) data and some tests are designed specifically for use on non-parametric data.
There are a seemingly endless number of tests that you can use to crunch your data, so it’s easy to run down a rabbit hole and end up with piles of test data. Ultimately, the most important thing is to make sure that you adopt the tests and techniques that allow you to achieve your research objectives and answer your research questions .
In this section of the results chapter, you should try to make use of figures and visual components as effectively as possible. For example, if you present a correlation table, use colour coding to highlight the significance of the correlation values, or scatterplots to visually demonstrate what the trend is. The easier you make it for your reader to digest your findings, the more effectively you’ll be able to make your arguments in the next chapter.

Step 7 – Test your hypotheses
If your study requires it, the next stage is hypothesis testing. A hypothesis is a statement , often indicating a difference between groups or relationship between variables, that can be supported or rejected by a statistical test. However, not all studies will involve hypotheses (again, it depends on the research objectives), so don’t feel like you “must” present and test hypotheses just because you’re undertaking quantitative research.
The basic process for hypothesis testing is as follows:
- Specify your null hypothesis (for example, “The chemical psilocybin has no effect on time perception).
- Specify your alternative hypothesis (e.g., “The chemical psilocybin has an effect on time perception)
- Set your significance level (this is usually 0.05)
- Calculate your statistics and find your p-value (e.g., p=0.01)
- Draw your conclusions (e.g., “The chemical psilocybin does have an effect on time perception”)
Finally, if the aim of your study is to develop and test a conceptual framework , this is the time to present it, following the testing of your hypotheses. While you don’t need to develop or discuss these findings further in the results chapter, indicating whether the tests (and their p-values) support or reject the hypotheses is crucial.
Step 8 – Provide a chapter summary
To wrap up your results chapter and transition to the discussion chapter, you should provide a brief summary of the key findings . “Brief” is the keyword here – much like the chapter introduction, this shouldn’t be lengthy – a paragraph or two maximum. Highlight the findings most relevant to your research objectives and research questions, and wrap it up.
Some final thoughts, tips and tricks
Now that you’ve got the essentials down, here are a few tips and tricks to make your quantitative results chapter shine:
- When writing your results chapter, report your findings in the past tense . You’re talking about what you’ve found in your data, not what you are currently looking for or trying to find.
- Structure your results chapter systematically and sequentially . If you had two experiments where findings from the one generated inputs into the other, report on them in order.
- Make your own tables and graphs rather than copying and pasting them from statistical analysis programmes like SPSS. Check out the DataIsBeautiful reddit for some inspiration.
- Once you’re done writing, review your work to make sure that you have provided enough information to answer your research questions , but also that you didn’t include superfluous information.
If you’ve got any questions about writing up the quantitative results chapter, please leave a comment below. If you’d like 1-on-1 assistance with your quantitative analysis and discussion, check out our hands-on coaching service , or book a free consultation with a friendly coach.

Psst... there’s more!
This post was based on one of our popular Research Bootcamps . If you're working on a research project, you'll definitely want to check this out ...
You Might Also Like:
")
Thank you. I will try my best to write my results.

Awesome content 👏🏾

this was great explaination
Submit a Comment Cancel reply
Your email address will not be published. Required fields are marked *
Save my name, email, and website in this browser for the next time I comment.
- Print Friendly
Guide to Writing the Results and Discussion Sections of a Scientific Article
A quality research paper has both the qualities of in-depth research and good writing ( Bordage, 2001 ). In addition, a research paper must be clear, concise, and effective when presenting the information in an organized structure with a logical manner ( Sandercock, 2013 ).
In this article, we will take a closer look at the results and discussion section. Composing each of these carefully with sufficient data and well-constructed arguments can help improve your paper overall.

The results section of your research paper contains a description about the main findings of your research, whereas the discussion section interprets the results for readers and provides the significance of the findings. The discussion should not repeat the results.
Let’s dive in a little deeper about how to properly, and clearly organize each part.
How to Organize the Results Section
Since your results follow your methods, you’ll want to provide information about what you discovered from the methods you used, such as your research data. In other words, what were the outcomes of the methods you used?
You may also include information about the measurement of your data, variables, treatments, and statistical analyses.
To start, organize your research data based on how important those are in relation to your research questions. This section should focus on showing major results that support or reject your research hypothesis. Include your least important data as supplemental materials when submitting to the journal.
The next step is to prioritize your research data based on importance – focusing heavily on the information that directly relates to your research questions using the subheadings.
The organization of the subheadings for the results section usually mirrors the methods section. It should follow a logical and chronological order.
Subheading organization
Subheadings within your results section are primarily going to detail major findings within each important experiment. And the first paragraph of your results section should be dedicated to your main findings (findings that answer your overall research question and lead to your conclusion) (Hofmann, 2013).
In the book “Writing in the Biological Sciences,” author Angelika Hofmann recommends you structure your results subsection paragraphs as follows:
- Experimental purpose
- Interpretation
Each subheading may contain a combination of ( Bahadoran, 2019 ; Hofmann, 2013, pg. 62-63):
- Text: to explain about the research data
- Figures: to display the research data and to show trends or relationships, for examples using graphs or gel pictures.
- Tables: to represent a large data and exact value
Decide on the best way to present your data — in the form of text, figures or tables (Hofmann, 2013).
Data or Results?
Sometimes we get confused about how to differentiate between data and results . Data are information (facts or numbers) that you collected from your research ( Bahadoran, 2019 ).

Whereas, results are the texts presenting the meaning of your research data ( Bahadoran, 2019 ).

One mistake that some authors often make is to use text to direct the reader to find a specific table or figure without further explanation. This can confuse readers when they interpret data completely different from what the authors had in mind. So, you should briefly explain your data to make your information clear for the readers.
Common Elements in Figures and Tables
Figures and tables present information about your research data visually. The use of these visual elements is necessary so readers can summarize, compare, and interpret large data at a glance. You can use graphs or figures to compare groups or patterns. Whereas, tables are ideal to present large quantities of data and exact values.
Several components are needed to create your figures and tables. These elements are important to sort your data based on groups (or treatments). It will be easier for the readers to see the similarities and differences among the groups.
When presenting your research data in the form of figures and tables, organize your data based on the steps of the research leading you into a conclusion.
Common elements of the figures (Bahadoran, 2019):
- Figure number
- Figure title
- Figure legend (for example a brief title, experimental/statistical information, or definition of symbols).

Tables in the result section may contain several elements (Bahadoran, 2019):
- Table number
- Table title
- Row headings (for example groups)
- Column headings
- Row subheadings (for example categories or groups)
- Column subheadings (for example categories or variables)
- Footnotes (for example statistical analyses)

Tips to Write the Results Section
- Direct the reader to the research data and explain the meaning of the data.
- Avoid using a repetitive sentence structure to explain a new set of data.
- Write and highlight important findings in your results.
- Use the same order as the subheadings of the methods section.
- Match the results with the research questions from the introduction. Your results should answer your research questions.
- Be sure to mention the figures and tables in the body of your text.
- Make sure there is no mismatch between the table number or the figure number in text and in figure/tables.
- Only present data that support the significance of your study. You can provide additional data in tables and figures as supplementary material.
How to Organize the Discussion Section
It’s not enough to use figures and tables in your results section to convince your readers about the importance of your findings. You need to support your results section by providing more explanation in the discussion section about what you found.
In the discussion section, based on your findings, you defend the answers to your research questions and create arguments to support your conclusions.
Below is a list of questions to guide you when organizing the structure of your discussion section ( Viera et al ., 2018 ):
- What experiments did you conduct and what were the results?
- What do the results mean?
- What were the important results from your study?
- How did the results answer your research questions?
- Did your results support your hypothesis or reject your hypothesis?
- What are the variables or factors that might affect your results?
- What were the strengths and limitations of your study?
- What other published works support your findings?
- What other published works contradict your findings?
- What possible factors might cause your findings different from other findings?
- What is the significance of your research?
- What are new research questions to explore based on your findings?
Organizing the Discussion Section
The structure of the discussion section may be different from one paper to another, but it commonly has a beginning, middle-, and end- to the section.

One way to organize the structure of the discussion section is by dividing it into three parts (Ghasemi, 2019):
- The beginning: The first sentence of the first paragraph should state the importance and the new findings of your research. The first paragraph may also include answers to your research questions mentioned in your introduction section.
- The middle: The middle should contain the interpretations of the results to defend your answers, the strength of the study, the limitations of the study, and an update literature review that validates your findings.
- The end: The end concludes the study and the significance of your research.
Another possible way to organize the discussion section was proposed by Michael Docherty in British Medical Journal: is by using this structure ( Docherty, 1999 ):
- Discussion of important findings
- Comparison of your results with other published works
- Include the strengths and limitations of the study
- Conclusion and possible implications of your study, including the significance of your study – address why and how is it meaningful
- Future research questions based on your findings
Finally, a last option is structuring your discussion this way (Hofmann, 2013, pg. 104):
- First Paragraph: Provide an interpretation based on your key findings. Then support your interpretation with evidence.
- Secondary results
- Limitations
- Unexpected findings
- Comparisons to previous publications
- Last Paragraph: The last paragraph should provide a summarization (conclusion) along with detailing the significance, implications and potential next steps.
Remember, at the heart of the discussion section is presenting an interpretation of your major findings.
Tips to Write the Discussion Section
- Highlight the significance of your findings
- Mention how the study will fill a gap in knowledge.
- Indicate the implication of your research.
- Avoid generalizing, misinterpreting your results, drawing a conclusion with no supportive findings from your results.
Aggarwal, R., & Sahni, P. (2018). The Results Section. In Reporting and Publishing Research in the Biomedical Sciences (pp. 21-38): Springer.
Bahadoran, Z., Mirmiran, P., Zadeh-Vakili, A., Hosseinpanah, F., & Ghasemi, A. (2019). The principles of biomedical scientific writing: Results. International journal of endocrinology and metabolism, 17(2).
Bordage, G. (2001). Reasons reviewers reject and accept manuscripts: the strengths and weaknesses in medical education reports. Academic medicine, 76(9), 889-896.
Cals, J. W., & Kotz, D. (2013). Effective writing and publishing scientific papers, part VI: discussion. Journal of clinical epidemiology, 66(10), 1064.
Docherty, M., & Smith, R. (1999). The case for structuring the discussion of scientific papers: Much the same as that for structuring abstracts. In: British Medical Journal Publishing Group.
Faber, J. (2017). Writing scientific manuscripts: most common mistakes. Dental press journal of orthodontics, 22(5), 113-117.
Fletcher, R. H., & Fletcher, S. W. (2018). The discussion section. In Reporting and Publishing Research in the Biomedical Sciences (pp. 39-48): Springer.
Ghasemi, A., Bahadoran, Z., Mirmiran, P., Hosseinpanah, F., Shiva, N., & Zadeh-Vakili, A. (2019). The Principles of Biomedical Scientific Writing: Discussion. International journal of endocrinology and metabolism, 17(3).
Hofmann, A. H. (2013). Writing in the biological sciences: a comprehensive resource for scientific communication . New York: Oxford University Press.
Kotz, D., & Cals, J. W. (2013). Effective writing and publishing scientific papers, part V: results. Journal of clinical epidemiology, 66(9), 945.
Mack, C. (2014). How to Write a Good Scientific Paper: Structure and Organization. Journal of Micro/ Nanolithography, MEMS, and MOEMS, 13. doi:10.1117/1.JMM.13.4.040101
Moore, A. (2016). What's in a Discussion section? Exploiting 2‐dimensionality in the online world…. Bioessays, 38(12), 1185-1185.
Peat, J., Elliott, E., Baur, L., & Keena, V. (2013). Scientific writing: easy when you know how: John Wiley & Sons.
Sandercock, P. M. L. (2012). How to write and publish a scientific article. Canadian Society of Forensic Science Journal, 45(1), 1-5.
Teo, E. K. (2016). Effective Medical Writing: The Write Way to Get Published. Singapore Medical Journal, 57(9), 523-523. doi:10.11622/smedj.2016156
Van Way III, C. W. (2007). Writing a scientific paper. Nutrition in Clinical Practice, 22(6), 636-640.
Vieira, R. F., Lima, R. C. d., & Mizubuti, E. S. G. (2019). How to write the discussion section of a scientific article. Acta Scientiarum. Agronomy, 41.
Related Articles

A quality research paper has both the qualities of in-depth research and good writing (Bordage, 200...

How to Survive and Complete a Thesis or a Dissertation
Writing a thesis or a dissertation can be a challenging process for many graduate students. There ar...

12 Ways to Dramatically Improve your Research Manuscript Title and Abstract
The first thing a person doing literary research will see is a research publication title. After tha...

15 Laboratory Notebook Tips to Help with your Research Manuscript
Your lab notebook is a foundation to your research manuscript. It serves almost as a rudimentary dra...
Join our list to receive promos and articles.
- Competent Cells
- Lab Startup
- Z')" data-type="collection" title="Products A->Z" target="_self" href="/collection/products-a-to-z">Products A->Z
- GoldBio Resources
- GoldBio Sales Team
- GoldBio Distributors
- Duchefa Direct
- Sign up for Promos
- Terms & Conditions
- ISO Certification
- Agarose Resins
- Antibiotics & Selection
- Biochemical Reagents
- Bioluminescence
- Buffers & Reagents
- Cell Culture
- Cloning & Induction
- Competent Cells and Transformation
- Detergents & Membrane Agents
- DNA Amplification
- Enzymes, Inhibitors & Substrates
- Growth Factors and Cytokines
- Lab Tools & Accessories
- Plant Research and Reagents
- Protein Research & Analysis
- Protein Expression & Purification
- Reducing Agents
- Bipolar Disorder
- Therapy Center
- When To See a Therapist
- Types of Therapy
- Best Online Therapy
- Best Couples Therapy
- Best Family Therapy
- Managing Stress
- Sleep and Dreaming
- Understanding Emotions
- Self-Improvement
- Healthy Relationships
- Student Resources
- Personality Types
- Guided Meditations
- Verywell Mind Insights
- 2024 Verywell Mind 25
- Mental Health in the Classroom
- Editorial Process
- Meet Our Review Board
- Crisis Support
How to Write an APA Results Section
Kendra Cherry, MS, is a psychosocial rehabilitation specialist, psychology educator, and author of the "Everything Psychology Book."
:max_bytes(150000):strip_icc():format(webp)/IMG_9791-89504ab694d54b66bbd72cb84ffb860e.jpg "how to write up research results")
Emily is a board-certified science editor who has worked with top digital publishing brands like Voices for Biodiversity, Study.com, GoodTherapy, Vox, and Verywell.
:max_bytes(150000):strip_icc():format(webp)/Emily-Swaim-1000-0f3197de18f74329aeffb690a177160c.jpg "how to write up research results")
Verywell / Nusha Ashjaee
What to Include in an APA Results Section
- Justify Claims
- Summarize Results
Report All Relevant Results
- Report Statistical Findings
Include Tables and Figures
What not to include in an apa results section.
Psychology papers generally follow a specific structure. One important section of a paper is known as the results section. An APA results section of a psychology paper summarizes the data that was collected and the statistical analyses that were performed. The goal of this section is to report the results of your study or experiment without any type of subjective interpretation.
At a Glance
The results section is a vital part of an APA paper that summarizes a study's findings and statistical analysis. This section often includes descriptive text, tables, and figures to help summarize the findings.
The focus is purely on summarizing and presenting the findings and should not include any interpretation, since you'll cover that in the subsequent discussion section.
This article covers how to write an APA results section, including what to include and what to avoid.
The results section is the third section of a psychology paper. It will appear after the introduction and methods sections and before the discussion section.
The results section should include:
- A summary of the research findings.
- Information about participant flow, recruitment , retention, and attrition. If some participants started the study and later left or failed to complete the study, then this should be described.
- Information about any reasons why some data might have been excluded from the study.
- Statistical information including samples sizes and statistical tests that were used. It should report standard deviations, p-values, and other measures of interest.
Results Should Justify Your Claims
Report data in order to sufficiently justify your conclusions. Since you'll be talking about your own interpretation of the results in the discussion section, you need to be sure that the information reported in the results section justifies your claims.
When you start writing your discussion section, you can then look back on your results to ensure that all the data you need are there to fully support your conclusions. Be sure not to make claims in your discussion section that are not supported by the findings described in your results section.
Summarize Your Results
Remember, you are summarizing the results of your psychological study, not reporting them in full detail. The results section should be a relatively brief overview of your findings, not a complete presentation of every single number and calculation.
If you choose, you can create a supplemental online archive where other researchers can access the raw data if they choose.
How long should a results section be?
The length of your results section will vary depending on the nature of your paper and the complexity of your research. In most cases, this will be the shortest section of your paper.
Just as the results section of your psychology paper should sufficiently justify your claims, it should also provide an accurate look at what you found in your study. Be sure to mention all relevant information.
Don't omit findings simply because they failed to support your predictions.
Your hypothesis may have expected more statistically significant results or your study didn't support your hypothesis , but that doesn't mean that the conclusions you reach are not useful. Provide data about what you found in your results section, then save your interpretation for what the results might mean in the discussion section.
While your study might not have supported your original predictions, your finding can provide important inspiration for future explorations into a topic.
How is the results section different from the discussion section?
The results section provides the results of your study or experiment . The goal of the section is to report what happened and the statistical analyses you performed. The discussion section is where you will examine what these results mean and whether they support or fail to support your hypothesis.
Report Your Statistical Findings
Always assume that your readers have a solid understanding of statistical concepts. There's no need to explain what a t-test is or how a one-way ANOVA works. Your responsibility is to report the results of your study, not to teach your readers how to analyze or interpret statistics.
Include Effect Sizes
The Publication Manual of the American Psychological Association recommends including effect sizes in your results section so that readers can appreciate the importance of your study's findings.
Your results section should include both text and illustrations. Presenting data in this way makes it easier for readers to quickly look at your results.
Structure your results section around tables or figures that summarize the results of your statistical analysis. In many cases, the easiest way to accomplish this is to first create your tables and figures and then organize them in a logical way. Next, write the summary text to support your illustrative materials.
Only include tables and figures if you are going to talk about them in the body text of your results section.
In addition to knowing what you should include in the results section of your psychology paper, it's also important to be aware of things that you should avoid putting in this section:
Cause-and-Effect Conclusions
Don't draw cause-effect conclusions. Avoid making any claims suggesting that your result "proves" that something is true.
Interpretations
Present the data without editorializing it. Save your comments and interpretations for the discussion section of your paper.
Statistics Without Context
Don't include statistics without narration. The results section should not be a numbers dump. Instead, you should sequentially narrate what these numbers mean.
Don't include the raw data in the results section. The results section should be a concise presentation of the results. If there is raw data that would be useful, include it in the appendix .
Don't only rely on descriptive text. Use tables and figures to present these findings when appropriate. This makes the results section easier to read and can convey a great deal of information quickly.
Repeated Data
Don't present the same data twice in your illustrative materials. If you have already presented some data in a table, don't present it again in a figure. If you have presented data in a figure, don't present it again in a table.
All of Your Findings
Don't feel like you have to include everything. If data is irrelevant to the research question, don't include it in the results section.
But Don't Skip Relevant Data
Don't leave out results because they don't support your claims. Even if your data does not support your hypothesis, including it in your findings is essential if it's relevant.
More Tips for Writing a Results Section
If you are struggling, there are a few things to remember that might help:
- Use the past tense . The results section should be written in the past tense.
- Be concise and objective . You will have the opportunity to give your own interpretations of the results in the discussion section.
- Use APA format . As you are writing your results section, keep a style guide on hand. The Publication Manual of the American Psychological Association is the official source for APA style .
- Visit your library . Read some journal articles that are on your topic. Pay attention to how the authors present the results of their research.
- Get a second opinion . If possible, take your paper to your school's writing lab for additional assistance.
What This Means For You
Remember, the results section of your paper is all about providing the data from your study. This section is often the shortest part of your paper, and in most cases, the most clinical.
Be sure not to include any subjective interpretation of the results. Simply relay the data in the most objective and straightforward way possible. You can then provide your own analysis of what these results mean in the discussion section of your paper.
Bavdekar SB, Chandak S. Results: Unraveling the findings . J Assoc Physicians India . 2015 Sep;63(9):44-6. PMID:27608866.
Snyder N, Foltz C, Lendner M, Vaccaro AR. How to write an effective results section . Clin Spine Surg . 2019;32(7):295-296. doi:10.1097/BSD.0000000000000845
American Psychological Association. Publication Manual of the American Psychological Association (7th ed.). Washington DC: The American Psychological Association; 2019.
Purdue Online Writing Lab. APA sample paper: Experimental psychology .
Berkeley University. Reviewing test results .
Tuncel A, Atan A. How to clearly articulate results and construct tables and figures in a scientific paper ? Turk J Urol . 2013;39(Suppl 1):16-19. doi:10.5152/tud.2013.048
By Kendra Cherry, MSEd Kendra Cherry, MS, is a psychosocial rehabilitation specialist, psychology educator, and author of the "Everything Psychology Book."

An official website of the United States government
The .gov means it’s official. Federal government websites often end in .gov or .mil. Before sharing sensitive information, make sure you’re on a federal government site.
The site is secure. The https:// ensures that you are connecting to the official website and that any information you provide is encrypted and transmitted securely.
- Publications
- Account settings
- My Bibliography
- Collections
- Citation manager
Save citation to file
Email citation, add to collections.
- Create a new collection
- Add to an existing collection
Add to My Bibliography
Your saved search, create a file for external citation management software, your rss feed.
- Search in PubMed
- Search in NLM Catalog
- Add to Search
How to Write an Effective Results Section
Affiliation.
- 1 Rothman Orthopaedics Institute, Philadelphia, PA.
- PMID: 31145152
- DOI: 10.1097/BSD.0000000000000845
Developing a well-written research paper is an important step in completing a scientific study. This paper is where the principle investigator and co-authors report the purpose, methods, findings, and conclusions of the study. A key element of writing a research paper is to clearly and objectively report the study's findings in the Results section. The Results section is where the authors inform the readers about the findings from the statistical analysis of the data collected to operationalize the study hypothesis, optimally adding novel information to the collective knowledge on the subject matter. By utilizing clear, concise, and well-organized writing techniques and visual aids in the reporting of the data, the author is able to construct a case for the research question at hand even without interpreting the data.
PubMed Disclaimer
Similar articles
- How to Write Effective Discussion and Conclusion Sections. Makar G, Foltz C, Lendner M, Vaccaro AR. Makar G, et al. Clin Spine Surg. 2018 Oct;31(8):345-346. doi: 10.1097/BSD.0000000000000687. Clin Spine Surg. 2018. PMID: 29979216
- How to write an original radiological research manuscript. Bannas P, Reeder SB. Bannas P, et al. Eur Radiol. 2017 Nov;27(11):4455-4460. doi: 10.1007/s00330-017-4879-8. Epub 2017 Jun 14. Eur Radiol. 2017. PMID: 28616726 Free PMC article. Review.
- Rules to be adopted for publishing a scientific paper. Picardi N. Picardi N. Ann Ital Chir. 2016;87:1-3. Ann Ital Chir. 2016. PMID: 28474609
- The rites of writing papers: steps to successful publishing for psychiatrists. Brakoulias V, Macfarlane MD, Looi JC. Brakoulias V, et al. Australas Psychiatry. 2015 Feb;23(1):32-6. doi: 10.1177/1039856214560180. Epub 2014 Dec 2. Australas Psychiatry. 2015. PMID: 25469001
- How to write a research paper. Alexandrov AV. Alexandrov AV. Cerebrovasc Dis. 2004;18(2):135-8. doi: 10.1159/000079266. Epub 2004 Jun 23. Cerebrovasc Dis. 2004. PMID: 15218279 Review.
- Essential Guide to Manuscript Writing for Academic Dummies: An Editor's Perspective. Aga SS, Nissar S. Aga SS, et al. Biochem Res Int. 2022 Sep 1;2022:1492058. doi: 10.1155/2022/1492058. eCollection 2022. Biochem Res Int. 2022. PMID: 36092536 Free PMC article. Review.
- Search in MeSH
LinkOut - more resources
Full text sources.
- Ovid Technologies, Inc.
- Wolters Kluwer

- Citation Manager
NCBI Literature Resources
MeSH PMC Bookshelf Disclaimer
The PubMed wordmark and PubMed logo are registered trademarks of the U.S. Department of Health and Human Services (HHS). Unauthorized use of these marks is strictly prohibited.
How to Write a Results Section: Tips, Examples, and Guide

- Icon Calendar 18 May 2024
- Icon Page 5286 words
- Icon Clock 24 min read
When students organize their scholarly works, they need valid guidelines on how to write a results section of a research paper. In this case, the article offers critical insights, including all the parts of a research paper and how a results section differs from the others, the information that should be included, and how to organize it correctly. The guideline also teaches students the differences between qualitative and quantitative research results sections, including samples and templates indicating how to present the findings. In turn, it provides 8 dos and 8 don’ts of writing a results section and 20 tips that students should follow.
How to Write an Outstanding Results Section & Examples
Students should read scholarly texts habitually to equip themselves with knowledge of the requirements of high-standard papers. While these requirements are not similar for different types of papers , they have similar unique features. For example, it is standard for writers of various types of essays to create a clear thesis statement that provides direction on the content and a well-organized essay outline that follows a correct essay structure and allows one to organize ideas logically. In turn, the guideline on how to write a results section provides insights into the details students must address when writing this part, including all the other components of a research paper, the information essential to include, and its organization. Moreover, readers should view this article as an educational tool that empowers them to start writing a high-standard results section of a scientific research paper.

6 Main Sections of a Research Paper and Its Structure
A research paper is unique because it has sections with varying details about a specific study topic. For example, these sections include an introduction, literature review, research methodology, results, discussion, and conclusion. In this respect, a research paper is a comprehensive document that requires students’ total focus and dedication. Writers should use each section to provide information for readers to understand the essence and significance of research papers. Therefore, to write a quality results section, one must know how it differs from other scientific works and the information it must provide for readers. In turn, students should focus on the uniqueness of each section because it underscores its relevance in a research paper.
1️⃣ Introduction
The introduction is the first section of a research paper. As the title suggests, it aims to introduce the reader to the study problem under analysis. In this respect, there are critical details writers must provide in this section, including the research problem, the background of the investigation, the significance of the study, and the research question or hypothesis. Typically, research paper topics indicate study problems that students may use for writing their scholarly works. In turn, the background information addresses existing research and some gaps that writers intend to explore using bridge sentences in their current work. Moreover, the significance of the study must explain why the current scientific work is essential, and research question(s) or hypothesis(es) address what writers intend to prove through their work, either answering questions or validating null and alternative hypotheses. Thus, the introduction section of a research paper gives readers basic information about the writer’s scientific work. In turn, before the introduction, students can include an abstract or executive summary part, which means the overall summary of a research paper, but it is optional.
2️⃣ Review of the Existing Literature
A literature review is the second section of a research paper that examines existing evidence relating to a particular research paper problem. Depending on the topic, this section is robust because one must demonstrate an in-depth understanding of the research issue under review. More importantly, students must convince readers that they have investigated the evidence and found a gap by reviewing credible sources that justify their studies. The most significant detail that students should focus on when writing this section is to examine numerous reliable sources, including books, peer-reviewed academic articles, and reports by government agencies, to cite information and statistics relevant to the scientific problem or theoretical framework. Such information is essential in revealing the knowledge gap that justifies the current research work.
3️⃣ Research Methodology
Research methodology is the third section of a research paper and focuses on the methods that students use to conduct their research work. For example, scholars should understand that research work takes many forms or designs that determine the approach to take to execute their task. The two main designs are qualitative and quantitative studies, while research methods include descriptive, experimental, case study, and observation. Therefore, when writing this section, students must know they intend to give readers a roadmap for conducting their scientific work. Essential details include the study participants, how to identify them and their total number, how to collect data, and the data analysis procedure(s). The research design is the most important detail to consider because it determines all the other components of the research methodology section. Besides, this section tends to be longer than the introduction.
4️⃣ Results Section
A results section is the fourth part of a research paper and is where students outline the findings of their scientific work. Typically, this section is shorter than the previous one because its purpose is to provide readers with the outcomes of a research paper. As the title suggests, the details in this section should point to the findings only. Therefore, the issue that makes this results section unique is that writers do not provide details that contextualize their work but only those that indicate its outcomes. The information in this section underscores the purpose of the research work, including its ultimate objective.
5️⃣ Discussion
The fifth section of a research paper is a discussion part, where authors link the results of the study with the literature review. Ideally, the information in the section acts as a summary of a research paper that requires one to confirm that the findings are relevant to addressing the knowledge gap that writers expressed in the introduction and literature review. Typically, people show this linkage by indicating whether the results have answered the study question(s) or validated the hypothesis(es). Other essential details are the limitations of a research paper.
6️⃣ Conclusion
A conclusion is the last section of a research paper, and it reiterates the research question, how the findings impact the practice, such as nursing or psychology, and the need for conducting further studies to address unresolved questions. This last section summarizes a research paper and affects the reader’s perspective on the study problem.
Join our satisfied customers who have received perfect papers from Wr1ter Team.
Providing the Right Information When Writing a Results Section
A results section is about the findings of the research work only. As such, students should not address anything that does not relate to the study question(s) or hypothesis(es). Typically, the details in this section include data that writers present in tables, charts, graphs, or other visual figures as part of the text or separately on pages at the end of the document, such as acknowledgments or appendices. Another detail is a contextual analysis of the data to give readers a better understanding of how it relates to the research question(s) or hypothesis(es), expanding on the meaning of the information presented. Further essential details in the section are data corresponding to the research question(s) or hypothesis(es) and secondary findings, including secondary outcomes and subgroup analyses. All these details make a results section unique because it is where readers need to understand the essence of the scientific work.
🔸 How to Organize a Results Section
While the results section’s primary purpose is to communicate the findings of a research paper, students should know that they cannot copy-paste raw information without a good explanation. For example, the information in a results section must have a pattern demonstrating a logical organization of the study findings. The best way to organize such findings is to use headings following a logical order of the study questions or hypotheses and integrate data through charts, graphs, visuals, or tables thematically. In this respect, when writing a results section, writers must refer to the introduction to ensure the information aligns with what they said. An important detail to note is that the graphical presentation of the results’ data is not sufficient. However, students must mention the data through statements that allow readers to understand how the results answer the research question(s) or validate or invalidate hypothesis (es).
🔸 How to Organize Figures, Charts, or Other Visuals
A logical presentation of data requires students to organize all data figures by numbering them and citing the number in the paragraph to link the findings to a research question or hypothesis. The numbering format should follow the order in which the writer mentions the data in the text. One should also explain the methodology that led to each figure. For example, students should capture the following details:
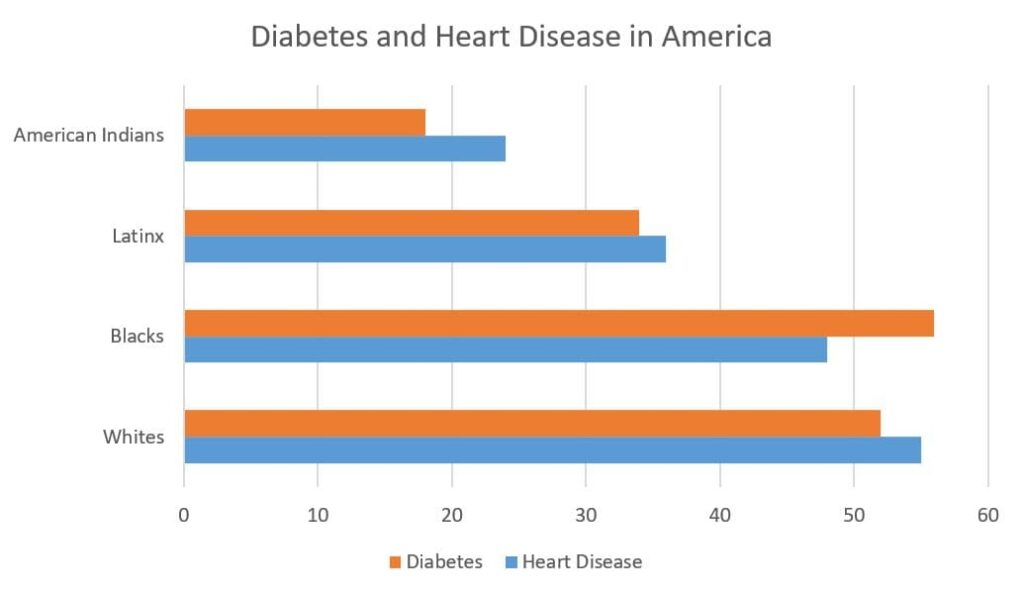
Figure 1: Racial/ethnic representation of health problems in the United States.
- Integrate the data into the text by mentioning the percentage of Whites, Blacks, Latinx, and American Indians with diabetes and heart disease.
- Mention Figure 1 but not necessarily the title. For example, one can write: “Figure 1 shows the proportion of Whites and Blacks with heart disease is 55 percent and 48 percent, respectively.” With that statement, readers can look at the chart and read its title to make sense of the sentence.
- Depending on the type of figure, writers can indicate the figure legend at the top. In the above example, it reads, “Diabetes and Heart Disease in America.”
- At the bottom of the figure (footnote), one should indicate the figure number followed by a caption that briefly describes the figure. In the above example, the caption reads, “Racial/ethnic representation of health problems in the United States.”
- Writers must use labels to identify specific elements or features in the graph. In the above example, the horizontal axis uses percentages as labels indicating the proportion of Whites, Blacks, Latinx, and American Indians with diabetes and heart disease.
🔸 How to Organize Tables
Like figures, tables capture data reflecting a results section of a research paper. However, they differ from charts in how they reflect the data. For example, their unique features include columns and rows, each with a subheading. The following example shows how students should use tables in a results section:
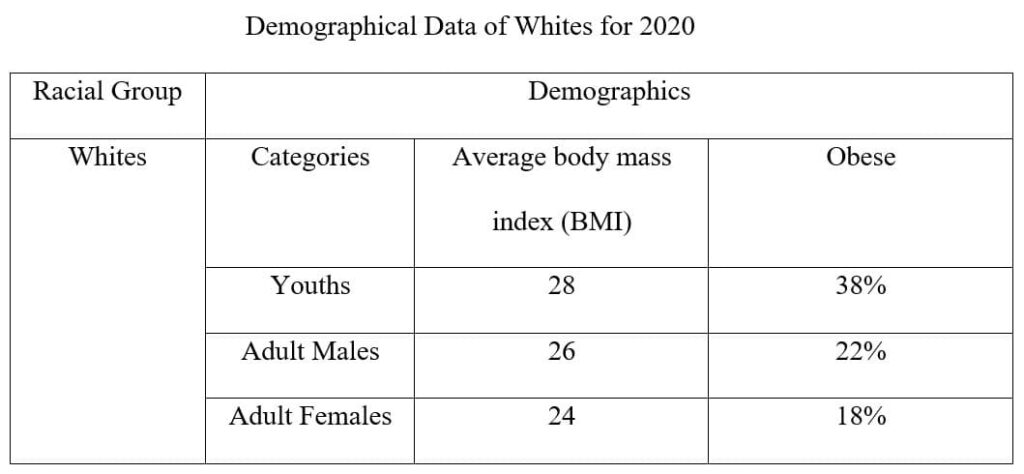
Table 1. Demographics of Whites in the United States for 2020 showing how obesity affects this population in the country. Young individuals are the most affected, with 38 percent presenting as obese, followed by adult females at 22 percent and then adult males at 18 percent. However, on average, the BMI index for all groups is below the obese level of 30.
- Writers should identify the data in the table above by mentioning “Table 1” in the text about the demographics of Whites for 2020.
- Typically, most research papers use a footnote rather than a table title. While a title is necessary to enhance readers’ understanding, footnotes are more detailed because they offer some analysis. In the above example, the footnote that follows the caption below the table analyzes the data for the reader’s benefit.
- Typically, the row headings capture groups, and column headings indicate demographical data. In the example above, the row heading captures Whites as a racial group, while the column heading indicates the group’s demographics. Writers should understand that each row and each column should reflect one group and one demographical data, respectively.
- Sometimes, writers may have row subheadings to indicate group categories and column subheadings to capture variables. In the above example, the row subheadings are youths, adult males, and adult females as the group categories, while the column subheadings indicate average BMI and obesity as demographic categories.
- Tables provide self-explanatory data to readers, and footnotes only attempt to make sense of it superficially. By looking at the table, people should comprehend the results without reading all the text.
Therefore, students should use figures and tables as focal points to communicate a clear and informative narrative about the findings of a research paper. In this respect, writers should repeat every detail in the text, although they must reference all data in a results section or other body paragraphs by pointing readers to “Table 1.”
How to Write a Good Results Section With 8 Dos and 8 Don’ts
When writing a great results section, students should know what to talk about or do and what not to talk about or not do. The things to do to demonstrate a high-standard results section and those not to do can affect the section’s quality. From this perspective, students must habitually read research papers to familiarize themselves with 8 dos and 8 don’ts of writing a results section.
What One Should Do When Writing a Results Section: 8 Dos
- Write in the past tense only . All study findings are what the author has established after conducting the actual study. The language that reflects this aspect is past tense. Common terminologies include ‘found,’ ‘established,’ and ‘confirmed.’ Using this language tells readers that the research has already happened and the outcomes are clear, as the text indicates through visuals, charts, graphs, figures, and tables.
- Write concisely. Findings require interpretation from statistical data to statistical analyses. Typically, this exercise involves complex language that may need to be clarified for readers. As such, students should write a results section clearly and concisely to avoid sending the wrong message to other scholars. For example, one must be clear about which finding relates to which study question or hypothesis.
- Referencing the study question(s) or hypothesis(es). A results section aims to answer the research question(s) or validate or invalidate the hypothesis(es). As such, students must refer to them (as applicable) when writing a results section. As stated, the best approach is to refer to them according to the order they appear in the introduction section for logical consistency.
- Begin with broad results. Typically, the findings of a research paper vary in how they answer the study question(s) or validate or invalidate the hypothesis(es). Some results are broad, requiring some comprehensive analysis, and others narrow, covering a brief mention. Students should begin with the general results because they affect the scientific question(s) or hypothesis(es) more than the narrow findings. However, they should mention the narrow findings later in the text because they are precise to the study question or hypothesis.
- Write the most critical findings from figures or tables. The purpose of figures and tables is to provide a broad picture of the results. However, only some details capture the most critical finding. For example, in the table above, the most critical finding is the rate of obesity in the White community, specifically youths, adult males, and adult females. When referring to Table 1, a student should mention the percentages of obesity prevalence in these groups as the most critical finding despite the chart indicating other details, such as the BMI, which are central to this crucial result.
- Avoid background information and explanation of findings. Students should avoid explaining the results or providing any background information. At this part of a research paper, readers already understand the background of the study because they have read the introduction and literature review sections. Consequently, they expect an in-depth explanation of the results in the later discussion section.
- Do not capture raw data or intermediate calculations. The findings in a results section should make sense to all readers. As such, students should not provide raw data or indicate its intermediate calculations. The data analysis section that falls in the research methodology offers the opportunity for these exercises. Therefore, students should understand that a results section should provide an answer to readers about the study question(s) or hypothesis(es), not leaving them with the task of analyzing the data to make the connection.
- Never ignore negative results. Authors of research papers probably have a biased interpretation of the results because they already have a preferred outcome. In such cases, most students may be tempted to ignore negative results if they do not conform to their expectations or preferences. However, they must understand that a results section should reflect the findings of a research paper regardless of whether they are positive or negative in their eyes. This capture of the results makes any research paper scholarly and valid.
What to Avoid: 8 Don’ts
- Do not capture all data generated in a research paper. Writers need to understand that the purpose of writing a results section is to answer the research question(s) or validate or invalidate the hypothesis(es). Doing so does not require all the data, but what is relevant for this task. Moreover, research papers have limited length, and one cannot have room in a results section to indicate all the data from the study experiment.
- Do not use text to describe everything. The purpose of charts, figures, visuals, and tables is to capture and present data in a short summary. As such, they help writers to avoid explaining every data and related detail because it may be complex and confusing to readers. Therefore, one should only describe or explain some things but use figures, visuals, and tables to present broad data.
- Do not repeat the data in figures and tables. When referring to figures, visuals, and tables in the text, students should avoid repeating every piece of data but instead interpret it for readers. What is important is the most critical data because it provides a clear and concise message about a research question or hypothesis. Therefore, students should interpret the data instead of repeating the same information as it is in the chart, visual, figure, or table. In the example of the table above, one should not repeat all the information but summarize it by stating the group most affected by obesity and how.
- Do not jump around the data to discuss the findings. The logical presentation of data requires students to provide information that answers the research questions or hypotheses as they appear in the introduction. As such, one should avoid mentioning data relevant to one question when answering a different question. The same case should apply to hypotheses.
- Do not give long explanations. A results section should be short but clear and concise. In this respect, students should refrain from long explanations because they reduce the space for the most essential information: critical findings. The best approach to avoid long descriptions is to use figures, visuals, charts, and tables.
- Do not use meaningless numbers. While a results section aims to show data mostly in numbers for a quantitative study, students should avoid using every number they have if it is not meaningful to a research question or hypothesis. Therefore, after data analysis, one should decide on the most relevant and meaningful numbers to include in a results section.
- Do not cite other research works. Since the purpose of a results section is to provide the findings of a research paper, one should avoid irrelevant details, including comparing the results to those of other research works. Students must understand that the discussion section gives them room to do so.
- Do not use the results of other authors. Any academic work is designed for a specific purpose. In this case, students must do their own research papers and present unique findings section, including negative or positive ones. The findings of other authors can be used only for a comparison of the results.
Examples of Results Sections for Qualitative and Quantitative Research Studies
The two primary research paper designs that scholars use for their scientific works are qualitative and quantitative studies. Each design has a unique way of capturing the findings of a research paper. The two examples below show how students should write a results section in qualitative and quantitative research papers. However, students must note the language and details, such as statistical data.
Example of a Qualitative Results Section
[Introductory context] A total of 98 respondents from different countries gave essential data by answering the survey questionnaire. The representation was as follows: 30 respondents were from the U.S. (30.6% of the total), 26 from China (26.5%), 22 from Russia (22.4%), and 20 from the United Kingdom (20.4%). […] [Important finding] According to the results, the most important cultural identifiers are language (w=0.3402), followed by ethnicity (w=0.2930) and religion (w=0.2279). Most respondents viewed gender as the most insignificant compared to the other three (w=0,1388) (Table 1). […] [Interesting Finding] An interesting finding is that the U.S. and the U.K. respondents considered sexual orientation as a determinant of a country’s cultural vibrancy, while those from China and Russia viewed it as an indicator of negative liberalism. All the respondents had a uniform consistency ratio (C.R.) of less than 0.08 (8%). [Another important finding] According to all the respondents, the three critical drivers of cultural vibrancy are technology (mean value of 4.88), education (4.60), contact with other cultures (4.40), and the media (4.30). Conversely, the factors that influence cultural assimilation the least, according to all the respondents, are cultural artifacts (2.88) and friendships (2.66) (Figure 1). […] [Summary of Key Findings] The findings indicate differences of opinion regarding some cultural topics and convergence of thought in others between countries from the respondents’ perspective. On differences, respondents from the U.S. and U.K. hold more liberal views than their Chinese and Russian counterparts. The point of convergence for all the respondents is the belief that culture is the most instrumental factor for interrogating the attitudes and behaviors of people .
[Introductory Context] The student data system for 2010 through 2020 was the source of the demographic data for the sample. The descriptive statistics include age, gender, grades, and course selection. Table 1 describes the cross-tabulation frequencies of the study sample. The mean age was 28.42 years, with a standard deviation of 8.22 years. The age range of the sample was from 18 to 50 years. [Relevant Finding] Overall, more students selected online than physical courses, with a uniform enrollment rate in online courses in both males and females; however, the proportion of males was high (62.7%) for online instruction than that of females (58.8%) as shown in Figures 1 and 2. […] [Significant Finding (including a significant test result)] A statistically significant difference in grades is reported between students enrolled in online classes and their counterparts in the traditional classroom setting. The mean and standard deviation for grades calculated by delivery type showed no significant difference between online and physical instruction. In contrast, those calculated by the instructor showed no significant difference in the mean grade. […] [Reference to Visual Data] Table 6 shows the impact of the delivery method and the instructor on students’ grades. […] The delivery method did not influence significant grade differences (F = 0.078, p = 0.780, df = 1, 811). The same case was reported for the instructor (F = 0.002, p = .967, df = 1, 811). The two factors had no significant interaction (F = 0.449, p = 0.503, df = 1, 811). [Relevant Finding] There is a statistically significant difference in student course retention between those taking online courses and their counterparts in physical classrooms (Supplementary Appendix Figure 1). Data were included for testing if a final grade was reported for a participant (Supplementary Appendix Figure 2). [Context to a Research Question or Hypothesis] The analysis of the contingency data was essential in confirming the hypothesis. Data organization indicates the row variable as course selection (online or physical classroom) and the column variable as retention in the course. [Explanation of a study Test] The chi-square testing (X2 = 2.524, p = .112, df = 1, 884) indicated no statistically significant difference between retention in online and physical classroom courses. [Significant Findings] The study includes a statistically significant difference in student retention between those who begin the program online and those who begin in the physical classroom. […] [Summary of Key Findings] Results from testing of H1 showed no significant difference between course grades for students enrolled in online courses and their counterparts in physical classroom courses. Chi-square testing of H2 indicated no significant difference in course retention between students taking online courses and those taking courses in the physical classroom environment. Chi-square testing of H3 indicated no significant difference in program retention between students who began the course online and those who began it in the physical classroom.
Enhance your academic performance with our top-notch, plagiarism-free papers.
Templates for Qualitative and Quantitative Results Sections
I. qualitative results template:.
- [Introductory Context]
- [Finding 1 – Important]
- [Finding 2 – Interesting]
- [Another Important Finding 3 that refers to a chart, figure, visual, or table]
- [Summary of key findings]
II. Quantitative Results Template:
- [Finding 1 – Relevant]
- [Finding 2 – Significant – with reference to a test result]
- [Reference to a chart, figure, visual, or table]
- [Finding 3 – Relevant]
- [Context to a Research Question or Hypothesis]
- [Explanation of a Study Test]
- [Finding 3 – Significant]
Looking at the two templates, it is evident that crucial details appear in all but some only in quantitative research. In both templates, students should introduce the section by stating some facts, such as the study sample, and enumerate the results, using charts, figures, visuals, or tables as necessary. However, only in a quantitative study, one should mention tests and their outcomes.
Comparing and Contrasting Qualitative and Quantitative Results Sections
There are areas of similarity and difference between the results sections of qualitative and quantitative research studies. The main similarities are that both results sections capture statistical data or reports and do not interpret the meanings of data with long explanations. However, there are many differences in presenting the content. Firstly, a qualitative results section emphasizes non-numerical, descriptive data, focusing on themes and ideas. In contrast, a quantitative results section highlights measurable (or quantifiable) numerical data relevant to interpreting trends, making predictions, running experiments, or testing hypotheses. Another difference is that a qualitative results section adopts descriptive and interpretive approaches to make sense of the collected data. On the other hand, a quantitative results section adopts numbers-based strategies, including statistics, calculations, and data measurements, to make sense of the collected data.
Research Questions and Hypotheses
When writing a results section, students must focus on the research question(s) or hypothesis(es) they stated in the introduction because they underscore the paper’s importance or purpose. Regarding research questions, the data presented in a results section must refer to the questions as they appear in the introduction, giving outcomes that reflect answers to these queries. Concerning hypotheses, students should ensure that a results section confirms or rejects them. In other words, a good results section should help readers to understand the scientific problem by answering the study question(s) or validating or invalidating the hypothesis(es). Therefore, when writing a results section, students should know that they are answering a specific research question or confirming a study hypothesis. This determination is crucial because it must reflect proper language, concepts, and terms used in the text.
20 Tips for Writing a Well-Organized Results Section
Based on the preceding sections, writing a high-standard results section of a research paper is a technical undertaking that requires students to grasp helpful insight. Some of the useful tips include always using simple and clear language, avoiding irrelevant expressions, discussing the findings objectively without overinterpretation, using sub-sections if there are more research questions or hypotheses, including negative results even if they do not support the study hypothesis, providing visuals charts, figures, visuals, and tables to document the results, and mentioning the tests and their outcomes for a quantitative study.
10 things to do when writing a results section include:
- briefly and precisely summarizing the results at the beginning of the section;
- using visual illustrations, like charts, figures, and tables;
- arranging the results logically;
- linking the data to the research question(s) or hypothesis(es);
- following clear, simple, and concise language;
- being objective;
- avoiding long explanations;
- including statistical analyses to make the data sensible to readers;
- providing the correct information for the right study question or hypothesis;
- presenting paragraphs that respond to different scientific questions or hypotheses.
10 things not to do when writing a results section include:
- using raw data;
- duplicating similar information by repeating the data in the visual illustrations within the text;
- including repetitive background information;
- constantly referring to the research methods;
- overlooking negative findings that do not support biases or invalid claims;
- providing charts, figures, visuals, or tables excessively;
- explaining the results comprehensively;
- presenting a findings section of other research papers as writers’ study results;
- failing to give graphs, figures, and tables a number;
- not mentioning a specific chart, figure, visual, or table number within the text.
Summing Up on How to Write a Perfect Results Section
- Start writing a results section by restating the purpose of a research paper.
- Use the past tense to describe the findings.
- Avoid vague language.
- Provide a clear, coherent, and logical explanation of all results without bias.
- Include the data that answers the research question(s) or validates or invalidates the hypothesis(es).
- Use useful and quality visual illustrations, like charts, figures, and tables.
- Present details about data analysis and interpretation and mention any statistical tests and their results.
- Report statistically insignificant findings to give a research paper credibility.
- Conclude with a short paragraph that summarizes the key findings.
- Proofread, revise, and edit a results section to eliminate any mistakes.
To Learn More, Read Relevant Articles

Understanding the Environmental Impact of Electric Vehicles
- Icon Calendar 21 August 2023
- Icon Page 902 words

Delving Into the Enigma of Alternate Universes: A Hypothetical Journey
- Icon Calendar 20 August 2023
- Icon Page 745 words

How to Write an Impressive Thesis Results Section

After collecting and analyzing your research data, it’s time to write the results section. This article explains how to write and organize the thesis results section, the differences in reporting qualitative and quantitative data, the differences in the thesis results section across different fields, and the best practices for tables and figures.
What is the thesis results section?
The thesis results section factually and concisely describes what was observed and measured during the study but does not interpret the findings. It presents the findings in a logical order.
What should the thesis results section include?
- Include all relevant results as text, tables, or figures
- Report the results of subject recruitment and data collection
- For qualitative research, present the data from all statistical analyses, whether or not the results are significant
- For quantitative research, present the data by coding or categorizing themes and topics
- Present all secondary findings (e.g., subgroup analyses)
- Include all results, even if they do not fit in with your assumptions or support your hypothesis
What should the thesis results section not include?
- If the study involves the thematic analysis of an interview, don’t include complete transcripts of all interviews. Instead, add these as appendices
- Don’t present raw data. These may be included in appendices
- Don’t include background information (this should be in the introduction section )
- Don’t speculate on the meaning of results that do not support your hypothesis. This will be addressed later in the discussion and conclusion sections.
- Don’t repeat results that have been presented in tables and figures. Only highlight the pertinent points or elaborate on specific aspects
How should the thesis results section be organized?
The opening paragraph of the thesis results section should briefly restate the thesis question. Then, present the results objectively as text, figures, or tables.
Quantitative research presents the results from experiments and statistical tests , usually in the form of tables and figures (graphs, diagrams, and images), with any pertinent findings emphasized in the text. The results are structured around the thesis question. Demographic data are usually presented first in this section.
For each statistical test used, the following information must be mentioned:
- The type of analysis used (e.g., Mann–Whitney U test or multiple regression analysis)
- A concise summary of each result, including descriptive statistics (e.g., means, medians, and modes) and inferential statistics (e.g., correlation, regression, and p values) and whether the results are significant
- Any trends or differences identified through comparisons
- How the findings relate to your research and if they support or contradict your hypothesis
Qualitative research presents results around key themes or topics identified from your data analysis and explains how these themes evolved. The data are usually presented as text because it is hard to present the findings as figures.
For each theme presented, describe:
- General trends or patterns observed
- Significant or representative responses
- Relevant quotations from your study subjects
Relevant characteristics about your study subjects
Differences among the results section in different fields of research
Nevertheless, results should be presented logically across all disciplines and reflect the thesis question and any hypotheses that were tested.
The presentation of results varies considerably across disciplines. For example, a thesis documenting how a particular population interprets a specific event and a thesis investigating customer service may both have collected data using interviews and analyzed it using similar methods. Still, the presentation of the results will vastly differ because they are answering different thesis questions. A science thesis may have used experiments to generate data, and these would be presented differently again, probably involving statistics. Nevertheless, results should be presented logically across all disciplines and reflect the thesis question and any hypotheses that were tested.
Differences between reporting thesis results in the Sciences and the Humanities and Social Sciences (HSS) domains
In the Sciences domain (qualitative and experimental research), the results and discussion sections are considered separate entities, and the results from experiments and statistical tests are presented. In the HSS domain (qualitative research), the results and discussion sections may be combined.
There are two approaches to presenting results in the HSS field:
- If you want to highlight important findings, first present a synopsis of the results and then explain the key findings.
- If you have multiple results of equal significance, present one result and explain it. Then present another result and explain that, and so on. Conclude with an overall synopsis.
Best practices for using tables and figures
The use of figures and tables is highly encouraged because they provide a standalone overview of the research findings that are much easier to understand than wading through dry text mentioning one result after another. The text in the results section should not repeat the information presented in figures and tables. Instead, it should focus on the pertinent findings or elaborate on specific points.
Some popular software programs that can be used for the analysis and presentation of statistical data include Statistical Package for the Social Sciences (SPSS ) , R software , MATLAB , Microsoft Excel, Statistical Analysis Software (SAS) , GraphPad Prism , and Minitab .
The easiest way to construct tables is to use the Table function in Microsoft Word . Microsoft Excel can also be used; however, Word is the easier option.
General guidelines for figures and tables
- Figures and tables must be interpretable independent from the text
- Number tables and figures consecutively (in separate lists) in the order in which they are mentioned in the text
- All tables and figures must be cited in the text
- Provide clear, descriptive titles for all figures and tables
- Include a legend to concisely describe what is presented in the figure or table
Figure guidelines
- Label figures so that the reader can easily understand what is being shown
- Use a consistent font type and font size for all labels in figure panels
- All abbreviations used in the figure artwork should be defined in the figure legend
Table guidelines
- All table columns should have a heading abbreviation used in tables should be defined in the table footnotes
- All numbers and text presented in tables must correlate with the data presented in the manuscript body
Quantitative results example : Figure 3 presents the characteristics of unemployed subjects and their rate of criminal convictions. A statistically significant association was observed between unemployed people <20 years old, the male sex, and no household income.

Qualitative results example: Table 5 shows the themes identified during the face-to-face interviews about the application that we developed to anonymously report corruption in the workplace. There was positive feedback on the app layout and ease of use. Concerns that emerged from the interviews included breaches of confidentiality and the inability to report incidents because of unstable cellphone network coverage.
|
|
| Ease of use of the app | The app was easy to use, and I did not have to contact the helpdesk |
| I wish all apps were so user-friendly! | |
| App layout | The screen was not cluttered. The text was easy to read |
| The icons on the screen were easy to understand | |
| Confidentiality | I am scared that the app developers will disclose my name to my employer |
| Unstable network coverage | I was unable to report an incident that occurred at one of our building sites because there was no cellphone reception |
| I wanted to report the incident immediately , but I had to wait until I was home, where the cellphone network signal was strong |
Table 5. Themes and selected quotes from the evaluation of our app designed to anonymously report workplace corruption.
Tips for writing the thesis results section
- Do not state that a difference was present between the two groups unless this can be supported by a significant p-value .
- Present the findings only . Do not comment or speculate on their interpretation.
- Every result included must have a corresponding method in the methods section. Conversely, all methods must have associated results presented in the results section.
- Do not explain commonly used methods. Instead, cite a reference.
- Be consistent with the units of measurement used in your thesis study. If you start with kg, then use the same unit all throughout your thesis. Also, be consistent with the capitalization of units of measurement. For example, use either “ml” or “mL” for milliliters, but not both.
- Never manipulate measurement outcomes, even if the result is unexpected. Remain objective.
Results vs. discussion vs. conclusion
Results are presented in three sections of your thesis: the results, discussion, and conclusion.
- In the results section, the data are presented simply and objectively. No speculation or interpretation is given.
- In the discussion section, the meaning of the results is interpreted and put into context (e.g., compared with other findings in the literature ), and its importance is assigned.
- In the conclusion section, the results and the main conclusions are summarized.
A thesis is the most crucial document that you will write during your academic studies. For professional thesis editing and thesis proofreading services , visit Enago Thesis Editing for more information.
Editor’s pick
Get free updates.
Subscribe to our newsletter for regular insights from the research and publishing industry!
Review Checklist
Have you completed all data collection procedures and analyzed all results ?
Have you included all results relevant to your thesis question, even if they do not support your hypothesis?
Have you reported the results objectively , with no interpretation or speculation?
For quantitative research, have you included both descriptive and inferential statistical results and stated whether they support or contradict your hypothesis?
Have you used tables and figures to present all results?
In your thesis body, have you presented only the pertinent results and elaborated on specific aspects that were presented in the tables and figures?
Are all tables and figures correctly labeled and cited in numerical order in the text?
Frequently Asked Questions
What file formats do you accept +.
We accept all file formats, including Microsoft Word, Microsoft Excel, PDF, Latex, etc.
How to identify whether paraphrasing is required? +
We provide a report entailing recommendations for a single Plagiarism Check service. You can also write to us at [email protected] for further assistance as paraphrasing is sold offline and has a relatively high conversion in most geographies.
What information do i need to provide? +
Please upload your research manuscript when you place the order. If you want to include the tables, charts, and figure legends in the plagiarism check, please ensure that all content is in editable formats and in one single document.
Is repetition percentage of 25-30% considered acceptable by the journal for my manuscript? +
Acceptable repetition rate varies by journal but aim for low percentages (usually <5%). Avoid plagiarism, cite sources, and use detection tools. High plagiarism can lead to rejection, reputation damage, and serious consequences. Consult your institution for guidance on addressing plagiarism concerns.
Do you offer help to rewrite and paraphrase the plagiarized text in my manuscript? +
We can certainly help you rewrite and paraphrase text in your manuscript to ensure it is not plagiarized under our Developmental Content rewriting service. You can provide specific passages or sentences that you suspect may be plagiarized, and we can assist you in rephrasing them to ensure originality.
Which international languages does iThenticate have content for in its database? +
iThenticate searches for content matches in the following 30 languages: Chinese (Simplified and Traditional), Japanese, Thai, Korean, Catalan, Croatian, Czech, Danish, Dutch, Finnish, French, German, Hungarian, Italian, Norwegian (Bokmal, Nynorsk), Polish, Portuguese, Romanian, Serbian, Slovak, Slovenian, Spanish, Swedish, Arabic, Greek, Hebrew, Farsi, Russian, and Turkish. Please note that iThenticate will match your text with text of the same language.
Have a language expert improve your writing
Run a free plagiarism check in 10 minutes, automatically generate references for free.
- Knowledge Base
- Dissertation
- How to Write a Results Section | Tips & Examples
How to Write a Results Section | Tips & Examples
Published on 27 October 2016 by Bas Swaen . Revised on 25 October 2022 by Tegan George.
A results section is where you report the main findings of the data collection and analysis you conducted for your thesis or dissertation . You should report all relevant results concisely and objectively, in a logical order. Don’t include subjective interpretations of why you found these results or what they mean – any evaluation should be saved for the discussion section .
Instantly correct all language mistakes in your text
Be assured that you'll submit flawless writing. Upload your document to correct all your mistakes.
Table of contents
How to write a results section, reporting quantitative research results, reporting qualitative research results, results vs discussion vs conclusion, checklist: research results, frequently asked questions about results sections.
When conducting research, it’s important to report the results of your study prior to discussing your interpretations of it. This gives your reader a clear idea of exactly what you found and keeps the data itself separate from your subjective analysis.
Here are a few best practices:
- Your results should always be written in the past tense.
- While the length of this section depends on how much data you collected and analysed, it should be written as concisely as possible.
- Only include results that are directly relevant to answering your research questions . Avoid speculative or interpretative words like ‘appears’ or ‘implies’.
- If you have other results you’d like to include, consider adding them to an appendix or footnotes.
- Always start out with your broadest results first, and then flow into your more granular (but still relevant) ones. Think of it like a shoe shop: first discuss the shoes as a whole, then the trainers, boots, sandals, etc.
Prevent plagiarism, run a free check.
If you conducted quantitative research , you’ll likely be working with the results of some sort of statistical analysis .
Your results section should report the results of any statistical tests you used to compare groups or assess relationships between variables . It should also state whether or not each hypothesis was supported.
The most logical way to structure quantitative results is to frame them around your research questions or hypotheses. For each question or hypothesis, share:
- A reminder of the type of analysis you used (e.g., a two-sample t test or simple linear regression ). A more detailed description of your analysis should go in your methodology section.
- A concise summary of each relevant result, both positive and negative. This can include any relevant descriptive statistics (e.g., means and standard deviations ) as well as inferential statistics (e.g., t scores, degrees of freedom , and p values ). Remember, these numbers are often placed in parentheses.
- A brief statement of how each result relates to the question, or whether the hypothesis was supported. You can briefly mention any results that didn’t fit with your expectations and assumptions, but save any speculation on their meaning or consequences for your discussion and conclusion.
A note on tables and figures
In quantitative research, it’s often helpful to include visual elements such as graphs, charts, and tables , but only if they are directly relevant to your results. Give these elements clear, descriptive titles and labels so that your reader can easily understand what is being shown. If you want to include any other visual elements that are more tangential in nature, consider adding a figure and table list .
As a rule of thumb:
- Tables are used to communicate exact values, giving a concise overview of various results
- Graphs and charts are used to visualise trends and relationships, giving an at-a-glance illustration of key findings
Don’t forget to also mention any tables and figures you used within the text of your results section. Summarise or elaborate on specific aspects you think your reader should know about rather than merely restating the same numbers already shown.

Figure 1: Intention to donate to environmental organisations based on social distance from impact of environmental damage.
In qualitative research , your results might not all be directly related to specific hypotheses. In this case, you can structure your results section around key themes or topics that emerged from your analysis of the data.
For each theme, start with general observations about what the data showed. You can mention:
- Recurring points of agreement or disagreement
- Patterns and trends
- Particularly significant snippets from individual responses
Next, clarify and support these points with direct quotations. Be sure to report any relevant demographic information about participants. Further information (such as full transcripts , if appropriate) can be included in an appendix .
‘I think that in role-playing games, there’s more attention to character design, to world design, because the whole story is important and more attention is paid to certain game elements […] so that perhaps you do need bigger teams of creative experts than in an average shooter or something.’
Responses suggest that video game consumers consider some types of games to have more artistic potential than others.
Your results section should objectively report your findings, presenting only brief observations in relation to each question, hypothesis, or theme.
It should not speculate about the meaning of the results or attempt to answer your main research question . Detailed interpretation of your results is more suitable for your discussion section , while synthesis of your results into an overall answer to your main research question is best left for your conclusion .
I have completed my data collection and analyzed the results.
I have included all results that are relevant to my research questions.
I have concisely and objectively reported each result, including relevant descriptive statistics and inferential statistics .
I have stated whether each hypothesis was supported or refuted.
I have used tables and figures to illustrate my results where appropriate.
All tables and figures are correctly labelled and referred to in the text.
There is no subjective interpretation or speculation on the meaning of the results.
You've finished writing up your results! Use the other checklists to further improve your thesis.
The results chapter of a thesis or dissertation presents your research results concisely and objectively.
In quantitative research , for each question or hypothesis , state:
- The type of analysis used
- Relevant results in the form of descriptive and inferential statistics
- Whether or not the alternative hypothesis was supported
In qualitative research , for each question or theme, describe:
- Recurring patterns
- Significant or representative individual responses
- Relevant quotations from the data
Don’t interpret or speculate in the results chapter.
Results are usually written in the past tense , because they are describing the outcome of completed actions.
The results chapter or section simply and objectively reports what you found, without speculating on why you found these results. The discussion interprets the meaning of the results, puts them in context, and explains why they matter.
In qualitative research , results and discussion are sometimes combined. But in quantitative research , it’s considered important to separate the objective results from your interpretation of them.
Cite this Scribbr article
If you want to cite this source, you can copy and paste the citation or click the ‘Cite this Scribbr article’ button to automatically add the citation to our free Reference Generator.
Swaen, B. (2022, October 25). How to Write a Results Section | Tips & Examples. Scribbr. Retrieved 2 July 2024, from https://www.scribbr.co.uk/thesis-dissertation/results-section/
Is this article helpful?

Other students also liked
What is a research methodology | steps & tips, how to write a discussion section | tips & examples, how to write a thesis or dissertation conclusion.
- Expert Journal of Finance
- Expert Journal of Economics
- Expert Journal of Marketing
- Expert Journal of Business and Management
- Send Your Article
- Google Plus
How to Write the Results Section of a Research Paper
This article is part of an ongoing series on academic writing help of scholarly articles. Previous parts explored how to write an introduction for a research paper , literature review outline and format , and how to write a research methodology .
Academics and researchers publish their scholarly articles to show the results they have obtained using gathered or collected data. Research papers present the process of testing hypotheses or models and how their findings help shape or advance a particular research topic. Thus, the ‘Results’ section is essential in expressing the significance of an academic article.
The findings of your research should be included in a separate section of your academic article, as it is the only section that contains data and results.
Aspects to Consider in Writing the Results Section of a Research Paper
A good place to start for your results section, it’s to restate the aim and objective of your research paper , so that your readers can refocus on the core of your academic article. So far in your research paper, your readers covered the introduction , literature review , research methodology and now it’s the time and place to bring their attention back to the purpose. A short paragraph is sufficient to restate your paper’s purpose.
Then, it’s key to consider that this is main section of your research paper where you present and explain the data you have collected or gathered and the findings of your data analysis and interpretation .
The academic writing should be clear, impartial, and objective . Each result, which confirms or refutes your assumptions, should be noted in an unbiased manner to increase the credibility of your study.
The results section gives you the opportunity to:
- summarize the collected data in the form of descriptive statistics and
- report on the findings from relevant and appropriate inferential statistical analyses and interpretation that are aimed at answering your academic article’s research questions or supporting your hypotheses, and show your research significance.
For an organized Research Results section, it’s best to use sub-sections. These sub-sections or divisions can be based on:
- Your research questions, hypotheses or models , or
- The statistical tests you have conducted.
How to Clearly Report Your Research Findings
If you have used statistical analyses in your academic article, and found answers to your research questions, report those facts in relation to your question.
A clear, coherent presentation of your research paper’s results should exhibit logical explanations without bias.
Confirming or Rejecting Hypotheses in Your Research Results
While defining the section of your research’s outcomes area, it’s important to keep in mind that the research results do not prove or demonstrate anything.
Your research findings can only affirm/ confirm or reject the hypotheses and assumptions elaborated upon in your academic article. In any case, your results:
- help with the understanding of a research problem from within,
- assist in dividing the research problem into different parts and concepts,
- add to the exploration of an issue from various vantage points.
Summarizing Key Findings in Your Results Section
In a coherent results presentation, you should:
- offer summarizing notes of your outcomes and
- save the explanations of your key discoveries for your Discussion section.
For example, in your empirical analysis you notice an uncommon correlation between two variables. In the Results section, it is okay to bring up this outcome, however, posing new hypotheses for this uncommon result should be presented in the Discussion section.
Using Tables and Figures to Highlight Research Results
Any valuable academic article should focus on using tables, figures and/or graphs to:
- provide accurate views about the research findings,
- summarize the analysis,
- help with the interpretation of these outcomes, and
- offer better understanding of the overall study.
Instead of using only descriptive text for your scholarly article, consider other visual ways and representations that improve the academic writing of your research paper.
Figures, tables and graphs are useful methods for gathering a great deal of information into one place that can then be mentioned in the content of your article. If any research question or hypothesis is confirmed by your data and analysis, you can point to a table or figure that illustrates your finding.
When you present tables or figures in your results section, make sure to describe at least some of the data included in these visual representations so that readers can clearly understand how the table works and what interpretations can be concluded from them.
You can also use appendices if you have many other helpful figures or tables that cannot be fully included in the text of your academic article.
By using a helpful combination of text, figures, and tables, you, as Authors and Academics, can use this section to effectively share your studies’ findings with the scientific community.
Presenting Research Findings and Statistical Significance
A systematic description of your research results and a correct data analysis and interpretation are related to statistical significance, as they help avoid speculations or misinterpretations by readers of your academic article.
In a valuable research paper:
- data must be directly and clearly presented,
- statistical tests need to be used, and
- the figures obtained and included in the study have to be explained.
Tests of statistical significance should always be presented with your results to show that your research findings objectively confirm or disprove your hypotheses. You need to report the research results with enough details so that readers can see which statistical analyses were conducted and validated to justify or disprove your hypotheses. It is important to mention relevant research findings, including those that were are statistical insignificant, not validated within your model’s framework, and are at odds with your initial assumptions.
Even if not all of your research results are confirmed, you should not ignore them. These negative results that do not support a particular hypothesis should be noted in the results section, and then explained in the Discussion section.
Writing a Research Results section that do not address the negative results, invalidates the research paper and does not reflect appropriate academic writing.
Research Results Comparison with Similar Academic Articles
The largest part of interpreting and discussing your research findings should be reserved for the Discussion / Conclusion section.
However, there are instances when it is appropriate to compare or contrast your results with findings from previous and similar studies. For example:
- Similar to Author [Year], one of the findings of this study is the strong relationship between…
- While Author [Year] found an indirect relationship between, our study highlighted ….
Key Aspects for Your Research Results Section
For a good structure and organization of your research, keep in mind these aspects:
- Start your research results section by restating the purpose of your research, so that your readers can re-focus on core of your academic article
- Include helpful and quality tables, figures, graphs that can synthesize your research
- Make sure you include details about your data analysis and interpretation, as well as statistical significance tests
- Report the statistical insignificant research findings for your academic article’s credibility
- Use the past tense when describing to your research results
- Do not use vague terms and be as concise as possible when you are reporting your research findings
- Conclude your section with a short paragraph that summarizes your study’s key outcomes.
Which aspects do you focus on when writing your research results section?
This blog series focuses on useful academic writing tips. Next, we examine the Discussion and Conclusion section . Find our more on writing high-quality research papers
You may also like
Related policies and links, responsibilities of the publisher in the relationship with journal editors, general duties of publisher.

Current students
- Staff intranet
- Find an event
Research skills for HDR students
- Overview and planning
- Theses including publications
- Originality
- Structuring your thesis
- Literature reviews
Writing up results
- Interpreting results
The results section in an empirical thesis describes your findings that can be used to answer your research question, or confirm, partially confirm, or disprove your hypotheses. It functions as a stepping-stone to the discussion and may be combined with your discussion section, or have elements of discussion included.
In the results section, you present your findings in figures (graphs and diagrams), tables and written text. Figures and tables present the complete findings in numerical, visual or graphical terms, while the written text helps the reader to focus on the most important aspects of the results and to interpret them.
Generally, there are four stages to a results section.
- Background information so that the reader can place your results in the context of other research.
- Tables and/or figures presenting your results. These are located and identified through numbers (for example, ‘Table 1’) and captions.
- Text accompanying and referring to the tables or figures, describing the aspects of the results you are focusing on.
- Comments on the results. For example, generalisations arising from the results, explanations of possible reasons for the results or a comparison of the results with other studies.
Sometimes results can be presented together, with an accompanying general comment. Other times each result requires its own comment.
As well as presenting your findings, the results section forms a basis for the discussion. The discussion is a set of arguments about the relevance, usefulness and possibilities or limitations of your findings. In the discussion you may have to explain the significance of your research, explain unexpected outcomes, refer to previous research, give examples, relate your results to your hypothesis, and make recommendations.
Not all of the elements above are included in all theses – there is considerable variation among different disciplines, particularly in the humanities.
This material was developed by the Learning Hub (Academic Language and Learning), which offers workshops, face-to-face consultations and resources to support your learning. Find out more about how they can help you develop your communication, research and study skills .
See our handout on Writing a thesis proposal (pdf, 341KB) .
Related links
- Learning Hub (Academic Language and Learning)
- Learning Hub (Academic Language and Learning) workshops
- Prepare your thesis
- Website feedback
Your feedback has been sent.
Sorry there was a problem sending your feedback. Please try again
You should only use this form to send feedback about the content on this webpage – we will not respond to other enquiries made through this form. If you have an enquiry or need help with something else such as your enrolment, course etc you can contact the Student Centre.
- Find an expert
- Media contacts
Student links
- How to log in to University systems
- Class timetables
- Our rankings
- Faculties and schools
- Research centres
- Campus locations
- Find a staff member
- Careers at Sydney
- Emergencies and personal safety

- Accessibility
- +44 (0) 207 391 9032
Recent Posts
- How to Write a Research Paper Like a Pro
- Academic Integrity vs. Academic Dishonesty: Understanding the Key Differences
- How to Use AI to Enhance Your Thesis
- Guide to Structuring Your Narrative Essay for Success
- How to Hook Your Readers with a Compelling Topic Sentence
- Is a Thesis Writing Format Easy? A Comprehensive Guide to Thesis Writing
- The Complete Guide to Copy Editing: Roles, Rates, Skills, and Process
- How to Write a Paragraph: Successful Essay Writing Strategies
- Everything You Should Know About Academic Writing: Types, Importance, and Structure
- Concise Writing: Tips, Importance, and Exercises for a Clear Writing Style
- Academic News
- Custom Essays
- Dissertation Writing
- Essay Marking
- Essay Writing
- Essay Writing Companies
- Model Essays
- Model Exam Answers
- Oxbridge Essays Updates
- PhD Writing
- Significant Academics
- Student News
- Study Skills
- University Applications
- University Essays
- University Life
- Writing Tips

Writing up the results section of your dissertation
(Last updated: 12 May 2021)
Since 2006, Oxbridge Essays has been the UK’s leading paid essay-writing and dissertation service
We have helped 10,000s of undergraduate, Masters and PhD students to maximise their grades in essays, dissertations, model-exam answers, applications and other materials. If you would like a free chat about your project with one of our UK staff, then please just reach out on one of the methods below.
When asked why doing a dissertation can be such a headache, the typical student usually replies with one of two answers. Either, they simply don't like writing enormous volumes of text, or – and you may relate here – they categorically do not enjoy analysing data. "It's so long and boring!", the typical student wails.
Well, students wail, and we answer. We have put together this very comprehensive, very useful guide on how to write up the results section of your dissertation. To help you further, we've broken the information down into both quantitative and qualitative results, so you can focus on what applies to you most.
Writing up your quantitative results
Understanding the basics of your research.
First, you need to recall what you have assessed – or what your main variables are.
All quantitative research has at least one independent and one dependent variable, and, at this point, you should define them explicitly. An independent variable is one that you control to test its effects on the dependent variable. A dependent variable is thus your outcome variable.
Second, you need to determine if your variables were categorical or continuous.
A categorical variable is one with a fixed number of possible values, and a continuous variable is one where final scores have a wide range. Finally, you need to recall if you have used a so-called covariate or confounder variable. This is a variable that could have influenced the relationship between your independent and dependent variable, and that you controlled in order to accurately estimate the relationship between your main variables.
Let’s explain all this with an example. Suppose that your research was to assess whether height is associated with self-esteem. Here, participants’ height is an independent variable and self-esteem is a dependent variable. Because both height and scores on a measure of self-esteem can have a wide range, you have two continuous variables. You might have also wanted to see if the relationship between height and self-esteem exists after controlling for participants’ weight. In this case, weight is a confounding variable that you need to control for.
Here is another example. You might have assessed whether more females than males want to read a specific romantic novel. Here, your independent variable is gender and your dependent variable is the determination to read the book. Since gender has categories (male and female), this is a categorical variable. If you have assessed the determination to read the book on a scale from 1 to 10 (e.g. 1 = no determination at all to read the book, all the way to 10 = extremely strong determination to read it), then this is a continuous variable; however, if you have asked your participants to say whether they do or do not want to read the book, then this is a categorical variable (since there are two categories: “yes” and “no”).
Lastly, you might have wanted to see if the link between gender and the determination to read the book exists after controlling for participants’ current relationship status. Here, relationship status is your confounding variable.
We will return to these examples throughout this blog post. At this point, it is important to remember that outlining your research in this way helps you to write up your results section in the easiest way possible.
Let’s move on to the next step.
Outlining descriptive and frequencies statistics
In order to report descriptive and/or frequencies statistics, you need to outline all variables that you have used in your research and note whether those variables are continuous or categorical.
For continuous variables, you are using descriptive statistics and reporting the measures of central tendency (mean) and measures of variability or spread (standard deviation). For categorical variables, you are using frequencies statistics and reporting the number (or frequency) of participants per category and associated percentages. Both these statistics require you to make a table, and in both cases you also need to comment upon the statistics.
How does all of this look in practice? Recall the two examples that were outlined above. If you have assessed the association between participants’ height and self-esteem, while controlling for participants’ weight, then your research consists of three continuous variables. You need to make a table, as in TABLE 1 below, which identifies means and standard deviations for all these variables. When commenting upon the results, you can say:
Participants were on average 173.50 cm tall (SD = 5.81) and their mean weight was 65.31 kg (SD = 4.44). On average, participants had moderate levels of self-esteem (M = 5.55, SD = 2.67).
Note that, in this example, you are concluding that participants had moderate self-esteem levels if their self-esteem was assessed on a 1 to 10 scale. Since the value of 5 falls within the middle of this range, you are concluding that the mean value of self-esteem is moderate. If the mean value was higher (e.g., M = 8.33), you would conclude that participants’ self-esteem was, on average, high; and if the mean value was lower (e.g., M = 2.44), you would conclude that average self-esteem scores were low.
| M | SD | |
|---|---|---|
| Height (cm) | 173.50 | 5.81 |
| Weight (kg) | 65.31 | 4.44 |
| Self-esteem | 5.55 | 2.67 |
Let’s now return to our second research example and say that you want to report the degree to which males and females want to read a romantic novel, where this determination was assessed on a 1-10 (continuous) scale. This would look as shown in TABLE 2.
| Males | Females | |
|---|---|---|
| Determination to read the book | M = 3.20 | M = 6.33 |
| Determination to read the book | SD = .43 | SD = 1.36 |
We can see how to report frequencies statistics for different groups by referring to our second example about gender, determination to read a romantic novel, and participants’ relationship status.
Here, you have three categorical variables (if determination to read the novel was assessed by having participants reply with “yes” or “no”). Thus, you are not reporting means and standard deviations, but frequencies and percentages.
To put this another way, you are noting how many males versus females wanted to read the book and how many of them were in a relationship, as shown in TABLE 3. You can report these statistics in this way:
Twenty (40%) male participants wanted to read the book and 35 (70%) female participants wanted to read the book. Moreover, 22 (44%) males and 26 (52%) females indicated that they are currently in a relationship.
| Males | Females | |
|---|---|---|
| Determination to read the book | ||
| Yes | 20 (40%) | 35 (70%) |
| No | 30 (60%) | 15 (30%) |
| Relationship status | ||
| Yes | 22 (44%) | 26 (52%) |
| No | 28 (56%) | 24 (48%) |
Reporting the results of a correlation analysis
The first of these is correlation, which you use when you want to establish if one or more (continuous, independent) variables relate to another (continuous, dependent) variable. For instance, you may want to see if participants’ height correlates with their self-esteem levels.
The first step here is to report whether your variables are normally distributed. You do this by looking at a histogram that describes your data. If the histogram has a bell-shaped curve (see purple graph below), your data is normally distributed and you need to rely on a Pearson correlation analysis. Here, you need to report the obtained r value (correlation coefficient) and p value (which needs to be lower than .05 in order to establish significance). If you find a correlation, you need to say something like:

One final thing to note, which is important for all analyses, is that when your p value is indicated to be .000, you never report it by saying “ p = .000”, but by noting “ p p = .011”.
If your data is skewed rather than normally distributed (see red graphs), then you need to rely on a Spearman correlation analysis. Here, you report the results by saying:
Spearman correlation analysis revealed a positive relationship between people’s height and their self-esteem (r s = .44, p There has been a significant positive correlation between height and self-esteem after controlling for participants’ weight ( r = .39, p = .034).
You also need to make a table that will summarise your main results. If you didn’t use a covariate, you will have a fairly simple table, such as that shown in TABLE 4. If you have used a covariate, your table is slightly more complex, such as that shown in TABLE 5. Note that both tables use “-” to indicate correlations that have already been noted within the table. Also note how “*”, “**”, and “***” are used to annotate correlations that are significant at different levels.
| Height (cm) | Self-esteem | |
|---|---|---|
| Height (cm) | 1.00 | – |
| Self-esteem | .44*** | 1.00 |
| *** |
| Control variables | Height (cm) | Self-esteem | Weight (kg) | |
|---|---|---|---|---|
| None | Height (cm) | 1.00 | – | – |
| Self-esteem | .44*** | 1.00 | – | |
| Weight (kg) | .38** | .32** | 1.00 | |
| Weight (kg) | Height (cm) | 1.00 | – | – |
| Self-esteem | .39* | 1.00 | -.44 | |
| * |
Reporting the results of a regression
These are the specific points that you need to address in order to make sure that all assumptions have been met:
(1) for the assumption of no multicollinearity (i.e., a lack of high correlation between your independent variables), you need to establish that none of your Tolerance statistics are below .01 and none of the VIF statistics are above 10;
(2) for the assumption of no autocorrelation of residuals (i.e., a lack of correlation between the residuals of two observations), you need to look at this table and see whether your Durbin-Watson statistic falls within a desirable range, depending on your number of participants and the number of predictors (independent variables); and,
(3) for the assumptions of linearity (i.e., a linear relationship between independent and dependent variables) and homoscedasticity (i.e., a variance of error terms that should be similar across the independent variables), you need to look at the scatterplot of standardised residual on standardised predicted value and conclude that your graph doesn’t funnel out or curve.
All of this may sound quite complex. But in reality it is not: you just need to look at your results output to note the Tolerance and VIF values, Durbin-Watson value, and the scatterplot. Once you conclude that your assumptions have been met, you write something like:
Since none of the VIF values were below 0.1 and none of the Tolerance values were above 10, the assumption of no multicollinearity has been met. Durbin-Watson statistics fell within an expected range, thus indicating that the assumption of no autocorrelation of residuals has been met as well. Finally, the scatterplot of standardised residual on standardised predicted value did not funnel out or curve, and thus the assumptions of linearity and homoscedasticity have been met as well.
If your assumptions have not been met, you need to dig a bit deeper and understand what this means. A good idea would be to read the chapter on regression (and especially the part about assumptions) written by Andy Field. You can access his book here . This will help you understand all you need to know about the assumptions of a regression analysis, how to test them, and what to do if they have not been met.
Now let’s focus on reporting the results of the actual regression analysis. Let’s say that you wanted to see if participants’ height predicts their self-esteem, after controlling for participants’ weight. You have entered height and weight as predictors in the model and self-esteem as a dependent variable.
First, you need to report whether the model reached significance in predicting self-esteem scores. Look at the results of an ANOVA analysis in your output and note the F value, degrees of freedom for the model and for residuals, and significance level. These values are shown in PICTURE 2.

Significance value tells you if your predictor reached significance – such as whether participants’ height predicted self-esteem scores. You also need to comment upon the β value. This value represents the change in the outcome associated with a unit change in the predictor . Thus, if your β value is .351 for participants’ height (predictor/independent variable), then this means that for every increase in height by 1 cm, self-esteem increases by .35. You need to report the same thing for your other predictor – that is, participants’ weight.
Finally, since your model included both height and weight as predictors, and height acted as a significant predictor, you can conclude that participants’ height influences their self-esteem after controlling for weight.

Reporting the results of a chi-square analysis
For instance, you would do a chi-square analysis when you want to see whether gender (categorical independent variable with two levels: males/females) affects the determination to read a book, when this variable is measured with yes/no answers (categorical dependent variable with two levels: yes/no).
When reporting your results, you should first make a table as shown in TABLE 3 above. Then you need to report the results of a chi-square test, by noting the Pearson chi-square value, degrees of freedom, and significance value. You can see all these in your output.
Finally, you need to report the strength of the association, for which you need to look at the Phi and Cramer’s V values. When each of your variables has only two categories, as in the present example, Phi and Cramer’s V values are identical and it doesn’t matter which one you will report. However, when one of your variables has more than two categories, it is better to report the Cramer’s V value. You report these values by indicating the actual value and the associated significance level.
Note that Cramer’s V value can range from 0 to 1. The closer the value is to 1, the higher the strength of the association. You can report the results of the chi-square analysis in the following way:
Reporting the results of a t-test analysis
Recall that you have previously outlined descriptive statistics for these variables, where you have noted means and standard deviations for males’ and females’ scores on the determination to read the novel (see TABLE 2 above). Now you need to report the obtained t value, degrees of freedom, and significance level – all of which you can see in your results output.
You can say something like:
Reporting the results of one-way ANOVA
In the t-test example, you had two conditions of a categorical independent variable, which corresponded to whether a participant was male or female. You would have three conditions of an independent variable when assessing whether relationship status (independent variable with three levels: single, in a relationship, and divorced) affects the determination to read a romantic novel (as assessed on a 1-10 scale).
Here, you would report the results in a similar manner to that of a t -test. You first report the means and standard deviations on the determination to read the book for all three groups of participants, by saying who had the highest and lowest mean. Then you report the results of the ANOVA test by reporting the F value, degrees of freedom (for within-subjects and between-subjects comparisons), and the significance value.
There are two things to note here. First, before reporting your results, you need to look at your output to see whether the so-called Levene’s test is significant. This test assesses the homogeneity of variance – the assumption being that all comparison groups should have the same variance. If the test is non-significant, the assumption has been met and you are reporting the standard F value.
However, if the test is significant, the assumption has been violated and you need to report instead the Welch statistic, associated degrees of freedom, and significance value (which you will see in your output; for example, see PICTURE 3 above).
The second thing to note is that ANOVA tells you only whether there were significant differences between groups – but if there are differences, it doesn’t tell you where these differences lie. For this, you need to conduct a post-hoc comparison (Tukey’s HSD test). The output will tell you which comparisons are significant.
You can report your results in the following manner:
Reporting the results of ANCOVA
For instance, you will use ANCOVA when you want to test whether relationship status (categorical independent variable with three levels: single, in a relationship, divorced) affects the determination to read a romantic novel (continuous dependent variable, assessed on a 1-10 scale) after controlling for participants’ general interest in books (continuous covariate, assessed on a 1-10 scale).
To report the results, you need to look at the “test of between-subjects effects” table in your output. You need to report the F values, degrees of freedom (for each variable and error), and significance values for both the covariate and the main independent variable. As with ANOVA, a significant ANCOVA doesn’t tell you where the differences lie. For this, you need to conduct planned contrasts and report the associated significance values for different comparisons.
You can report the results in the following manner:
Reporting the results of MANOVA
For instance, you would use MANOVA when testing whether male versus female participants (independent variable) show a different determination to read a romantic novel (dependent variable) and a determination to read a crime novel (dependent variable).
When reporting the results, you first need to notice whether the so-called Box’s test and Levene’s test are significant. These tests assess two assumptions: that there is an equality of covariance matrices (Box’s test) and that there is an equality of variances for each dependent variable (Levene’s test).
Both tests need to be non-significant in order to assess whether your assumptions are met. If the tests are significant, you need to dig deeper and understand what this means. Once again, you may find it helpful to read the chapter by Andy Field on MANOVA, which can be accessed here .
Following this, you need to report your descriptive statistics, as outlined previously. Here, you are reporting the means and standard deviations for each dependent variable, separately for each group of participants. Then you need to look at the results of “multivariate analyses”.
You will notice that you are presented with four statistic values and associated F and significance values. These are labelled as Pillai’s Trace, Wilks’ Lambda, Hotelling’s Trace, and Roy’s Largest Root. These statistics test whether your independent variable has an effect on the dependent variables. The most common practice is to report only the Pillai’s Trace. You report the results in the same manner as reporting ANOVA, by noting the F value, degrees of freedom (for hypothesis and error), and significance value.
However, you also need to report the statistic value of one of the four statistics mentioned above. You can label the Pillai’s Trace statistic with V, the Wilks’ Lambda statistic with A, the Hotelling’s Trace statistic with T, and Roy’s Largest Root statistic with Θ (but you need report only one of them).
Finally, you need to look at the results of the Tests of Between-Subjects Effects (which you will see in your output). These tests tell you how your independent variable affected each dependent variable separately. You report these results in exactly the same way as in ANOVA.
Here’s how you can report all results from MANOVA:
Writing up your qualitative results
Before reporting the results of your qualitative research, you need to recall what type of research you have conducted. The most common types of qualitative research are interviews, observations, and focus groups – and your research is likely to fall into one of these types.
All three types of research are reported in a similar manner. Still, it may be useful if we focus on each of them separately.
Reporting the results of interviews
For example, let’s say that your qualitative research focused on young people’s reasons for smoking. You have asked your participants questions that explored why they started smoking, why they continue to smoke, and why they wish to quit smoking. Since your research was organised in this manner, you already have three major themes: (1) reasons for starting to smoke, (2) reasons for continuing to smoke, and (3) reasons for quitting smoking. You then explore particular reasons why your participants started to smoke, why they continue to smoke, and why they want to quit. Each reason that you identify will act as a subtheme.
When reporting the results, you should organise your text in subsections. Each section should refer to one theme. Then, within each section, you need to discuss the subthemes that you discovered in your data.
Let’s say that you found that young people started smoking because: (1) they thought smoking was cool, (2) they experienced peer pressure, (3) their parents modelled smoking behaviour, (4) they thought smoking reduces stress, and (5) they wanted to try something new. Now you have five subthemes within your “reasons for starting to smoke” theme. What you need to do now is to present the findings for each subtheme, while also reporting quotes that best describe your subtheme. You do that for each theme and subtheme.
It is also good practice to make a table that lists all your themes, subthemes, and associated quotes.
Here’s an example of how to report a quote within a text:
Reporting the results of observations
For instance, you might have noticed that the therapist finds it important to discuss: (1) the origin of the problem, (2) the lack of a patient’s medical difficulties, (3) the experience of stress, (4) the link of stress to the problem, and (5) the new understanding of the problem. You can consider these as themes in your observations.
Accordingly, you will want to report each theme separately. You do this by outlining your observation first (this can be a conversation or a behaviour that you observed), and then commenting upon it.
Here’s an example:
Therapist: Was there something that stressed you out during the last few months?
Patient: Yes, of course. I thought I would lose my job, but that passed. After that, I was breaking up with my girlfriend. But between those things, I was fine.
Therapist: And was there any difference in your symptoms while you were and while you were not stressed?
Patient: Hmmm. Actually yes. Now that I think of it, they were mostly present when I went through those periods.
Therapist: Could it be that stress intensifies your symptoms?
Patient: I never thought of it. I guess it seems logical. Is it?
Reporting the results of focus groups
As an example, let’s say that your focus group dealt with identifying reasons why some people prefer Coca-Cola over Schweppes, and vice versa. You have transcribed your focus group sessions and have extracted themes from the data. You have discovered a wide variety of reasons why people prefer one of the two drinks.
When reporting your results, you should have two sections: one listing reasons for favouring Coca-Cola, and the other listing reasons for favouring Schweppes. Within each section, you need to identify specific reasons for these preferences. You should connect these specific reasons to particular quotes.
Here’s an example of how this may look:
In conclusion…
As we have seen, writing up qualitative results is easier than writing quantitative results. Yet, even reporting statistics is not that hard, especially if you have a good guide to help you.
Hopefully, this guide has reduced your worries and increased your confidence that you can write up the results section of your dissertation without too many difficulties.

How to correctly reference a dissertation

How to finish and format your dissertation

Dissertation writing: publishing a dissertation
- dissertation help
- dissertation research
- dissertation results
- study skills
- writing tips
Writing Services
- Essay Plans
- Critical Reviews
- Literature Reviews
- Presentations
- Dissertation Title Creation
- Dissertation Proposals
- Dissertation Chapters
- PhD Proposals
- Journal Publication
- CV Writing Service
- Business Proofreading Services
Editing Services
- Proofreading Service
- Editing Service
- Academic Editing Service
Additional Services
- Marking Services
- Consultation Calls
- Personal Statements
- Tutoring Services
Our Company
- Frequently Asked Questions
- Become a Writer
Terms & Policies
- Fair Use Policy
- Policy for Students in England
- Privacy Policy
- Terms & Conditions
- [email protected]
- Contact Form
Payment Methods
Cryptocurrency payments.

The Complete Guide: How to Report ANOVA Results
A one-way ANOVA is used to determine whether or not there is a statistically significant difference between the means of three or more independent groups.
When reporting the results of a one-way ANOVA, we always use the following general structure:
- A brief description of the independent and dependent variable.
- The overall F-value of the ANOVA and the corresponding p-value.
- The results of the post-hoc comparisons (if the p-value was statistically significant).
Here’s the exact wording we can use:
A one-way ANOVA was performed to compare the effect of [independent variable] on [dependent variable]. A one-way ANOVA revealed that there [was or was not] a statistically significant difference in [dependent variable] between at least two groups (F(between groups df, within groups df) = [F-value], p = [p-value]). Tukey’s HSD Test for multiple comparisons found that the mean value of [dependent variable] was significantly different between [group name] and [group name] (p = [p-value], 95% C.I. = [lower, upper]). There was no statistically significant difference between [group name] and [group name] (p=[p-value]).
The following example shows how to report the results of a one-way ANOVA in practice.
Example: Reporting the Results of a One-Way ANOVA
Suppose a researcher recruits 30 students to participate in a study. The students are randomly assigned to use one of three studying techniques for the next month to prepare for an exam. At the end of the month, all of the students take the same test.
The researcher then performs a one-way ANOVA to determine if there is a difference in mean exam scores between the three groups.
The following table shows the results of the one-way ANOVA along with the Tukey post-hoc multiple comparisons table:

Here is how to report the results of the one-way ANOVA:
A one-way ANOVA was performed to compare the effect of three different studying techniques on exam scores. A one-way ANOVA revealed that there was a statistically significant difference in mean exam score between at least two groups (F(2, 27) = [4.545], p = 0.02). Tukey’s HSD Test for multiple comparisons found that the mean value of exam score was significantly different between technique 1 and technique 2 (p = 0.024, 95% C.I. = [-14.48, -0.92]). There was no statistically significant difference in mean exam scores between technique 1 and technique 3 (p=0.883) or between technique 2 and technique 3 (p=0.067).
Things to Keep in Mind
Here are a few things to keep in mind when reporting the results of a one-way ANOVA:
Use a descriptive statistics table.
It can be helpful to present a descriptive statistics table that shows the mean and standard deviation of values in each treatment group as well to give the reader a more complete picture of the data.
For example, SPSS produces the following descriptive statistics table that shows the mean and standard deviation of exam scores for students in each of the three study technique groups:

Only report post-hoc results if necessary.
If the overall p-value of the ANOVA is not statistically significant, then you will not conduct post-hoc multiple comparisons between groups. This means you obviously don’t have to report any post-hoc results in the final report.
If you do have to conduct post-hoc tests, the Tukey HSD test is the most commonly used one but occasionally you may use the Scheffe or Bonferroni test instead.
Round p-values when necessary.
As a general rule of thumb, the overall F value and any p-values in ANOVA results are rounded to either two or three decimal places for brevity.
No matter how many decimal places you choose to use, be sure to be consistent throughout the report.
Additional Resources
The following tutorials explain how to report other statistical tests and procedures in APA format:
How to Report Two-Way ANOVA Results (With Examples) How to Report Cronbach’s Alpha (With Examples) How to Report t-Test Results (With Examples) How to Report Chi-Square Results (With Examples) How to Report Pearson’s Correlation (With Examples) How to Report Regression Results (With Examples)
Featured Posts
Hey there. My name is Zach Bobbitt. I have a Masters of Science degree in Applied Statistics and I’ve worked on machine learning algorithms for professional businesses in both healthcare and retail. I’m passionate about statistics, machine learning, and data visualization and I created Statology to be a resource for both students and teachers alike. My goal with this site is to help you learn statistics through using simple terms, plenty of real-world examples, and helpful illustrations.
12 Replies to “The Complete Guide: How to Report ANOVA Results”
very informative
Your content is very detailed and yet simple to follow. Thanks a lot Zach for all the great work!
Hi. Can you help me in reporting more than three groups? Does it come the same way as this.
Thank you, for the explanation on the ANOVA and Post Host results writing
I find this platform very educative and would like to learn more on how to interpret more statistical information under you. Thanks
This was extremely helpful! Thank you!
Guide me on how t- can be used in comparison of variables
Thank you! Bless your soul. 🙂
I gained some knowledge
zach thank you for the guide to report anova results , you are a legend.
If the results of ANOVA contradict that of the post-hoc. ANOVA is significant but the post hoc is not, how do I report the results?????
Leave a Reply Cancel reply
Your email address will not be published. Required fields are marked *
Join the Statology Community
Sign up to receive Statology's exclusive study resource: 100 practice problems with step-by-step solutions. Plus, get our latest insights, tutorials, and data analysis tips straight to your inbox!
By subscribing you accept Statology's Privacy Policy.

How to Create a Survey Results Report (+7 Examples to Steal)
Do you need to write a survey results report?
A great report will increase the impact of your survey results and encourage more readers to engage with the content.
Create Your Survey Now
In This Article
1. Use Data Visualization
2. write the key facts first, 3. write a short survey summary, 4. explain the motivation for your survey, 5. put survey statistics in context, 6. tell the reader what the outcome should be, 7. export your survey results in other formats, bonus tip: export data for survey analysis, faqs on writing survey summaries, how to write a survey results report.
Let’s walk through some tricks and techniques with real examples.
The most important thing about a survey report is that it allows readers to make sense of data. Visualizations are a key component of any survey summary.
Examples of Survey Visualizations
Pie charts are perfect when you want to bring statistics to life. Here’s a great example from a wedding survey:

Pie charts can be simple and still get the message across. A well-designed chart will also add impact and reinforce the story you want to tell.
Here’s another great example from a homebuyer survey introduction:

If your survey is made up of open-ended questions, it might be more challenging to produce charts. If that’s the case, you can write up your findings instead. We’ll look at that next.
When you’re thinking about how to write a summary of survey results, remember that the introduction needs to get the reader’s attention.
Focusing on key facts helps you to do that right at the start.
This is why it’s usually best to write the survey introduction at the end once the rest of the survey report has been compiled. That way, you know what the big takeaways are.
This is an easy and powerful way to write a survey introduction that encourages the reader to investigate.
Examples of Survey Summaries With Key Facts
Here’s an awesome example of a survey summary that immediately draws the eye.
The key finding is presented first, and then we see a fact about half the group immediately after:

Using this order lets us see the impactful survey responses right up top.
If you need help deciding which questions to ask in your survey, check out this article on the best survey questions to include.
Your survey summary should give the reader a complete overview of the content. But you don’t want to take up too much space.
Survey summaries are sometimes called executive summaries because they’re designed to be quickly digested by decision-makers.
You’ll want to filter out the less important findings and focus on what matters. A 1-page summary is enough to get this information across. You might want to leave space for a table of contents on this page too.
Examples of Short Survey Introductions
One way to keep a survey summary short is to use a teaser at the start.
Here’s an example introduction that doesn’t state all of its findings but gives us the incentive to keep reading:

And here’s a great survey introduction that summarizes the findings in just one sentence:

In WPForms, you can reduce the size of your survey report by excluding questions you don’t need. We decided to remove this question from the report PDF because it has no answers. Just click the arrow at the top, and it won’t appear in the final printout:

This is a great way to quickly build a PDF summary of your survey that only includes the most important questions. You can also briefly explain your methodology.
When you create a survey in WordPress, you probably have a good idea of your reasons for doing so.
Make your purpose clear in the intro. For example, if you’re running a demographic survey , you might want to clarify that you’ll use this information to target your audience more effectively.
The reader must know exactly what you want to find out. Ideally, you should also explain why you wanted to create the survey in the first place. This can help you to reach the correct target audience for your survey.
Examples of Intros that Explain Motivation
This vehicle survey was carried out to help with future planning, so the introduction makes the purpose clear to the reader:

Having focused questions can help to give your survey a clear purpose. We have some questionnaire examples and templates that can help with that.
Explaining why you ran the survey helps to give context, which we’ll talk about more next.
Including numbers in a survey summary is important. But your survey summary should tell a story too.
Adding numbers to your introduction will help draw the eye, but you’ll also want to explain what the numbers tell you.
Otherwise, you’ll have a list of statistics that don’t mean much to the reader.
Examples of Survey Statistics in Context
Here’s a great example of a survey introduction that uses the results from the survey to tell a story.

Another way to put numbers in context is to present the results visually.
Here, WPForms has automatically created a table from our Likert Scale question that makes it easy to see a positive trend in the survey data:

If you’d like to use a Likert scale to produce a chart like this, check out this article on the best Likert scale questions for survey forms .
Now that your survey report is done, you’ll likely want action to be taken based on your findings.
That’s why it’s a good idea to make a recommendation.
If you already explained your reasons for creating the survey, you can naturally add a few sentences on the outcomes you want to see.
Examples of Survey Introductions with Recommendations
Here’s a nice example of a survey introduction that clearly states the outcomes that the organization would like to happen now that the survey is published:

This helps to focus the reader on the content and helps them to understand why the survey is important. Respondents are more likely to give honest answers if they believe that a positive outcome will come from the survey.
You can also cite related research here to give your reasoning more weight.
You can easily create pie charts in the WPForms Surveys and Polls addon. It allows you to change the way your charts look without being overwhelmed by design options.
This handy feature will save tons of time when you’re composing your survey results.
Once you have your charts, exporting them allows you to use them in other ways. You may want to embed them in marketing materials like:
- Presentation slides
- Infographics
- Press releases
WPForms makes it easy to export any graphic from your survey results so you can use it on your website or in slides.
Just use the dropdown to export your survey pie chart as a JPG or PDF:

And that’s it! You now know how to create an impactful summary of survey results and add these to your marketing material or reports.
WPForms is the best form builder plugin for WordPress. As well as having the best survey tools, it also has the best data export options.
Often, you’ll want to export form entries to analyze them in other tools. You can do exactly the same thing with your survey data.
For example, you can:
- Export your form entries or survey data to Excel
- Automatically send survey responses to a Google Sheet
We really like the Google Sheets addon in WPForms because it sends your entries to a Google Sheet as soon as they’re submitted. And you can connect any form or survey to a Sheet without writing any code.

The Google Sheets integration is powerful enough to send all of your metrics. You can add columns to your Sheet and map the data points right from your WordPress form.
This is an ideal solution if you want to give someone else access to your survey data so they can crunch the numbers in spreadsheet format.
We’ll finish up with a few questions we’ve been asked about survey reporting.
What Is a Survey Report and What Should It Include?
A survey report compiles all data collected during a survey and presents it objectively. The report often summarizes pages of data from all responses received and makes it easier for the audience to process and digest.
How Do You Present Survey Results in an Impactful Way?
The best way to present survey results is to use visualizations. Charts, graphs, and infographics will make your survey outcomes easier to interpret.
For online surveys, WPForms has an awesome Surveys and Polls addon that makes it easy to publish many types of surveys and collect data using special survey fields:
- Likert Scale (sometimes called a matrix question )
- Net Promoter Score (sometimes called an NPS Survey)
- Star Rating
- Single Line Text
- Multiple Choice (sometimes called radio buttons )
You can turn on survey reporting at any time, even if the form expiry date has passed.
To present your results, create a beautiful PDF by clicking Print Survey Report right from the WordPress dashboard:

Next Step: Make Your Survey Form
To create a great survey summary, you’ll want to start out with a great survey form. Check out this article on how to create a survey form online to learn how to create and customize your surveys in WordPress.
You can also:
- Learn how to create a popup WordPress survey
- Read some rating scale question examples
- Get started easily with a customer survey template from the WPForms template library.
Ready to build your survey? Get started today with the easiest WordPress form builder plugin. WPForms Pro includes free survey form templates and offers a 14-day money-back guarantee.
If this article helped you out, please follow us on Facebook and Twitter for more free WordPress tutorials and guides.
Using WordPress and want to get WPForms for free?
Enter the URL to your WordPress website to install.
This is really good
Hi Jocasta! Glad to hear that you enjoyed our article! Please check back often as we’re always adding new content as well as updating old ones!
Hi, I need to write an opinion poll report would you help with a sample I could use
Hi Thuku, I’m sorry but we don’t have any such examples available as it’s a bit outside our purview. A quick Google search does show some sites with information and examples regarding this though. I hope that helps!
With the Likert Scale what visualisation options are available? For example if there were 30 questions… I would like to be able to total up for all questions how many said never, or often… etc… and for each ‘x’ option for example if it was chocolate bars down the side and never through to often across the top… for each question… I would like to total for all questions for each chocolate bar… the totals of never through to often…? can you help?
Hey Nigel- to achieve what you’ve mentioned, I’d recommend you to make use of the Survey and Poll addon that has the ability to display the number of polls count. Here is a complete guide on this addon
If you’ve any questions, please get in touch with the support team and we’d be happy to assist you further!
Thanks, and have a good one 🙂
I am looking for someone to roll-up survey responses and prepare presentations/graphs. I have 58 responses. Does this company offer this as an option? If so, what are the cost?
Hi Ivory! I apologize for any misunderstanding, but we do not provide such services.
Hi! Can you make survey report.
Hi Umay! I apologize as I’m not entirely certain about your question, or what you’re looking to do. In case it helps though, our Survey and Polls addon does have some features to generate survey reports. You can find out more about that in this article .
I hope this helps to clarify 🙂 If you have any further questions about this, please contact us if you have an active subscription. If you do not, don’t hesitate to drop us some questions in our support forums .
Super helpful..
Hi Shaz! We’re glad to hear that you found this article helpful. Please check back often as we’re always adding new content and making updates to old ones 🙂
Hi , can you help meon how to present the questionnaire answer on my report writing
Hi Elida – Yes, we will be happy to help!
If you have a WPForms license, you have access to our email support, so please submit a support ticket . Otherwise, we provide limited complimentary support in the WPForms Lite WordPress.org support forum .
Add a Comment Cancel reply
We're glad you have chosen to leave a comment. Please keep in mind that all comments are moderated according to our privacy policy , and all links are nofollow. Do NOT use keywords in the name field. Let's have a personal and meaningful conversation.
Your Comment
Your Real Name
Your Email Address
Save my name, email, and website in this browser for the next time I comment.
This form is protected by reCAPTCHA and the Google Privacy Policy and Terms of Service apply.
Add Your Comment
- Testimonials
- FTC Disclosure
- Online Form Builder
- Conditional Logic
- Conversational Forms
- Form Landing Pages
- Entry Management
- Form Abandonment
- Form Notifications
- Form Templates
- File Uploads
- Calculation Forms
- Geolocation Forms
- Multi-Page Forms
- Newsletter Forms
- Payment Forms
- Post Submissions
- Signature Forms
- Spam Protection
- Surveys and Polls
- User Registration
- HubSpot Forms
- Mailchimp Forms
- Brevo Forms
- Salesforce Forms
- Authorize.Net
- PayPal Forms
- Square Forms
- Stripe Forms
- Documentation
- Plans & Pricing
- WordPress Hosting
- Start a Blog
- Make a Website
- Learn WordPress
- WordPress Forms for Nonprofits
Breaking News
OPINION ANALYSIS
Supreme court strikes down chevron , curtailing power of federal agencies.

This article was updated on June 28 at 3:46 p.m.
In a major ruling, the Supreme Court on Friday cut back sharply on the power of federal agencies to interpret the laws they administer and ruled that courts should rely on their own interpretion of ambiguous laws. The decision will likely have far-reaching effects across the country, from environmental regulation to healthcare costs.
By a vote of 6-3, the justices overruled their landmark 1984 decision in Chevron v. Natural Resources Defense Council , which gave rise to the doctrine known as the Chevron doctrine. Under that doctrine, if Congress has not directly addressed the question at the center of a dispute, a court was required to uphold the agency’s interpretation of the statute as long as it was reasonable. But in a 35-page ruling by Chief Justice John Roberts, the justices rejected that doctrine, calling it “fundamentally misguided.”
Justice Elena Kagan dissented, in an opinion joined by Justices Sonia Sotomayor and Ketanji Brown Jackson. Kagan predicted that Friday’s ruling “will cause a massive shock to the legal system.”
When the Supreme Court first issued its decision in the Chevron case more than 40 years ago, the decision was not necessarily regarded as a particularly consequential one. But in the years since then, it became one of the most important rulings on federal administrative law, cited by federal courts more than 18,000 times.
Although the Chevron decision – which upheld the Reagan-era Environmental Protection Agency’s interpretation of the Clean Air Act that eased regulation of emissions – was generally hailed by conservatives at the time, the ruling eventually became a target for those seeking to curtail the administrative state, who argued that courts, rather than federal agencies, should say what the law means. The justices had rebuffed earlier requests (including by one of the same lawyers who argued one of the cases here) to consider overruling Chevron before they agreed last year to take up a pair of challenges to a rule issued by the National Marine Fisheries Service. The agency had required the herring industry to pay for the costs, estimated at $710 per day, associated with carrying observers on board their vessels to collect data about their catches and monitor for overfishing.
The agency stopped the monitoring in 2023 because of a lack of funding. While the program was in effect, the agency reimbursed fishermen for the costs of the observers.
After two federal courts of appeals rebuffed challenges to the rules, two sets of commercial fishing companies came to the Supreme Court, asking the justices to weigh in.
The justices took up their appeals, agreeing to address only the Chevron question in Relentless v. Department of Commerce and Loper Bright Enterprises v. Raimondo . (Justice Ketanji Brown Jackson dissented in the Relentless case but was recused from the Loper-Bright case, presumably because she had heard oral argument in the case while she was still a judge on the U.S. Court of Appeals for the District of Columbia Circuit.)
Chevron deference, Roberts explained in his opinion for the court on Friday, is inconsistent with the Administrative Procedure Act, a federal law that sets out the procedures that federal agencies must follow as well as instructions for courts to review actions by those agencies. The APA, Roberts noted, directs courts to “decide legal questions by applying their own judgment” and therefore “makes clear that agency interpretations of statutes — like agency interpretations of the Constitution — are not entitled to deference. Under the APA,” Roberts concluded, “it thus remains the responsibility of the court to decide whether the law means what the agency says.”
Roberts rejected any suggestion that agencies, rather than courts, are better suited to determine what ambiguities in a federal law might mean. Even when those ambiguities involve technical or scientific questions that fall within an agency’s area of expertise, Roberts emphasized, “Congress expects courts to handle technical statutory questions” – and courts also have the benefit of briefing from the parties and “friends of the court.”
Moreover, Roberts observed, even if courts should not defer to an agency’s interpretation of an ambiguous statute that it administers, it can consider that interpretation when it falls within the agency’s purview, a doctrine known as Skidmore deference.
Stare decisis – the principle that courts should generally adhere to their past cases – does not provide a reason to uphold the Chevron doctrine, Roberts continued. Roberts characterized the doctrine as “unworkable,” one of the criteria for overruling prior precedent, because it is so difficult to determine whether a statute is indeed ambiguous.
And because of the Supreme Court’s “constant tinkering with” the doctrine, along with its failure to rely on the doctrine in eight years, there is no reason for anyone to rely on Chevron . To the contrary, Roberts suggested, the Chevron doctrine “allows agencies to change course even when Congress has given them no power to do so.”
Roberts indicated that the court’s decision on Friday would not require earlier cases that relied on Chevron to be overturned. “Mere reliance on Chevron cannot constitute a ‘special justification’ for overruling” a decision upholding agency action, “because to say a precedent relied on Chevron is, at best, just an argument that the precedent was wrongly decided” – which is not enough, standing along, to overrule the case.
The Supreme Court is expected to rule on Monday on when the statute of limitations to challenge agency action begins to run. The federal government has argued in that case, Corner Post v. Federal Reserve , that if the challenger prevails, it would open the door for a wide range of “belated challenges to agency regulation.”
Justice Clarence Thomas penned a brief concurring opinion in which he emphasized that the Chevron doctrine was inconsistent not only with the Administrative Procedure Act but also with the Constitution’s division of power among the three branches of government. The Chevron doctrine, he argued, requires judges to give up their constitutional power to exercise their independent judgment, and it allows the executive branch to “exercise powers not given to it.”
Justice Neil Gorsuch filed a longer (33-page) concurring opinion in which he emphasized that “[t]oday, the Court places a tombstone on Chevron no one can miss. In doing so, the Court returns judges to interpretative rules that have guided federal courts since the Nation’s founding.” He sought to downplay the impact of Friday’s ruling, contending that “all today’s decision means is that, going forward, federal courts will do exactly as this Court has since 2016, exactly as it did before the mid-1980s, and exactly as it had done since the founding: resolve cases and controversies without any systemic bias in the government’s favor.”
Kagan, who read a summary of her dissent from the bench, was sharply critical of the decision to overrule the Chevron doctrine. Congress often enacts regulatory laws that contain ambiguities and gaps, she observed, which agencies must then interpret. The question, as she framed it, is “[w]ho decides which of the possible readings” of those laws should prevail?
For 40 years, she stressed, the answer to that question has generally been “the agency’s,” with good reason: Agencies are more likely to have the technical and scientific expertise to make such decisions. She emphasized the deep roots that Chevron has had in the U.S. legal system for decades. “It has been applied in thousands of judicial decisions. It has become part of the warp and woof of modern government, supporting regulatory efforts of all kinds — to name a few, keeping air and water clean, food and drugs safe, and financial markets honest.”
By overruling the Chevron doctrine, Kagan concluded, the court has created a “jolt to the legal system.”
Kagan also pushed back against the majority’s suggestion that overruling the Chevron doctrine would introduce clarity into judicial review of agency interpretations. Noting the majority’s assurances that agency interpretations may be entitled to “respect” going forward, she observed that “[i]f the majority thinks that the same judges who argue today about where ‘ambiguity’ resides are not going to argue tomorrow about what ‘respect’ requires, I fear it will be gravely disappointed.”
Similarly, she questioned the majority’s assertion that Friday’s decision would not call into question decisions that relied on the Chevron doctrine to uphold agency action. “Courts motivated to overrule an old Chevron -based decision can always come up with something to label a ‘special justification,’” she posited. “All a court need do is look to today’s opinion to see how it is done.”
But more broadly, Kagan rebuked her colleagues in the majority for what she characterized as a judicial power grab. She lamented that, by overruling Chevron , the court had, in “one fell swoop,” given “itself exclusive power over every open issue — no matter how expertise-driven or policy-laden — involving the meaning of regulatory law.”
Roman Martinez, who argued the case on behalf of one of the fishing companies, applauded the decision. “By ending Chevron deference,” he said in a statement, “the Court has taken a major step to preserve the separation of powers and shut down unlawful agency overreach. Going forward, judges will be charged with interpreting the law faithfully, impartially, and independently, without deference to the government. This is a win for individual liberty and the Constitution,”
But Kym Meyer, the litigation director for the Southern Environmental Law Center, decried the ruling in a statement. “[T]he Supreme Court today says individual judges around the country should decide the best reading of a statute. That is a recipe for chaos, as hundreds of federal judges — who lack the expertise of agency personnel — are certain to reach inconsistent results on the meaning of federal laws as applied to complex, technical issues.”
Friday’s ruling came in one of three cases during the 2023-24 term seeking to curtail the power of federal agencies – a conservative effort sometimes dubbed the “war on the administrative state.” In October, the court heard arguments in a challenge to the constitutionality of the mechanism used to fund the consumer watchdog Consumer Financial Protection Bureau. Last month the court upheld the CFPB’s funding by a 7-2 vote. And on Thursday, the justices pared back the power of the Securities and Exchange Commission and other administrative agencies, holding that the SEC cannot continue to use in-house proceedings to impose fines in securities fraud cases.
The fishermen in both cases were represented at no cost by conservative legal groups, the Cause of Action Institute and the New Civil Liberties Alliance, linked to funding from billionaire and longtime anti-regulation advocate Charles Koch .
This article was originally published at Howe on the Court .
Posted in Featured , Merits Cases
Cases: Loper Bright Enterprises v. Raimondo , Relentless, Inc. v. Department of Commerce
Recommended Citation: Amy Howe, Supreme Court strikes down Chevron , curtailing power of federal agencies , SCOTUSblog (Jun. 28, 2024, 12:37 PM), https://www.scotusblog.com/2024/06/supreme-court-strikes-down-chevron-curtailing-power-of-federal-agencies/
Privacy Overview
IMAGES
VIDEO
COMMENTS
Checklist: Research results 0 / 7. I have completed my data collection and analyzed the results. I have included all results that are relevant to my research questions. I have concisely and objectively reported each result, including relevant descriptive statistics and inferential statistics. I have stated whether each hypothesis was supported ...
Research results refer to the findings and conclusions derived from a systematic investigation or study conducted to answer a specific question or hypothesis. These results are typically presented in a written report or paper and can include various forms of data such as numerical data, qualitative data, statistics, charts, graphs, and visual aids.
Include these in your results section: Participant flow and recruitment period. Report the number of participants at every stage of the study, as well as the dates when recruitment took place. Missing data. Identify the proportion of data that wasn't included in your final analysis and state the reasons.
Present the results of the paper, in logical order, using tables and graphs as necessary. Explain the results and show how they help to answer the research questions posed in the Introduction. Evidence does not explain itself; the results must be presented and then explained. Avoid: presenting results that are never discussed; presenting ...
Step 1: Consult the guidelines or instructions that the target journal or publisher provides authors and read research papers it has published, especially those with similar topics, methods, or results to your study. The guidelines will generally outline specific requirements for the results or findings section, and the published articles will ...
Practical guidance for writing an effective results section for a research paper. Always use simple and clear language. Avoid the use of uncertain or out-of-focus expressions. The findings of the study must be expressed in an objective and unbiased manner. While it is acceptable to correlate certain findings in the discussion section, it is ...
When writing the results section, avoid doing the following: Discussing or interpreting your results. Save this for the discussion section of your paper, although where appropriate, you should compare or contrast specific results to those found in other studies [e.g., "Similar to the work of Smith [1990], one of the findings of this study is ...
How do I write the results chapter? There are multiple steps involved in writing up the results chapter for your quantitative research. The exact number of steps applicable to you will vary from study to study and will depend on the nature of the research aims, objectives and research questions.However, we'll outline the generic steps below.
Build coherence along this section using goal statements and explicit reasoning (guide the reader through your reasoning, including sentences of this type: 'In order to…, we performed….'; 'In view of this result, we ….', etc.). In summary, the general steps for writing the Results section of a research article are:
Tips to Write the Results Section. Direct the reader to the research data and explain the meaning of the data. Avoid using a repetitive sentence structure to explain a new set of data. Write and highlight important findings in your results. Use the same order as the subheadings of the methods section.
Structure your results section around tables or figures that summarize the results of your statistical analysis. In many cases, the easiest way to accomplish this is to first create your tables and figures and then organize them in a logical way. Next, write the summary text to support your illustrative materials.
The results section is where you report the main findings of your research. Watch this video to learn how to report your results concisely and objectively in...
Developing a well-written research paper is an important step in completing a scientific study. This paper is where the principle investigator and co-authors report the purpose, methods, findings, and conclusions of the study. A key element of writing a research paper is to clearly and objectively report the study's findings in the Results section.
Since the first two journals—Journal des Scavans in France and Philosophical Transactions of the Royal Society of London in England—started publishing scientific results in 1665, journals have been the main channel for scientific communication. 1 Over 48,000 active scientific peer-reviewed journals are published globally as of late 2021, with 35,000 of these being published in English. 2 ...
Summing Up on How to Write a Perfect Results Section. Start writing a results section by restating the purpose of a research paper. Use the past tense to describe the findings. Avoid vague language. Provide a clear, coherent, and logical explanation of all results without bias.
Include all relevant results as text, tables, or figures. Report the results of subject recruitment and data collection. For qualitative research, present the data from all statistical analyses, whether or not the results are significant. For quantitative research, present the data by coding or categorizing themes and topics.
Checklist: Research results 0 / 7. I have completed my data collection and analyzed the results. I have included all results that are relevant to my research questions. I have concisely and objectively reported each result, including relevant descriptive statistics and inferential statistics. I have stated whether each hypothesis was supported ...
The results section of a research paper tells the reader what you found, while the discussion section tells the reader what your findings mean. The results section should present the facts in an academic and unbiased manner, avoiding any attempt at analyzing or interpreting the data. Think of the results section as setting the stage for the ...
In the Results section, it is okay to bring up this outcome, however, posing new hypotheses for this uncommon result should be presented in the Discussion section. ... Writing a Research Results section that do not address the negative results, invalidates the research paper and does not reflect appropriate academic writing. ...
Writing up results. The results section in an empirical thesis describes your findings that can be used to answer your research question, or confirm, partially confirm, or disprove your hypotheses. It functions as a stepping-stone to the discussion and may be combined with your discussion section, or have elements of discussion included.
PICTURE 2. Results of ANOVA for regression: Now you need to report the value of R 2 (see PICTURE 3), which tells you the degree to which your model predicted self-esteem scores. You need to multiply this value by 100 to get a percentage. Thus, if your R 2 value is .335, the percentage becomes 33.5%.
The following example shows how to report the results of a one-way ANOVA in practice. Example: Reporting the Results of a One-Way ANOVA. Suppose a researcher recruits 30 students to participate in a study. The students are randomly assigned to use one of three studying techniques for the next month to prepare for an exam.
A great report will increase the impact of your survey results and encourage more readers to engage with the content. Create Your Survey Now. In This Article. 1. Use Data Visualization. 2. Write the Key Facts First. 3. Write a Short Survey Summary.
"[T]he Supreme Court today says individual judges around the country should decide the best reading of a statute. That is a recipe for chaos, as hundreds of federal judges — who lack the expertise of agency personnel — are certain to reach inconsistent results on the meaning of federal laws as applied to complex, technical issues."