

Bridging the Gap: Overcome these 7 flaws in descriptive research design
Descriptive research design is a powerful tool used by scientists and researchers to gather information about a particular group or phenomenon. This type of research provides a detailed and accurate picture of the characteristics and behaviors of a particular population or subject. By observing and collecting data on a given topic, descriptive research helps researchers gain a deeper understanding of a specific issue and provides valuable insights that can inform future studies.
In this blog, we will explore the definition, characteristics, and common flaws in descriptive research design, and provide tips on how to avoid these pitfalls to produce high-quality results. Whether you are a seasoned researcher or a student just starting, understanding the fundamentals of descriptive research design is essential to conducting successful scientific studies.
Table of Contents
What Is Descriptive Research Design?
The descriptive research design involves observing and collecting data on a given topic without attempting to infer cause-and-effect relationships. The goal of descriptive research is to provide a comprehensive and accurate picture of the population or phenomenon being studied and to describe the relationships, patterns, and trends that exist within the data.
Descriptive research methods can include surveys, observational studies , and case studies, and the data collected can be qualitative or quantitative . The findings from descriptive research provide valuable insights and inform future research, but do not establish cause-and-effect relationships.
Importance of Descriptive Research in Scientific Studies
1. understanding of a population or phenomenon.
Descriptive research provides a comprehensive picture of the characteristics and behaviors of a particular population or phenomenon, allowing researchers to gain a deeper understanding of the topic.
2. Baseline Information
The information gathered through descriptive research can serve as a baseline for future research and provide a foundation for further studies.
3. Informative Data
Descriptive research can provide valuable information and insights into a particular topic, which can inform future research, policy decisions, and programs.
4. Sampling Validation
Descriptive research can be used to validate sampling methods and to help researchers determine the best approach for their study.
5. Cost Effective
Descriptive research is often less expensive and less time-consuming than other research methods , making it a cost-effective way to gather information about a particular population or phenomenon.
6. Easy to Replicate
Descriptive research is straightforward to replicate, making it a reliable way to gather and compare information from multiple sources.
Key Characteristics of Descriptive Research Design
The primary purpose of descriptive research is to describe the characteristics, behaviors, and attributes of a particular population or phenomenon.
2. Participants and Sampling
Descriptive research studies a particular population or sample that is representative of the larger population being studied. Furthermore, sampling methods can include convenience, stratified, or random sampling.
3. Data Collection Techniques
Descriptive research typically involves the collection of both qualitative and quantitative data through methods such as surveys, observational studies, case studies, or focus groups.
4. Data Analysis
Descriptive research data is analyzed to identify patterns, relationships, and trends within the data. Statistical techniques , such as frequency distributions and descriptive statistics, are commonly used to summarize and describe the data.
5. Focus on Description
Descriptive research is focused on describing and summarizing the characteristics of a particular population or phenomenon. It does not make causal inferences.
6. Non-Experimental
Descriptive research is non-experimental, meaning that the researcher does not manipulate variables or control conditions. The researcher simply observes and collects data on the population or phenomenon being studied.
When Can a Researcher Conduct Descriptive Research?
A researcher can conduct descriptive research in the following situations:
- To better understand a particular population or phenomenon
- To describe the relationships between variables
- To describe patterns and trends
- To validate sampling methods and determine the best approach for a study
- To compare data from multiple sources.
Types of Descriptive Research Design
1. survey research.
Surveys are a type of descriptive research that involves collecting data through self-administered or interviewer-administered questionnaires. Additionally, they can be administered in-person, by mail, or online, and can collect both qualitative and quantitative data.
2. Observational Research
Observational research involves observing and collecting data on a particular population or phenomenon without manipulating variables or controlling conditions. It can be conducted in naturalistic settings or controlled laboratory settings.
3. Case Study Research
Case study research is a type of descriptive research that focuses on a single individual, group, or event. It involves collecting detailed information on the subject through a variety of methods, including interviews, observations, and examination of documents.
4. Focus Group Research
Focus group research involves bringing together a small group of people to discuss a particular topic or product. Furthermore, the group is usually moderated by a researcher and the discussion is recorded for later analysis.
5. Ethnographic Research
Ethnographic research involves conducting detailed observations of a particular culture or community. It is often used to gain a deep understanding of the beliefs, behaviors, and practices of a particular group.
Advantages of Descriptive Research Design
1. provides a comprehensive understanding.
Descriptive research provides a comprehensive picture of the characteristics, behaviors, and attributes of a particular population or phenomenon, which can be useful in informing future research and policy decisions.
2. Non-invasive
Descriptive research is non-invasive and does not manipulate variables or control conditions, making it a suitable method for sensitive or ethical concerns.
3. Flexibility
Descriptive research allows for a wide range of data collection methods , including surveys, observational studies, case studies, and focus groups, making it a flexible and versatile research method.
4. Cost-effective
Descriptive research is often less expensive and less time-consuming than other research methods. Moreover, it gives a cost-effective option to many researchers.
5. Easy to Replicate
Descriptive research is easy to replicate, making it a reliable way to gather and compare information from multiple sources.
6. Informs Future Research
The insights gained from a descriptive research can inform future research and inform policy decisions and programs.
Disadvantages of Descriptive Research Design
1. limited scope.
Descriptive research only provides a snapshot of the current situation and cannot establish cause-and-effect relationships.
2. Dependence on Existing Data
Descriptive research relies on existing data, which may not always be comprehensive or accurate.
3. Lack of Control
Researchers have no control over the variables in descriptive research, which can limit the conclusions that can be drawn.
The researcher’s own biases and preconceptions can influence the interpretation of the data.
5. Lack of Generalizability
Descriptive research findings may not be applicable to other populations or situations.
6. Lack of Depth
Descriptive research provides a surface-level understanding of a phenomenon, rather than a deep understanding.
7. Time-consuming
Descriptive research often requires a large amount of data collection and analysis, which can be time-consuming and resource-intensive.
7 Ways to Avoid Common Flaws While Designing Descriptive Research
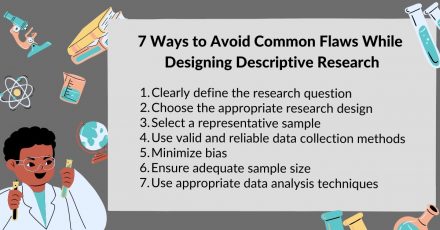
1. Clearly define the research question
A clearly defined research question is the foundation of any research study, and it is important to ensure that the question is both specific and relevant to the topic being studied.
2. Choose the appropriate research design
Choosing the appropriate research design for a study is crucial to the success of the study. Moreover, researchers should choose a design that best fits the research question and the type of data needed to answer it.
3. Select a representative sample
Selecting a representative sample is important to ensure that the findings of the study are generalizable to the population being studied. Researchers should use a sampling method that provides a random and representative sample of the population.
4. Use valid and reliable data collection methods
Using valid and reliable data collection methods is important to ensure that the data collected is accurate and can be used to answer the research question. Researchers should choose methods that are appropriate for the study and that can be administered consistently and systematically.
5. Minimize bias
Bias can significantly impact the validity and reliability of research findings. Furthermore, it is important to minimize bias in all aspects of the study, from the selection of participants to the analysis of data.
6. Ensure adequate sample size
An adequate sample size is important to ensure that the results of the study are statistically significant and can be generalized to the population being studied.
7. Use appropriate data analysis techniques
The appropriate data analysis technique depends on the type of data collected and the research question being asked. Researchers should choose techniques that are appropriate for the data and the question being asked.
Have you worked on descriptive research designs? How was your experience creating a descriptive design? What challenges did you face? Do write to us or leave a comment below and share your insights on descriptive research designs!

extremely very educative
Indeed very educative and useful. Well explained. Thank you
Simple,easy to understand
Rate this article Cancel Reply
Your email address will not be published.

Enago Academy's Most Popular Articles
![What is Academic Integrity and How to Uphold it [FREE CHECKLIST]](https://www.enago.com/academy/wp-content/uploads/2024/05/FeatureImages-59-210x136.png "descriptive research goals")
Ensuring Academic Integrity and Transparency in Academic Research: A comprehensive checklist for researchers
Academic integrity is the foundation upon which the credibility and value of scientific findings are…

- Publishing Research
- Reporting Research
How to Optimize Your Research Process: A step-by-step guide
For researchers across disciplines, the path to uncovering novel findings and insights is often filled…

- Industry News
- Trending Now
Breaking Barriers: Sony and Nature unveil “Women in Technology Award”
Sony Group Corporation and the prestigious scientific journal Nature have collaborated to launch the inaugural…

Achieving Research Excellence: Checklist for good research practices
Academia is built on the foundation of trustworthy and high-quality research, supported by the pillars…

- Promoting Research
Plain Language Summary — Communicating your research to bridge the academic-lay gap
Science can be complex, but does that mean it should not be accessible to the…
Choosing the Right Analytical Approach: Thematic analysis vs. content analysis for…
Comparing Cross Sectional and Longitudinal Studies: 5 steps for choosing the right…
Research Recommendations – Guiding policy-makers for evidence-based decision making

Sign-up to read more
Subscribe for free to get unrestricted access to all our resources on research writing and academic publishing including:
- 2000+ blog articles
- 50+ Webinars
- 10+ Expert podcasts
- 50+ Infographics
- 10+ Checklists
- Research Guides
We hate spam too. We promise to protect your privacy and never spam you.
I am looking for Editing/ Proofreading services for my manuscript Tentative date of next journal submission:

What would be most effective in reducing research misconduct?
Have a language expert improve your writing
Run a free plagiarism check in 10 minutes, generate accurate citations for free.
- Knowledge Base
Methodology
- Descriptive Research | Definition, Types, Methods & Examples
Descriptive Research | Definition, Types, Methods & Examples
Published on May 15, 2019 by Shona McCombes . Revised on June 22, 2023.
Descriptive research aims to accurately and systematically describe a population, situation or phenomenon. It can answer what , where , when and how questions , but not why questions.
A descriptive research design can use a wide variety of research methods to investigate one or more variables . Unlike in experimental research , the researcher does not control or manipulate any of the variables, but only observes and measures them.
Table of contents
When to use a descriptive research design, descriptive research methods, other interesting articles.
Descriptive research is an appropriate choice when the research aim is to identify characteristics, frequencies, trends, and categories.
It is useful when not much is known yet about the topic or problem. Before you can research why something happens, you need to understand how, when and where it happens.
Descriptive research question examples
- How has the Amsterdam housing market changed over the past 20 years?
- Do customers of company X prefer product X or product Y?
- What are the main genetic, behavioural and morphological differences between European wildcats and domestic cats?
- What are the most popular online news sources among under-18s?
- How prevalent is disease A in population B?
Receive feedback on language, structure, and formatting
Professional editors proofread and edit your paper by focusing on:
- Academic style
- Vague sentences
- Style consistency
See an example

Descriptive research is usually defined as a type of quantitative research , though qualitative research can also be used for descriptive purposes. The research design should be carefully developed to ensure that the results are valid and reliable .
Survey research allows you to gather large volumes of data that can be analyzed for frequencies, averages and patterns. Common uses of surveys include:
- Describing the demographics of a country or region
- Gauging public opinion on political and social topics
- Evaluating satisfaction with a company’s products or an organization’s services
Observations
Observations allow you to gather data on behaviours and phenomena without having to rely on the honesty and accuracy of respondents. This method is often used by psychological, social and market researchers to understand how people act in real-life situations.
Observation of physical entities and phenomena is also an important part of research in the natural sciences. Before you can develop testable hypotheses , models or theories, it’s necessary to observe and systematically describe the subject under investigation.
Case studies
A case study can be used to describe the characteristics of a specific subject (such as a person, group, event or organization). Instead of gathering a large volume of data to identify patterns across time or location, case studies gather detailed data to identify the characteristics of a narrowly defined subject.
Rather than aiming to describe generalizable facts, case studies often focus on unusual or interesting cases that challenge assumptions, add complexity, or reveal something new about a research problem .
If you want to know more about statistics , methodology , or research bias , make sure to check out some of our other articles with explanations and examples.
- Normal distribution
- Degrees of freedom
- Null hypothesis
- Discourse analysis
- Control groups
- Mixed methods research
- Non-probability sampling
- Quantitative research
- Ecological validity
Research bias
- Rosenthal effect
- Implicit bias
- Cognitive bias
- Selection bias
- Negativity bias
- Status quo bias
Cite this Scribbr article
If you want to cite this source, you can copy and paste the citation or click the “Cite this Scribbr article” button to automatically add the citation to our free Citation Generator.
McCombes, S. (2023, June 22). Descriptive Research | Definition, Types, Methods & Examples. Scribbr. Retrieved June 19, 2024, from https://www.scribbr.com/methodology/descriptive-research/
Is this article helpful?

Shona McCombes
Other students also liked, what is quantitative research | definition, uses & methods, correlational research | when & how to use, descriptive statistics | definitions, types, examples, what is your plagiarism score.
- Skip to main content
- Skip to primary sidebar
- Skip to footer
- QuestionPro

- Solutions Industries Gaming Automotive Sports and events Education Government Travel & Hospitality Financial Services Healthcare Cannabis Technology Use Case NPS+ Communities Audience Contactless surveys Mobile LivePolls Member Experience GDPR Positive People Science 360 Feedback Surveys
- Resources Blog eBooks Survey Templates Case Studies Training Help center
Home Market Research
Descriptive Research: Definition, Characteristics, Methods + Examples

Suppose an apparel brand wants to understand the fashion purchasing trends among New York’s buyers, then it must conduct a demographic survey of the specific region, gather population data, and then conduct descriptive research on this demographic segment.
The study will then uncover details on “what is the purchasing pattern of New York buyers,” but will not cover any investigative information about “ why ” the patterns exist. Because for the apparel brand trying to break into this market, understanding the nature of their market is the study’s main goal. Let’s talk about it.
What is descriptive research?
Descriptive research is a research method describing the characteristics of the population or phenomenon studied. This descriptive methodology focuses more on the “what” of the research subject than the “why” of the research subject.
The method primarily focuses on describing the nature of a demographic segment without focusing on “why” a particular phenomenon occurs. In other words, it “describes” the research subject without covering “why” it happens.
Characteristics of descriptive research
The term descriptive research then refers to research questions, the design of the study, and data analysis conducted on that topic. We call it an observational research method because none of the research study variables are influenced in any capacity.
Some distinctive characteristics of descriptive research are:
- Quantitative research: It is a quantitative research method that attempts to collect quantifiable information for statistical analysis of the population sample. It is a popular market research tool that allows us to collect and describe the demographic segment’s nature.
- Uncontrolled variables: In it, none of the variables are influenced in any way. This uses observational methods to conduct the research. Hence, the nature of the variables or their behavior is not in the hands of the researcher.
- Cross-sectional studies: It is generally a cross-sectional study where different sections belonging to the same group are studied.
- The basis for further research: Researchers further research the data collected and analyzed from descriptive research using different research techniques. The data can also help point towards the types of research methods used for the subsequent research.
Applications of descriptive research with examples
A descriptive research method can be used in multiple ways and for various reasons. Before getting into any survey , though, the survey goals and survey design are crucial. Despite following these steps, there is no way to know if one will meet the research outcome. How to use descriptive research? To understand the end objective of research goals, below are some ways organizations currently use descriptive research today:
- Define respondent characteristics: The aim of using close-ended questions is to draw concrete conclusions about the respondents. This could be the need to derive patterns, traits, and behaviors of the respondents. It could also be to understand from a respondent their attitude, or opinion about the phenomenon. For example, understand millennials and the hours per week they spend browsing the internet. All this information helps the organization researching to make informed business decisions.
- Measure data trends: Researchers measure data trends over time with a descriptive research design’s statistical capabilities. Consider if an apparel company researches different demographics like age groups from 24-35 and 36-45 on a new range launch of autumn wear. If one of those groups doesn’t take too well to the new launch, it provides insight into what clothes are like and what is not. The brand drops the clothes and apparel that customers don’t like.
- Conduct comparisons: Organizations also use a descriptive research design to understand how different groups respond to a specific product or service. For example, an apparel brand creates a survey asking general questions that measure the brand’s image. The same study also asks demographic questions like age, income, gender, geographical location, geographic segmentation , etc. This consumer research helps the organization understand what aspects of the brand appeal to the population and what aspects do not. It also helps make product or marketing fixes or even create a new product line to cater to high-growth potential groups.
- Validate existing conditions: Researchers widely use descriptive research to help ascertain the research object’s prevailing conditions and underlying patterns. Due to the non-invasive research method and the use of quantitative observation and some aspects of qualitative observation , researchers observe each variable and conduct an in-depth analysis . Researchers also use it to validate any existing conditions that may be prevalent in a population.
- Conduct research at different times: The analysis can be conducted at different periods to ascertain any similarities or differences. This also allows any number of variables to be evaluated. For verification, studies on prevailing conditions can also be repeated to draw trends.
Advantages of descriptive research
Some of the significant advantages of descriptive research are:

- Data collection: A researcher can conduct descriptive research using specific methods like observational method, case study method, and survey method. Between these three, all primary data collection methods are covered, which provides a lot of information. This can be used for future research or even for developing a hypothesis for your research object.
- Varied: Since the data collected is qualitative and quantitative, it gives a holistic understanding of a research topic. The information is varied, diverse, and thorough.
- Natural environment: Descriptive research allows for the research to be conducted in the respondent’s natural environment, which ensures that high-quality and honest data is collected.
- Quick to perform and cheap: As the sample size is generally large in descriptive research, the data collection is quick to conduct and is inexpensive.
Descriptive research methods
There are three distinctive methods to conduct descriptive research. They are:
Observational method
The observational method is the most effective method to conduct this research, and researchers make use of both quantitative and qualitative observations.
A quantitative observation is the objective collection of data primarily focused on numbers and values. It suggests “associated with, of or depicted in terms of a quantity.” Results of quantitative observation are derived using statistical and numerical analysis methods. It implies observation of any entity associated with a numeric value such as age, shape, weight, volume, scale, etc. For example, the researcher can track if current customers will refer the brand using a simple Net Promoter Score question .
Qualitative observation doesn’t involve measurements or numbers but instead just monitoring characteristics. In this case, the researcher observes the respondents from a distance. Since the respondents are in a comfortable environment, the characteristics observed are natural and effective. In a descriptive research design, the researcher can choose to be either a complete observer, an observer as a participant, a participant as an observer, or a full participant. For example, in a supermarket, a researcher can from afar monitor and track the customers’ selection and purchasing trends. This offers a more in-depth insight into the purchasing experience of the customer.
Case study method
Case studies involve in-depth research and study of individuals or groups. Case studies lead to a hypothesis and widen a further scope of studying a phenomenon. However, case studies should not be used to determine cause and effect as they can’t make accurate predictions because there could be a bias on the researcher’s part. The other reason why case studies are not a reliable way of conducting descriptive research is that there could be an atypical respondent in the survey. Describing them leads to weak generalizations and moving away from external validity.
Survey research
In survey research, respondents answer through surveys or questionnaires or polls . They are a popular market research tool to collect feedback from respondents. A study to gather useful data should have the right survey questions. It should be a balanced mix of open-ended questions and close ended-questions . The survey method can be conducted online or offline, making it the go-to option for descriptive research where the sample size is enormous.
Examples of descriptive research
Some examples of descriptive research are:
- A specialty food group launching a new range of barbecue rubs would like to understand what flavors of rubs are favored by different people. To understand the preferred flavor palette, they conduct this type of research study using various methods like observational methods in supermarkets. By also surveying while collecting in-depth demographic information, offers insights about the preference of different markets. This can also help tailor make the rubs and spreads to various preferred meats in that demographic. Conducting this type of research helps the organization tweak their business model and amplify marketing in core markets.
- Another example of where this research can be used is if a school district wishes to evaluate teachers’ attitudes about using technology in the classroom. By conducting surveys and observing their comfortableness using technology through observational methods, the researcher can gauge what they can help understand if a full-fledged implementation can face an issue. This also helps in understanding if the students are impacted in any way with this change.
Some other research problems and research questions that can lead to descriptive research are:
- Market researchers want to observe the habits of consumers.
- A company wants to evaluate the morale of its staff.
- A school district wants to understand if students will access online lessons rather than textbooks.
- To understand if its wellness questionnaire programs enhance the overall health of the employees.
FREE TRIAL LEARN MORE
MORE LIKE THIS

QuestionPro Thrive: A Space to Visualize & Share the Future of Technology
Jun 18, 2024

Relationship NPS Fails to Understand Customer Experiences — Tuesday CX

CX Platform: Top 13 CX Platforms to Drive Customer Success
Jun 17, 2024

How to Know Whether Your Employee Initiatives are Working
Other categories.
- Academic Research
- Artificial Intelligence
- Assessments
- Brand Awareness
- Case Studies
- Communities
- Consumer Insights
- Customer effort score
- Customer Engagement
- Customer Experience
- Customer Loyalty
- Customer Research
- Customer Satisfaction
- Employee Benefits
- Employee Engagement
- Employee Retention
- Friday Five
- General Data Protection Regulation
- Insights Hub
- Life@QuestionPro
- Market Research
- Mobile diaries
- Mobile Surveys
- New Features
- Online Communities
- Question Types
- Questionnaire
- QuestionPro Products
- Release Notes
- Research Tools and Apps
- Revenue at Risk
- Survey Templates
- Training Tips
- Tuesday CX Thoughts (TCXT)
- Uncategorized
- Video Learning Series
- What’s Coming Up
- Workforce Intelligence
- What is descriptive research?
Last updated
5 February 2023
Reviewed by
Cathy Heath
Short on time? Get an AI generated summary of this article instead
Descriptive research is a common investigatory model used by researchers in various fields, including social sciences, linguistics, and academia.
Read on to understand the characteristics of descriptive research and explore its underlying techniques, processes, and procedures.
Analyze your descriptive research
Dovetail streamlines analysis to help you uncover and share actionable insights
Descriptive research is an exploratory research method. It enables researchers to precisely and methodically describe a population, circumstance, or phenomenon.
As the name suggests, descriptive research describes the characteristics of the group, situation, or phenomenon being studied without manipulating variables or testing hypotheses . This can be reported using surveys , observational studies, and case studies. You can use both quantitative and qualitative methods to compile the data.
Besides making observations and then comparing and analyzing them, descriptive studies often develop knowledge concepts and provide solutions to critical issues. It always aims to answer how the event occurred, when it occurred, where it occurred, and what the problem or phenomenon is.
- Characteristics of descriptive research
The following are some of the characteristics of descriptive research:
Quantitativeness
Descriptive research can be quantitative as it gathers quantifiable data to statistically analyze a population sample. These numbers can show patterns, connections, and trends over time and can be discovered using surveys, polls, and experiments.
Qualitativeness
Descriptive research can also be qualitative. It gives meaning and context to the numbers supplied by quantitative descriptive research .
Researchers can use tools like interviews, focus groups, and ethnographic studies to illustrate why things are what they are and help characterize the research problem. This is because it’s more explanatory than exploratory or experimental research.
Uncontrolled variables
Descriptive research differs from experimental research in that researchers cannot manipulate the variables. They are recognized, scrutinized, and quantified instead. This is one of its most prominent features.
Cross-sectional studies
Descriptive research is a cross-sectional study because it examines several areas of the same group. It involves obtaining data on multiple variables at the personal level during a certain period. It’s helpful when trying to understand a larger community’s habits or preferences.
Carried out in a natural environment
Descriptive studies are usually carried out in the participants’ everyday environment, which allows researchers to avoid influencing responders by collecting data in a natural setting. You can use online surveys or survey questions to collect data or observe.
Basis for further research
You can further dissect descriptive research’s outcomes and use them for different types of investigation. The outcomes also serve as a foundation for subsequent investigations and can guide future studies. For example, you can use the data obtained in descriptive research to help determine future research designs.
- Descriptive research methods
There are three basic approaches for gathering data in descriptive research: observational, case study, and survey.
You can use surveys to gather data in descriptive research. This involves gathering information from many people using a questionnaire and interview .
Surveys remain the dominant research tool for descriptive research design. Researchers can conduct various investigations and collect multiple types of data (quantitative and qualitative) using surveys with diverse designs.
You can conduct surveys over the phone, online, or in person. Your survey might be a brief interview or conversation with a set of prepared questions intended to obtain quick information from the primary source.
Observation
This descriptive research method involves observing and gathering data on a population or phenomena without manipulating variables. It is employed in psychology, market research , and other social science studies to track and understand human behavior.
Observation is an essential component of descriptive research. It entails gathering data and analyzing it to see whether there is a relationship between the two variables in the study. This strategy usually allows for both qualitative and quantitative data analysis.
Case studies
A case study can outline a specific topic’s traits. The topic might be a person, group, event, or organization.
It involves using a subset of a larger group as a sample to characterize the features of that larger group.
You can generalize knowledge gained from studying a case study to benefit a broader audience.
This approach entails carefully examining a particular group, person, or event over time. You can learn something new about the study topic by using a small group to better understand the dynamics of the entire group.
- Types of descriptive research
There are several types of descriptive study. The most well-known include cross-sectional studies, census surveys, sample surveys, case reports, and comparison studies.
Case reports and case series
In the healthcare and medical fields, a case report is used to explain a patient’s circumstances when suffering from an uncommon illness or displaying certain symptoms. Case reports and case series are both collections of related cases. They have aided the advancement of medical knowledge on countless occasions.
The normative component is an addition to the descriptive survey. In the descriptive–normative survey, you compare the study’s results to the norm.
Descriptive survey
This descriptive type of research employs surveys to collect information on various topics. This data aims to determine the degree to which certain conditions may be attained.
You can extrapolate or generalize the information you obtain from sample surveys to the larger group being researched.
Correlative survey
Correlative surveys help establish if there is a positive, negative, or neutral connection between two variables.
Performing census surveys involves gathering relevant data on several aspects of a given population. These units include individuals, families, organizations, objects, characteristics, and properties.
During descriptive research, you gather different degrees of interest over time from a specific population. Cross-sectional studies provide a glimpse of a phenomenon’s prevalence and features in a population. There are no ethical challenges with them and they are quite simple and inexpensive to carry out.
Comparative studies
These surveys compare the two subjects’ conditions or characteristics. The subjects may include research variables, organizations, plans, and people.
Comparison points, assumption of similarities, and criteria of comparison are three important variables that affect how well and accurately comparative studies are conducted.
For instance, descriptive research can help determine how many CEOs hold a bachelor’s degree and what proportion of low-income households receive government help.
- Pros and cons
The primary advantage of descriptive research designs is that researchers can create a reliable and beneficial database for additional study. To conduct any inquiry, you need access to reliable information sources that can give you a firm understanding of a situation.
Quantitative studies are time- and resource-intensive, so knowing the hypotheses viable for testing is crucial. The basic overview of descriptive research provides helpful hints as to which variables are worth quantitatively examining. This is why it’s employed as a precursor to quantitative research designs.
Some experts view this research as untrustworthy and unscientific. However, there is no way to assess the findings because you don’t manipulate any variables statistically.
Cause-and-effect correlations also can’t be established through descriptive investigations. Additionally, observational study findings cannot be replicated, which prevents a review of the findings and their replication.
The absence of statistical and in-depth analysis and the rather superficial character of the investigative procedure are drawbacks of this research approach.
- Descriptive research examples and applications
Several descriptive research examples are emphasized based on their types, purposes, and applications. Research questions often begin with “What is …” These studies help find solutions to practical issues in social science, physical science, and education.
Here are some examples and applications of descriptive research:
Determining consumer perception and behavior
Organizations use descriptive research designs to determine how various demographic groups react to a certain product or service.
For example, a business looking to sell to its target market should research the market’s behavior first. When researching human behavior in response to a cause or event, the researcher pays attention to the traits, actions, and responses before drawing a conclusion.
Scientific classification
Scientific descriptive research enables the classification of organisms and their traits and constituents.
Measuring data trends
A descriptive study design’s statistical capabilities allow researchers to track data trends over time. It’s frequently used to determine the study target’s current circumstances and underlying patterns.
Conduct comparison
Organizations can use a descriptive research approach to learn how various demographics react to a certain product or service. For example, you can study how the target market responds to a competitor’s product and use that information to infer their behavior.
- Bottom line
A descriptive research design is suitable for exploring certain topics and serving as a prelude to larger quantitative investigations. It provides a comprehensive understanding of the “what” of the group or thing you’re investigating.
This research type acts as the cornerstone of other research methodologies . It is distinctive because it can use quantitative and qualitative research approaches at the same time.
What is descriptive research design?
Descriptive research design aims to systematically obtain information to describe a phenomenon, situation, or population. More specifically, it helps answer the what, when, where, and how questions regarding the research problem rather than the why.
How does descriptive research compare to qualitative research?
Despite certain parallels, descriptive research concentrates on describing phenomena, while qualitative research aims to understand people better.
How do you analyze descriptive research data?
Data analysis involves using various methodologies, enabling the researcher to evaluate and provide results regarding validity and reliability.
Should you be using a customer insights hub?
Do you want to discover previous research faster?
Do you share your research findings with others?
Do you analyze research data?
Start for free today, add your research, and get to key insights faster
Editor’s picks
Last updated: 18 April 2023
Last updated: 27 February 2023
Last updated: 6 February 2023
Last updated: 15 January 2024
Last updated: 6 October 2023
Last updated: 5 February 2023
Last updated: 16 April 2023
Last updated: 7 March 2023
Last updated: 9 March 2023
Last updated: 12 December 2023
Last updated: 11 March 2024
Last updated: 13 May 2024
Latest articles
Related topics, .css-je19u9{-webkit-align-items:flex-end;-webkit-box-align:flex-end;-ms-flex-align:flex-end;align-items:flex-end;display:-webkit-box;display:-webkit-flex;display:-ms-flexbox;display:flex;-webkit-flex-direction:row;-ms-flex-direction:row;flex-direction:row;-webkit-box-flex-wrap:wrap;-webkit-flex-wrap:wrap;-ms-flex-wrap:wrap;flex-wrap:wrap;-webkit-box-pack:center;-ms-flex-pack:center;-webkit-justify-content:center;justify-content:center;row-gap:0;text-align:center;max-width:671px;}@media (max-width: 1079px){.css-je19u9{max-width:400px;}.css-je19u9>span{white-space:pre;}}@media (max-width: 799px){.css-je19u9{max-width:400px;}.css-je19u9>span{white-space:pre;}} decide what to .css-1kiodld{max-height:56px;display:-webkit-box;display:-webkit-flex;display:-ms-flexbox;display:flex;-webkit-align-items:center;-webkit-box-align:center;-ms-flex-align:center;align-items:center;}@media (max-width: 1079px){.css-1kiodld{display:none;}} build next, decide what to build next.

Users report unexpectedly high data usage, especially during streaming sessions.

Users find it hard to navigate from the home page to relevant playlists in the app.

It would be great to have a sleep timer feature, especially for bedtime listening.

I need better filters to find the songs or artists I’m looking for.
Log in or sign up
Get started for free
- Privacy Policy
Home » Descriptive Research Design – Types, Methods and Examples
Descriptive Research Design – Types, Methods and Examples
Table of Contents

Descriptive Research Design
Definition:
Descriptive research design is a type of research methodology that aims to describe or document the characteristics, behaviors, attitudes, opinions, or perceptions of a group or population being studied.
Descriptive research design does not attempt to establish cause-and-effect relationships between variables or make predictions about future outcomes. Instead, it focuses on providing a detailed and accurate representation of the data collected, which can be useful for generating hypotheses, exploring trends, and identifying patterns in the data.
Types of Descriptive Research Design
Types of Descriptive Research Design are as follows:
Cross-sectional Study
This involves collecting data at a single point in time from a sample or population to describe their characteristics or behaviors. For example, a researcher may conduct a cross-sectional study to investigate the prevalence of certain health conditions among a population, or to describe the attitudes and beliefs of a particular group.
Longitudinal Study
This involves collecting data over an extended period of time, often through repeated observations or surveys of the same group or population. Longitudinal studies can be used to track changes in attitudes, behaviors, or outcomes over time, or to investigate the effects of interventions or treatments.
This involves an in-depth examination of a single individual, group, or situation to gain a detailed understanding of its characteristics or dynamics. Case studies are often used in psychology, sociology, and business to explore complex phenomena or to generate hypotheses for further research.
Survey Research
This involves collecting data from a sample or population through standardized questionnaires or interviews. Surveys can be used to describe attitudes, opinions, behaviors, or demographic characteristics of a group, and can be conducted in person, by phone, or online.
Observational Research
This involves observing and documenting the behavior or interactions of individuals or groups in a natural or controlled setting. Observational studies can be used to describe social, cultural, or environmental phenomena, or to investigate the effects of interventions or treatments.
Correlational Research
This involves examining the relationships between two or more variables to describe their patterns or associations. Correlational studies can be used to identify potential causal relationships or to explore the strength and direction of relationships between variables.
Data Analysis Methods
Descriptive research design data analysis methods depend on the type of data collected and the research question being addressed. Here are some common methods of data analysis for descriptive research:
Descriptive Statistics
This method involves analyzing data to summarize and describe the key features of a sample or population. Descriptive statistics can include measures of central tendency (e.g., mean, median, mode) and measures of variability (e.g., range, standard deviation).
Cross-tabulation
This method involves analyzing data by creating a table that shows the frequency of two or more variables together. Cross-tabulation can help identify patterns or relationships between variables.
Content Analysis
This method involves analyzing qualitative data (e.g., text, images, audio) to identify themes, patterns, or trends. Content analysis can be used to describe the characteristics of a sample or population, or to identify factors that influence attitudes or behaviors.
Qualitative Coding
This method involves analyzing qualitative data by assigning codes to segments of data based on their meaning or content. Qualitative coding can be used to identify common themes, patterns, or categories within the data.
Visualization
This method involves creating graphs or charts to represent data visually. Visualization can help identify patterns or relationships between variables and make it easier to communicate findings to others.
Comparative Analysis
This method involves comparing data across different groups or time periods to identify similarities and differences. Comparative analysis can help describe changes in attitudes or behaviors over time or differences between subgroups within a population.
Applications of Descriptive Research Design
Descriptive research design has numerous applications in various fields. Some of the common applications of descriptive research design are:
- Market research: Descriptive research design is widely used in market research to understand consumer preferences, behavior, and attitudes. This helps companies to develop new products and services, improve marketing strategies, and increase customer satisfaction.
- Health research: Descriptive research design is used in health research to describe the prevalence and distribution of a disease or health condition in a population. This helps healthcare providers to develop prevention and treatment strategies.
- Educational research: Descriptive research design is used in educational research to describe the performance of students, schools, or educational programs. This helps educators to improve teaching methods and develop effective educational programs.
- Social science research: Descriptive research design is used in social science research to describe social phenomena such as cultural norms, values, and beliefs. This helps researchers to understand social behavior and develop effective policies.
- Public opinion research: Descriptive research design is used in public opinion research to understand the opinions and attitudes of the general public on various issues. This helps policymakers to develop effective policies that are aligned with public opinion.
- Environmental research: Descriptive research design is used in environmental research to describe the environmental conditions of a particular region or ecosystem. This helps policymakers and environmentalists to develop effective conservation and preservation strategies.
Descriptive Research Design Examples
Here are some real-time examples of descriptive research designs:
- A restaurant chain wants to understand the demographics and attitudes of its customers. They conduct a survey asking customers about their age, gender, income, frequency of visits, favorite menu items, and overall satisfaction. The survey data is analyzed using descriptive statistics and cross-tabulation to describe the characteristics of their customer base.
- A medical researcher wants to describe the prevalence and risk factors of a particular disease in a population. They conduct a cross-sectional study in which they collect data from a sample of individuals using a standardized questionnaire. The data is analyzed using descriptive statistics and cross-tabulation to identify patterns in the prevalence and risk factors of the disease.
- An education researcher wants to describe the learning outcomes of students in a particular school district. They collect test scores from a representative sample of students in the district and use descriptive statistics to calculate the mean, median, and standard deviation of the scores. They also create visualizations such as histograms and box plots to show the distribution of scores.
- A marketing team wants to understand the attitudes and behaviors of consumers towards a new product. They conduct a series of focus groups and use qualitative coding to identify common themes and patterns in the data. They also create visualizations such as word clouds to show the most frequently mentioned topics.
- An environmental scientist wants to describe the biodiversity of a particular ecosystem. They conduct an observational study in which they collect data on the species and abundance of plants and animals in the ecosystem. The data is analyzed using descriptive statistics to describe the diversity and richness of the ecosystem.
How to Conduct Descriptive Research Design
To conduct a descriptive research design, you can follow these general steps:
- Define your research question: Clearly define the research question or problem that you want to address. Your research question should be specific and focused to guide your data collection and analysis.
- Choose your research method: Select the most appropriate research method for your research question. As discussed earlier, common research methods for descriptive research include surveys, case studies, observational studies, cross-sectional studies, and longitudinal studies.
- Design your study: Plan the details of your study, including the sampling strategy, data collection methods, and data analysis plan. Determine the sample size and sampling method, decide on the data collection tools (such as questionnaires, interviews, or observations), and outline your data analysis plan.
- Collect data: Collect data from your sample or population using the data collection tools you have chosen. Ensure that you follow ethical guidelines for research and obtain informed consent from participants.
- Analyze data: Use appropriate statistical or qualitative analysis methods to analyze your data. As discussed earlier, common data analysis methods for descriptive research include descriptive statistics, cross-tabulation, content analysis, qualitative coding, visualization, and comparative analysis.
- I nterpret results: Interpret your findings in light of your research question and objectives. Identify patterns, trends, and relationships in the data, and describe the characteristics of your sample or population.
- Draw conclusions and report results: Draw conclusions based on your analysis and interpretation of the data. Report your results in a clear and concise manner, using appropriate tables, graphs, or figures to present your findings. Ensure that your report follows accepted research standards and guidelines.
When to Use Descriptive Research Design
Descriptive research design is used in situations where the researcher wants to describe a population or phenomenon in detail. It is used to gather information about the current status or condition of a group or phenomenon without making any causal inferences. Descriptive research design is useful in the following situations:
- Exploratory research: Descriptive research design is often used in exploratory research to gain an initial understanding of a phenomenon or population.
- Identifying trends: Descriptive research design can be used to identify trends or patterns in a population, such as changes in consumer behavior or attitudes over time.
- Market research: Descriptive research design is commonly used in market research to understand consumer preferences, behavior, and attitudes.
- Health research: Descriptive research design is useful in health research to describe the prevalence and distribution of a disease or health condition in a population.
- Social science research: Descriptive research design is used in social science research to describe social phenomena such as cultural norms, values, and beliefs.
- Educational research: Descriptive research design is used in educational research to describe the performance of students, schools, or educational programs.
Purpose of Descriptive Research Design
The main purpose of descriptive research design is to describe and measure the characteristics of a population or phenomenon in a systematic and objective manner. It involves collecting data that describe the current status or condition of the population or phenomenon of interest, without manipulating or altering any variables.
The purpose of descriptive research design can be summarized as follows:
- To provide an accurate description of a population or phenomenon: Descriptive research design aims to provide a comprehensive and accurate description of a population or phenomenon of interest. This can help researchers to develop a better understanding of the characteristics of the population or phenomenon.
- To identify trends and patterns: Descriptive research design can help researchers to identify trends and patterns in the data, such as changes in behavior or attitudes over time. This can be useful for making predictions and developing strategies.
- To generate hypotheses: Descriptive research design can be used to generate hypotheses or research questions that can be tested in future studies. For example, if a descriptive study finds a correlation between two variables, this could lead to the development of a hypothesis about the causal relationship between the variables.
- To establish a baseline: Descriptive research design can establish a baseline or starting point for future research. This can be useful for comparing data from different time periods or populations.
Characteristics of Descriptive Research Design
Descriptive research design has several key characteristics that distinguish it from other research designs. Some of the main characteristics of descriptive research design are:
- Objective : Descriptive research design is objective in nature, which means that it focuses on collecting factual and accurate data without any personal bias. The researcher aims to report the data objectively without any personal interpretation.
- Non-experimental: Descriptive research design is non-experimental, which means that the researcher does not manipulate any variables. The researcher simply observes and records the behavior or characteristics of the population or phenomenon of interest.
- Quantitative : Descriptive research design is quantitative in nature, which means that it involves collecting numerical data that can be analyzed using statistical techniques. This helps to provide a more precise and accurate description of the population or phenomenon.
- Cross-sectional: Descriptive research design is often cross-sectional, which means that the data is collected at a single point in time. This can be useful for understanding the current state of the population or phenomenon, but it may not provide information about changes over time.
- Large sample size: Descriptive research design typically involves a large sample size, which helps to ensure that the data is representative of the population of interest. A large sample size also helps to increase the reliability and validity of the data.
- Systematic and structured: Descriptive research design involves a systematic and structured approach to data collection, which helps to ensure that the data is accurate and reliable. This involves using standardized procedures for data collection, such as surveys, questionnaires, or observation checklists.
Advantages of Descriptive Research Design
Descriptive research design has several advantages that make it a popular choice for researchers. Some of the main advantages of descriptive research design are:
- Provides an accurate description: Descriptive research design is focused on accurately describing the characteristics of a population or phenomenon. This can help researchers to develop a better understanding of the subject of interest.
- Easy to conduct: Descriptive research design is relatively easy to conduct and requires minimal resources compared to other research designs. It can be conducted quickly and efficiently, and data can be collected through surveys, questionnaires, or observations.
- Useful for generating hypotheses: Descriptive research design can be used to generate hypotheses or research questions that can be tested in future studies. For example, if a descriptive study finds a correlation between two variables, this could lead to the development of a hypothesis about the causal relationship between the variables.
- Large sample size : Descriptive research design typically involves a large sample size, which helps to ensure that the data is representative of the population of interest. A large sample size also helps to increase the reliability and validity of the data.
- Can be used to monitor changes : Descriptive research design can be used to monitor changes over time in a population or phenomenon. This can be useful for identifying trends and patterns, and for making predictions about future behavior or attitudes.
- Can be used in a variety of fields : Descriptive research design can be used in a variety of fields, including social sciences, healthcare, business, and education.
Limitation of Descriptive Research Design
Descriptive research design also has some limitations that researchers should consider before using this design. Some of the main limitations of descriptive research design are:
- Cannot establish cause and effect: Descriptive research design cannot establish cause and effect relationships between variables. It only provides a description of the characteristics of the population or phenomenon of interest.
- Limited generalizability: The results of a descriptive study may not be generalizable to other populations or situations. This is because descriptive research design often involves a specific sample or situation, which may not be representative of the broader population.
- Potential for bias: Descriptive research design can be subject to bias, particularly if the researcher is not objective in their data collection or interpretation. This can lead to inaccurate or incomplete descriptions of the population or phenomenon of interest.
- Limited depth: Descriptive research design may provide a superficial description of the population or phenomenon of interest. It does not delve into the underlying causes or mechanisms behind the observed behavior or characteristics.
- Limited utility for theory development: Descriptive research design may not be useful for developing theories about the relationship between variables. It only provides a description of the variables themselves.
- Relies on self-report data: Descriptive research design often relies on self-report data, such as surveys or questionnaires. This type of data may be subject to biases, such as social desirability bias or recall bias.
About the author

Muhammad Hassan
Researcher, Academic Writer, Web developer
You may also like

Research Methods – Types, Examples and Guide

Qualitative Research – Methods, Analysis Types...

Basic Research – Types, Methods and Examples

Experimental Design – Types, Methods, Guide

Questionnaire – Definition, Types, and Examples

Applied Research – Types, Methods and Examples

What is Descriptive Research and How is it Used?

Introduction
What does descriptive research mean, why would you use a descriptive research design, what are the characteristics of descriptive research, examples of descriptive research, what are the data collection methods in descriptive research, how do you analyze descriptive research data, ensuring validity and reliability in the findings.
Conducting descriptive research offers researchers a way to present phenomena as they naturally occur. Rooted in an open-ended and non-experimental nature, this type of research focuses on portraying the details of specific phenomena or contexts, helping readers gain a clearer understanding of topics of interest.
From businesses gauging customer satisfaction to educators assessing classroom dynamics, the data collected from descriptive research provides invaluable insights across various fields.
This article aims to illuminate the essence, utility, characteristics, and methods associated with descriptive research, guiding those who wish to harness its potential in their respective domains.

At its core, descriptive research refers to a systematic approach used by researchers to collect, analyze, and present data about real-life phenomena to describe it in its natural context. It primarily aims to describe what exists, based on empirical observations .
Unlike experimental research, where variables are manipulated to observe outcomes, descriptive research deals with the "as-is" scenario to facilitate further research by providing a framework or new insights on which continuing studies can build.
Definition of descriptive research
Descriptive research is defined as a research method that observes and describes the characteristics of a particular group, situation, or phenomenon.
The goal is not to establish cause and effect relationships but rather to provide a detailed account of the situation.
The difference between descriptive and exploratory research
While both descriptive and exploratory research seek to provide insights into a topic or phenomenon, they differ in their focus. Exploratory research is more about investigating a topic to develop preliminary insights or to identify potential areas of interest.
In contrast, descriptive research offers detailed accounts and descriptions of the observed phenomenon, seeking to paint a full picture of what's happening.
The evolution of descriptive research in academia
Historically, descriptive research has played a foundational role in numerous academic disciplines. Anthropologists, for instance, used this approach to document cultures and societies. Psychologists have employed it to capture behaviors, emotions, and reactions.
Over time, the method has evolved, incorporating technological advancements and adapting to contemporary needs, yet its essence remains rooted in describing a phenomenon or setting as it is.

Descriptive research serves as a cornerstone in the research landscape for its ability to provide a detailed snapshot of life. Its unique qualities and methods make it an invaluable method for various research purposes. Here's why:
Benefits of obtaining a clear picture
Descriptive research captures the present state of phenomena, offering researchers a detailed reflection of situations. This unaltered representation is crucial for sectors like marketing, where understanding current consumer behavior can shape future strategies.
Facilitating data interpretation
Given its straightforward nature, descriptive research can provide data that's easier to interpret, both for researchers and their audiences. Rather than analyzing complex statistical relationships among variables, researchers present detailed descriptions of their qualitative observations . Researchers can engage in in depth analysis relating to their research question , but audiences can also draw insights from their own interpretations or reflections on potential underlying patterns.
Enhancing the clarity of the research problem
By presenting things as they are, descriptive research can help elucidate ambiguous research questions. A well-executed descriptive study can shine light on overlooked aspects of a problem, paving the way for further investigative research.
Addressing practical problems
In real-world scenarios, it's not always feasible to manipulate variables or set up controlled experiments. For instance, in social sciences, understanding cultural norms without interference is paramount. Descriptive research allows for such non-intrusive insights, ensuring genuine understanding.
Building a foundation for future research
Often, descriptive studies act as stepping stones for more complex research endeavors. By establishing baseline data and highlighting patterns, they create a platform upon which more intricate hypotheses can be built and tested in subsequent studies.

Descriptive research is distinguished by a set of hallmark characteristics that set it apart from other research methodologies . Recognizing these features can help researchers effectively design, implement , and interpret descriptive studies.
Specificity in the research question
As with all research, descriptive research starts with a well-defined research question aiming to detail a particular phenomenon. The specificity ensures that the study remains focused on gathering relevant data without unnecessary deviations.
Focus on the present situation
While some research methods aim to predict future trends or uncover historical truths, descriptive research is predominantly concerned with the present. It seeks to capture the current state of affairs, such as understanding today's consumer habits or documenting a newly observed phenomenon.
Standardized and structured methodology
To ensure credibility and consistency in results, descriptive research often employs standardized methods. Whether it's using a fixed set of survey questions or adhering to specific observation protocols, this structured approach ensures that data is collected uniformly, making it easier to compare and analyze.
Non-manipulative approach in observation
One of the standout features of descriptive research is its non-invasive nature. Researchers observe and document without influencing the research subject or the environment. This passive stance ensures that the data gathered is a genuine reflection of the phenomenon under study.
Replicability and consistency in results
Due to its structured methodology, findings from descriptive research can often be replicated in different settings or with different samples. This consistency adds to the credibility of the results, reinforcing the validity of the insights drawn from the study.

Analyze data quickly and efficiently with ATLAS.ti
Download a free trial to see how you can make sense of complex qualitative data.
Numerous fields and sectors conduct descriptive research for its versatile and detailed nature. Through its focus on presenting things as they naturally occur, it provides insights into a myriad of scenarios. Here are some tangible examples from diverse domains:
Conducting market research
Businesses often turn to data analysis through descriptive research to understand the demographics of their target market. For instance, a company launching a new product might survey potential customers to understand their age, gender, income level, and purchasing habits, offering valuable data for targeted marketing strategies.
Evaluating employee behaviors
Organizations rely on descriptive research designs to assess the behavior and attitudes of their employees. By conducting observations or surveys , companies can gather data on workplace satisfaction, collaboration patterns, or the impact of a new office layout on productivity.

Understanding consumer preferences
Brands aiming to understand their consumers' likes and dislikes often use descriptive research. By observing shopping behaviors or conducting product feedback surveys , they can gauge preferences and adjust their offerings accordingly.
Documenting historical patterns
Historians and anthropologists employ descriptive research to identify patterns through analysis of events or cultural practices. For instance, a historian might detail the daily life in a particular era, while an anthropologist might document rituals and ceremonies of a specific tribe.
Assessing student performance
Educational researchers can utilize descriptive studies to understand the effectiveness of teaching methodologies. By observing classrooms or surveying students, they can measure data trends and gauge the impact of a new teaching technique or curriculum on student engagement and performance.

Descriptive research methods aim to authentically represent situations and phenomena. These techniques ensure the collection of comprehensive and reliable data about the subject of interest.
The most appropriate descriptive research method depends on the research question and resources available for your research study.
Surveys and questionnaires
One of the most familiar tools in the researcher's arsenal, surveys and questionnaires offer a structured means of collecting data from a vast audience. Through carefully designed questions, researchers can obtain standardized responses that lend themselves to straightforward comparison and analysis in quantitative and qualitative research .
Survey research can manifest in various formats, from face-to-face interactions and telephone conversations to digital platforms. While surveys can reach a broad audience and generate quantitative data ripe for statistical analysis, they also come with the challenge of potential biases in design and rely heavily on respondent honesty.
Observations and case studies
Direct or participant observation is a method wherein researchers actively watch and document behaviors or events. A researcher might, for instance, observe the dynamics within a classroom or the behaviors of shoppers in a market setting.
Case studies provide an even deeper dive, focusing on a thorough analysis of a specific individual, group, or event. These methods present the advantage of capturing real-time, detailed data, but they might also be time-intensive and can sometimes introduce observer bias .
Interviews and focus groups
Interviews , whether they follow a structured script or flow more organically, are a powerful means to extract detailed insights directly from participants. On the other hand, focus groups gather multiple participants for discussions, aiming to gather diverse and collective opinions on a particular topic or product.
These methods offer the benefit of deep insights and adaptability in data collection . However, they necessitate skilled interviewers, and focus group settings might see individual opinions being influenced by group dynamics.
Document and content analysis
Here, instead of generating new data, researchers examine existing documents or content . This can range from studying historical records and newspapers to analyzing media content or literature.
Analyzing existing content offers the advantage of accessibility and can provide insights over longer time frames. However, the reliability and relevance of the content are paramount, and researchers must approach this method with a discerning eye.

Descriptive research data, rich in details and insights, necessitates meticulous analysis to derive meaningful conclusions. The analysis process transforms raw data into structured findings that can be communicated and acted upon.
Qualitative content analysis
For data collected through interviews , focus groups , observations , or open-ended survey questions , qualitative content analysis is a popular choice. This involves examining non-numerical data to identify patterns, themes, or categories.
By coding responses or observations , researchers can identify recurring elements, making it easier to comprehend larger data sets and draw insights.
Using descriptive statistics
When dealing with quantitative data from surveys or experiments, descriptive statistics are invaluable. Measures such as mean, median, mode, standard deviation, and frequency distributions help summarize data sets, providing a snapshot of the overall patterns.
Graphical representations like histograms, pie charts, or bar graphs can further help in visualizing these statistics.
Coding and categorizing the data
Both qualitative and quantitative data often require coding. Coding involves assigning labels to specific responses or behaviors to group similar segments of data. This categorization aids in identifying patterns, especially in vast data sets.
For instance, responses to open-ended questions in a survey can be coded based on keywords or sentiments, allowing for a more structured analysis.
Visual representation through graphs and charts
Visual aids like graphs, charts, and plots can simplify complex data, making it more accessible and understandable. Whether it's showcasing frequency distributions through histograms or mapping out relationships with networks, visual representations can elucidate trends and patterns effectively.
In the realm of research , the credibility of findings is paramount. Without trustworthiness in the results, even the most meticulously gathered data can lose its value. Two cornerstones that bolster the credibility of research outcomes are validity and reliability .
Validity: Measuring the right thing
Validity addresses the accuracy of the research. It seeks to answer the question: Is the research genuinely measuring what it aims to measure? In descriptive research, where the objective is to paint an authentic picture of the current state of affairs, ensuring validity is crucial.
For instance, if a study aims to understand consumer preferences for a product category, the questions posed should genuinely reflect those preferences and not veer into unrelated territories. Multiple forms of validity, including content, criterion, and construct validity, can be examined to ensure that the research instruments and processes are aligned with the research goals.
Reliability: Consistency in findings
Reliability, on the other hand, pertains to the consistency of the research findings. When a study demonstrates reliability, this suggests that others could repeat the study and the outcomes would remain consistent across repetitions.
In descriptive research, factors like the clarity of survey questions , the training of observers , and the standardization of interview protocols play a role in enhancing reliability. Techniques such as test-retest and internal consistency measurements can be employed to assess and improve reliability.

Make your research happen with ATLAS.ti
Analyze descriptive research with our powerful data analysis interface. Download a free trial of ATLAS.ti.

- Descriptive Research Designs: Types, Examples & Methods

One of the components of research is getting enough information about the research problem—the what, how, when and where answers, which is why descriptive research is an important type of research. It is very useful when conducting research whose aim is to identify characteristics, frequencies, trends, correlations, and categories.
This research method takes a problem with little to no relevant information and gives it a befitting description using qualitative and quantitative research method s. Descriptive research aims to accurately describe a research problem.
In the subsequent sections, we will be explaining what descriptive research means, its types, examples, and data collection methods.
What is Descriptive Research?
Descriptive research is a type of research that describes a population, situation, or phenomenon that is being studied. It focuses on answering the how, what, when, and where questions If a research problem, rather than the why.
This is mainly because it is important to have a proper understanding of what a research problem is about before investigating why it exists in the first place.
For example, an investor considering an investment in the ever-changing Amsterdam housing market needs to understand what the current state of the market is, how it changes (increasing or decreasing), and when it changes (time of the year) before asking for the why. This is where descriptive research comes in.
What Are The Types of Descriptive Research?
Descriptive research is classified into different types according to the kind of approach that is used in conducting descriptive research. The different types of descriptive research are highlighted below:
- Descriptive-survey
Descriptive survey research uses surveys to gather data about varying subjects. This data aims to know the extent to which different conditions can be obtained among these subjects.
For example, a researcher wants to determine the qualification of employed professionals in Maryland. He uses a survey as his research instrument , and each item on the survey related to qualifications is subjected to a Yes/No answer.
This way, the researcher can describe the qualifications possessed by the employed demographics of this community.
- Descriptive-normative survey
This is an extension of the descriptive survey, with the addition being the normative element. In the descriptive-normative survey, the results of the study should be compared with the norm.
For example, an organization that wishes to test the skills of its employees by a team may have them take a skills test. The skills tests are the evaluation tool in this case, and the result of this test is compared with the norm of each role.
If the score of the team is one standard deviation above the mean, it is very satisfactory, if within the mean, satisfactory, and one standard deviation below the mean is unsatisfactory.
- Descriptive-status
This is a quantitative description technique that seeks to answer questions about real-life situations. For example, a researcher researching the income of the employees in a company, and the relationship with their performance.
A survey will be carried out to gather enough data about the income of the employees, then their performance will be evaluated and compared to their income. This will help determine whether a higher income means better performance and low income means lower performance or vice versa.
- Descriptive-analysis
The descriptive-analysis method of research describes a subject by further analyzing it, which in this case involves dividing it into 2 parts. For example, the HR personnel of a company that wishes to analyze the job role of each employee of the company may divide the employees into the people that work at the Headquarters in the US and those that work from Oslo, Norway office.
A questionnaire is devised to analyze the job role of employees with similar salaries and who work in similar positions.
- Descriptive classification
This method is employed in biological sciences for the classification of plants and animals. A researcher who wishes to classify the sea animals into different species will collect samples from various search stations, then classify them accordingly.
- Descriptive-comparative
In descriptive-comparative research, the researcher considers 2 variables that are not manipulated, and establish a formal procedure to conclude that one is better than the other. For example, an examination body wants to determine the better method of conducting tests between paper-based and computer-based tests.
A random sample of potential participants of the test may be asked to use the 2 different methods, and factors like failure rates, time factors, and others will be evaluated to arrive at the best method.
- Correlative Survey
Correlative surveys are used to determine whether the relationship between 2 variables is positive, negative, or neutral. That is, if 2 variables say X and Y are directly proportional, inversely proportional or are not related to each other.
Examples of Descriptive Research
There are different examples of descriptive research, that may be highlighted from its types, uses, and applications. However, we will be restricting ourselves to only 3 distinct examples in this article.
- Comparing Student Performance:
An academic institution may wish 2 compare the performance of its junior high school students in English language and Mathematics. This may be used to classify students based on 2 major groups, with one group going ahead to study while courses, while the other study courses in the Arts & Humanities field.
Students who are more proficient in mathematics will be encouraged to go into STEM and vice versa. Institutions may also use this data to identify students’ weak points and work on ways to assist them.
- Scientific Classification
During the major scientific classification of plants, animals, and periodic table elements, the characteristics and components of each subject are evaluated and used to determine how they are classified.
For example, living things may be classified into kingdom Plantae or kingdom animal is depending on their nature. Further classification may group animals into mammals, pieces, vertebrae, invertebrae, etc.
All these classifications are made a result of descriptive research which describes what they are.
- Human Behavior
When studying human behaviour based on a factor or event, the researcher observes the characteristics, behaviour, and reaction, then use it to conclude. A company willing to sell to its target market needs to first study the behaviour of the market.
This may be done by observing how its target reacts to a competitor’s product, then use it to determine their behaviour.
What are the Characteristics of Descriptive Research?
The characteristics of descriptive research can be highlighted from its definition, applications, data collection methods, and examples. Some characteristics of descriptive research are:
- Quantitativeness
Descriptive research uses a quantitative research method by collecting quantifiable information to be used for statistical analysis of the population sample. This is very common when dealing with research in the physical sciences.
- Qualitativeness
It can also be carried out using the qualitative research method, to properly describe the research problem. This is because descriptive research is more explanatory than exploratory or experimental.
- Uncontrolled variables
In descriptive research, researchers cannot control the variables like they do in experimental research.
- The basis for further research
The results of descriptive research can be further analyzed and used in other research methods. It can also inform the next line of research, including the research method that should be used.
This is because it provides basic information about the research problem, which may give birth to other questions like why a particular thing is the way it is.
Why Use Descriptive Research Design?
Descriptive research can be used to investigate the background of a research problem and get the required information needed to carry out further research. It is used in multiple ways by different organizations, and especially when getting the required information about their target audience.
- Define subject characteristics :
It is used to determine the characteristics of the subjects, including their traits, behaviour, opinion, etc. This information may be gathered with the use of surveys, which are shared with the respondents who in this case, are the research subjects.
For example, a survey evaluating the number of hours millennials in a community spends on the internet weekly, will help a service provider make informed business decisions regarding the market potential of the community.
- Measure Data Trends
It helps to measure the changes in data over some time through statistical methods. Consider the case of individuals who want to invest in stock markets, so they evaluate the changes in prices of the available stocks to make a decision investment decision.
Brokerage companies are however the ones who carry out the descriptive research process, while individuals can view the data trends and make decisions.
Descriptive research is also used to compare how different demographics respond to certain variables. For example, an organization may study how people with different income levels react to the launch of a new Apple phone.
This kind of research may take a survey that will help determine which group of individuals are purchasing the new Apple phone. Do the low-income earners also purchase the phone, or only the high-income earners do?
Further research using another technique will explain why low-income earners are purchasing the phone even though they can barely afford it. This will help inform strategies that will lure other low-income earners and increase company sales.
- Validate existing conditions
When you are not sure about the validity of an existing condition, you can use descriptive research to ascertain the underlying patterns of the research object. This is because descriptive research methods make an in-depth analysis of each variable before making conclusions.
- Conducted Overtime
Descriptive research is conducted over some time to ascertain the changes observed at each point in time. The higher the number of times it is conducted, the more authentic the conclusion will be.
What are the Disadvantages of Descriptive Research?
- Response and Non-response Bias
Respondents may either decide not to respond to questions or give incorrect responses if they feel the questions are too confidential. When researchers use observational methods, respondents may also decide to behave in a particular manner because they feel they are being watched.
- The researcher may decide to influence the result of the research due to personal opinion or bias towards a particular subject. For example, a stockbroker who also has a business of his own may try to lure investors into investing in his own company by manipulating results.
- A case-study or sample taken from a large population is not representative of the whole population.
- Limited scope:The scope of descriptive research is limited to the what of research, with no information on why thereby limiting the scope of the research.
What are the Data Collection Methods in Descriptive Research?
There are 3 main data collection methods in descriptive research, namely; observational method, case study method, and survey research.
1. Observational Method
The observational method allows researchers to collect data based on their view of the behaviour and characteristics of the respondent, with the respondents themselves not directly having an input. It is often used in market research, psychology, and some other social science research to understand human behaviour.
It is also an important aspect of physical scientific research, with it being one of the most effective methods of conducting descriptive research . This process can be said to be either quantitative or qualitative.
Quantitative observation involved the objective collection of numerical data , whose results can be analyzed using numerical and statistical methods.
Qualitative observation, on the other hand, involves the monitoring of characteristics and not the measurement of numbers. The researcher makes his observation from a distance, records it, and is used to inform conclusions.
2. Case Study Method
A case study is a sample group (an individual, a group of people, organizations, events, etc.) whose characteristics are used to describe the characteristics of a larger group in which the case study is a subgroup. The information gathered from investigating a case study may be generalized to serve the larger group.
This generalization, may, however, be risky because case studies are not sufficient to make accurate predictions about larger groups. Case studies are a poor case of generalization.
3. Survey Research
This is a very popular data collection method in research designs. In survey research, researchers create a survey or questionnaire and distribute it to respondents who give answers.
Generally, it is used to obtain quick information directly from the primary source and also conducting rigorous quantitative and qualitative research. In some cases, survey research uses a blend of both qualitative and quantitative strategies.
Survey research can be carried out both online and offline using the following methods
- Online Surveys: This is a cheap method of carrying out surveys and getting enough responses. It can be carried out using Formplus, an online survey builder. Formplus has amazing tools and features that will help increase response rates.
- Offline Surveys: This includes paper forms, mobile offline forms , and SMS-based forms.
What Are The Differences Between Descriptive and Correlational Research?
Before going into the differences between descriptive and correlation research, we need to have a proper understanding of what correlation research is about. Therefore, we will be giving a summary of the correlation research below.
Correlational research is a type of descriptive research, which is used to measure the relationship between 2 variables, with the researcher having no control over them. It aims to find whether there is; positive correlation (both variables change in the same direction), negative correlation (the variables change in the opposite direction), or zero correlation (there is no relationship between the variables).
Correlational research may be used in 2 situations;
(i) when trying to find out if there is a relationship between two variables, and
(ii) when a causal relationship is suspected between two variables, but it is impractical or unethical to conduct experimental research that manipulates one of the variables.
Below are some of the differences between correlational and descriptive research:
- Definitions :
Descriptive research aims is a type of research that provides an in-depth understanding of the study population, while correlational research is the type of research that measures the relationship between 2 variables.
- Characteristics :
Descriptive research provides descriptive data explaining what the research subject is about, while correlation research explores the relationship between data and not their description.
- Predictions :
Predictions cannot be made in descriptive research while correlation research accommodates the possibility of making predictions.
Descriptive Research vs. Causal Research
Descriptive research and causal research are both research methodologies, however, one focuses on a subject’s behaviors while the latter focuses on a relationship’s cause-and-effect. To buttress the above point, descriptive research aims to describe and document the characteristics, behaviors, or phenomena of a particular or specific population or situation.
It focuses on providing an accurate and detailed account of an already existing state of affairs between variables. Descriptive research answers the questions of “what,” “where,” “when,” and “how” without attempting to establish any causal relationships or explain any underlying factors that might have caused the behavior.
Causal research, on the other hand, seeks to determine cause-and-effect relationships between variables. It aims to point out the factors that influence or cause a particular result or behavior. Causal research involves manipulating variables, controlling conditions or a subgroup, and observing the resulting effects. The primary objective of causal research is to establish a cause-effect relationship and provide insights into why certain phenomena happen the way they do.
Descriptive Research vs. Analytical Research
Descriptive research provides a detailed and comprehensive account of a specific situation or phenomenon. It focuses on describing and summarizing data without making inferences or attempting to explain underlying factors or the cause of the factor.
It is primarily concerned with providing an accurate and objective representation of the subject of research. While analytical research goes beyond the description of the phenomena and seeks to analyze and interpret data to discover if there are patterns, relationships, or any underlying factors.
It examines the data critically, applies statistical techniques or other analytical methods, and draws conclusions based on the discovery. Analytical research also aims to explore the relationships between variables and understand the underlying mechanisms or processes involved.
Descriptive Research vs. Exploratory Research
Descriptive research is a research method that focuses on providing a detailed and accurate account of a specific situation, group, or phenomenon. This type of research describes the characteristics, behaviors, or relationships within the given context without looking for an underlying cause.
Descriptive research typically involves collecting and analyzing quantitative or qualitative data to generate descriptive statistics or narratives. Exploratory research differs from descriptive research because it aims to explore and gain firsthand insights or knowledge into a relatively unexplored or poorly understood topic.
It focuses on generating ideas, hypotheses, or theories rather than providing definitive answers. Exploratory research is often conducted at the early stages of a research project to gather preliminary information and identify key variables or factors for further investigation. It involves open-ended interviews, observations, or small-scale surveys to gather qualitative data.
Read More – Exploratory Research: What are its Method & Examples?
Descriptive Research vs. Experimental Research
Descriptive research aims to describe and document the characteristics, behaviors, or phenomena of a particular population or situation. It focuses on providing an accurate and detailed account of the existing state of affairs.
Descriptive research typically involves collecting data through surveys, observations, or existing records and analyzing the data to generate descriptive statistics or narratives. It does not involve manipulating variables or establishing cause-and-effect relationships.
Experimental research, on the other hand, involves manipulating variables and controlling conditions to investigate cause-and-effect relationships. It aims to establish causal relationships by introducing an intervention or treatment and observing the resulting effects.
Experimental research typically involves randomly assigning participants to different groups, such as control and experimental groups, and measuring the outcomes. It allows researchers to control for confounding variables and draw causal conclusions.
Related – Experimental vs Non-Experimental Research: 15 Key Differences
Descriptive Research vs. Explanatory Research
Descriptive research focuses on providing a detailed and accurate account of a specific situation, group, or phenomenon. It aims to describe the characteristics, behaviors, or relationships within the given context.
Descriptive research is primarily concerned with providing an objective representation of the subject of study without explaining underlying causes or mechanisms. Explanatory research seeks to explain the relationships between variables and uncover the underlying causes or mechanisms.
It goes beyond description and aims to understand the reasons or factors that influence a particular outcome or behavior. Explanatory research involves analyzing data, conducting statistical analyses, and developing theories or models to explain the observed relationships.
Descriptive Research vs. Inferential Research
Descriptive research focuses on describing and summarizing data without making inferences or generalizations beyond the specific sample or population being studied. It aims to provide an accurate and objective representation of the subject of study.
Descriptive research typically involves analyzing data to generate descriptive statistics, such as means, frequencies, or percentages, to describe the characteristics or behaviors observed.
Inferential research, however, involves making inferences or generalizations about a larger population based on a smaller sample.
It aims to draw conclusions about the population characteristics or relationships by analyzing the sample data. Inferential research uses statistical techniques to estimate population parameters, test hypotheses, and determine the level of confidence or significance in the findings.
Related – Inferential Statistics: Definition, Types + Examples
Conclusion
The uniqueness of descriptive research partly lies in its ability to explore both quantitative and qualitative research methods. Therefore, when conducting descriptive research, researchers have the opportunity to use a wide variety of techniques that aids the research process.
Descriptive research explores research problems in-depth, beyond the surface level thereby giving a detailed description of the research subject. That way, it can aid further research in the field, including other research methods .
It is also very useful in solving real-life problems in various fields of social science, physical science, and education.
Connect to Formplus, Get Started Now - It's Free!
- descriptive research
- descriptive research method
- example of descriptive research
- types of descriptive research
- busayo.longe
You may also like:
Acceptance Sampling: Meaning, Examples, When to Use
In this post, we will discuss extensively what acceptance sampling is and when it is applied.
Extrapolation in Statistical Research: Definition, Examples, Types, Applications
In this article we’ll look at the different types and characteristics of extrapolation, plus how it contrasts to interpolation.
Cross-Sectional Studies: Types, Pros, Cons & Uses
In this article, we’ll look at what cross-sectional studies are, how it applies to your research and how to use Formplus to collect...
Type I vs Type II Errors: Causes, Examples & Prevention
This article will discuss the two different types of errors in hypothesis testing and how you can prevent them from occurring in your research
Formplus - For Seamless Data Collection
Collect data the right way with a versatile data collection tool. try formplus and transform your work productivity today..
Have a language expert improve your writing
Run a free plagiarism check in 10 minutes, automatically generate references for free.
- Knowledge Base
- Methodology
- Descriptive Research Design | Definition, Methods & Examples
Descriptive Research Design | Definition, Methods & Examples
Published on 5 May 2022 by Shona McCombes . Revised on 10 October 2022.
Descriptive research aims to accurately and systematically describe a population, situation or phenomenon. It can answer what , where , when , and how questions , but not why questions.
A descriptive research design can use a wide variety of research methods to investigate one or more variables . Unlike in experimental research , the researcher does not control or manipulate any of the variables, but only observes and measures them.
Table of contents
When to use a descriptive research design, descriptive research methods.
Descriptive research is an appropriate choice when the research aim is to identify characteristics, frequencies, trends, and categories.
It is useful when not much is known yet about the topic or problem. Before you can research why something happens, you need to understand how, when, and where it happens.
- How has the London housing market changed over the past 20 years?
- Do customers of company X prefer product Y or product Z?
- What are the main genetic, behavioural, and morphological differences between European wildcats and domestic cats?
- What are the most popular online news sources among under-18s?
- How prevalent is disease A in population B?
Prevent plagiarism, run a free check.
Descriptive research is usually defined as a type of quantitative research , though qualitative research can also be used for descriptive purposes. The research design should be carefully developed to ensure that the results are valid and reliable .
Survey research allows you to gather large volumes of data that can be analysed for frequencies, averages, and patterns. Common uses of surveys include:
- Describing the demographics of a country or region
- Gauging public opinion on political and social topics
- Evaluating satisfaction with a company’s products or an organisation’s services
Observations
Observations allow you to gather data on behaviours and phenomena without having to rely on the honesty and accuracy of respondents. This method is often used by psychological, social, and market researchers to understand how people act in real-life situations.
Observation of physical entities and phenomena is also an important part of research in the natural sciences. Before you can develop testable hypotheses , models, or theories, it’s necessary to observe and systematically describe the subject under investigation.
Case studies
A case study can be used to describe the characteristics of a specific subject (such as a person, group, event, or organisation). Instead of gathering a large volume of data to identify patterns across time or location, case studies gather detailed data to identify the characteristics of a narrowly defined subject.
Rather than aiming to describe generalisable facts, case studies often focus on unusual or interesting cases that challenge assumptions, add complexity, or reveal something new about a research problem .
Cite this Scribbr article
If you want to cite this source, you can copy and paste the citation or click the ‘Cite this Scribbr article’ button to automatically add the citation to our free Reference Generator.
McCombes, S. (2022, October 10). Descriptive Research Design | Definition, Methods & Examples. Scribbr. Retrieved 18 June 2024, from https://www.scribbr.co.uk/research-methods/descriptive-research-design/
Is this article helpful?
Shona McCombes
Other students also liked, a quick guide to experimental design | 5 steps & examples, correlational research | guide, design & examples, qualitative vs quantitative research | examples & methods.
Child Care and Early Education Research Connections
Descriptive research studies.
Descriptive research is a type of research that is used to describe the characteristics of a population. It collects data that are used to answer a wide range of what, when, and how questions pertaining to a particular population or group. For example, descriptive studies might be used to answer questions such as: What percentage of Head Start teachers have a bachelor's degree or higher? What is the average reading ability of 5-year-olds when they first enter kindergarten? What kinds of math activities are used in early childhood programs? When do children first receive regular child care from someone other than their parents? When are children with developmental disabilities first diagnosed and when do they first receive services? What factors do programs consider when making decisions about the type of assessments that will be used to assess the skills of the children in their programs? How do the types of services children receive from their early childhood program change as children age?
Descriptive research does not answer questions about why a certain phenomenon occurs or what the causes are. Answers to such questions are best obtained from randomized and quasi-experimental studies . However, data from descriptive studies can be used to examine the relationships (correlations) among variables. While the findings from correlational analyses are not evidence of causality, they can help to distinguish variables that may be important in explaining a phenomenon from those that are not. Thus, descriptive research is often used to generate hypotheses that should be tested using more rigorous designs.
A variety of data collection methods may be used alone or in combination to answer the types of questions guiding descriptive research. Some of the more common methods include surveys, interviews, observations, case studies, and portfolios. The data collected through these methods can be either quantitative or qualitative. Quantitative data are typically analyzed and presenting using descriptive statistics . Using quantitative data, researchers may describe the characteristics of a sample or population in terms of percentages (e.g., percentage of population that belong to different racial/ethnic groups, percentage of low-income families that receive different government services) or averages (e.g., average household income, average scores of reading, mathematics and language assessments). Quantitative data, such as narrative data collected as part of a case study, may be used to organize, classify, and used to identify patterns of behaviors, attitudes, and other characteristics of groups.
Descriptive studies have an important role in early care and education research. Studies such as the National Survey of Early Care and Education and the National Household Education Surveys Program have greatly increased our knowledge of the supply of and demand for child care in the U.S. The Head Start Family and Child Experiences Survey and the Early Childhood Longitudinal Study Program have provided researchers, policy makers and practitioners with rich information about school readiness skills of children in the U.S.
Each of the methods used to collect descriptive data have their own strengths and limitations. The following are some of the strengths and limitations of descriptive research studies in general.
Study participants are questioned or observed in a natural setting (e.g., their homes, child care or educational settings).
Study data can be used to identify the prevalence of particular problems and the need for new or additional services to address these problems.
Descriptive research may identify areas in need of additional research and relationships between variables that require future study. Descriptive research is often referred to as "hypothesis generating research."
Depending on the data collection method used, descriptive studies can generate rich datasets on large and diverse samples.
Limitations:
Descriptive studies cannot be used to establish cause and effect relationships.
Respondents may not be truthful when answering survey questions or may give socially desirable responses.
The choice and wording of questions on a questionnaire may influence the descriptive findings.
Depending on the type and size of sample, the findings may not be generalizable or produce an accurate description of the population of interest.
Using Science to Inform Educational Practices
Descriptive Research
There are many research methods available to psychologists in their efforts to understand, describe, and explain behavior. Some methods rely on observational techniques. Other approaches involve interactions between the researcher and the individuals who are being studied—ranging from a series of simple questions to extensive, in-depth interviews—to well-controlled experiments. The main categories of psychological research are descriptive, correlational, and experimental research. Each of these research methods has unique strengths and weaknesses, and each method may only be appropriate for certain types of research questions.
Research studies that do not test specific relationships between variables are called descriptive studies . For this method, the research question or hypothesis can be about a single variable (e.g., How accurate are people’s first impressions?) or can be a broad and exploratory question (e.g., What is it like to be a working mother diagnosed with depression?). The variable of the study is measured and reported without any further relationship analysis. A researcher might choose this method if they only needed to report information, such as a tally, an average, or a list of responses. Descriptive research can answer interesting and important questions, but what it cannot do is answer questions about relationships between variables.
Video 2.4.1. Descriptive Research Design provides explanation and examples for quantitative descriptive research. A closed-captioned version of this video is available here .
Descriptive research is distinct from correlational research , in which researchers formally test whether a relationship exists between two or more variables. Experimental research goes a step further beyond descriptive and correlational research and randomly assigns people to different conditions, using hypothesis testing to make inferences about causal relationships between variables. We will discuss each of these methods more in-depth later.
Table 2.4.1. Comparison of research design methods
| Research design | Goal | Advantages | Disadvantages |
|---|---|---|---|
| Descriptive | To create a snapshot of the current state of affairs | Provides a relatively complete picture of what is occurring at a given time. Allows the development of questions for further study. | Does not assess relationships among variables. Maybe unethical if participants do not know they are being observed. |
| Correlational | To assess the relationships between and among two or more variables | Allows testing of expected relationships between and among variables and the making of predictions. Can assess these relationships in everyday life events. | Cannot be used to draw inferences about the causal relationships between and among the variables. |
| Experimental | To assess the causal impact of one or more experimental manipulations on a dependent variable | Allows drawing conclusions about the causal relationships among variables. | Cannot experimentally manipulate many important variables. May be expensive and time-consuming. |
| Stangor, 2011. | |||
Candela Citations
- Descriptive Research. Authored by : Nicole Arduini-Van Hoose. Provided by : Hudson Valley Community College. Retrieved from : https://courses.lumenlearning.com/edpsy/chapter/descriptive-research/. License : CC BY-NC-SA: Attribution-NonCommercial-ShareAlike
- Descriptive Research. Authored by : Nicole Arduini-Van Hoose. Provided by : Hudson Valley Community College. Retrieved from : https://courses.lumenlearning.com/adolescent/chapter/descriptive-research/. License : CC BY-NC-SA: Attribution-NonCommercial-ShareAlike
Educational Psychology Copyright © 2020 by Nicole Arduini-Van Hoose is licensed under a Creative Commons Attribution-NonCommercial-ShareAlike 4.0 International License , except where otherwise noted.
Share This Book
Just one more step to your free trial.
.surveysparrow.com
Already using SurveySparrow? Login
By clicking on "Get Started", I agree to the Privacy Policy and Terms of Service .
This site is protected by reCAPTCHA and the Google Privacy Policy and Terms of Service apply.
Enterprise Survey Software
Enterprise Survey Software to thrive in your business ecosystem
NPS® Software
Turn customers into promoters
Offline Survey
Real-time data collection, on the move. Go internet-independent.
360 Assessment
Conduct omnidirectional employee assessments. Increase productivity, grow together.
Reputation Management
Turn your existing customers into raving promoters by monitoring online reviews.
Ticket Management
Build loyalty and advocacy by delivering personalized support experiences that matter.
Chatbot for Website
Collect feedback smartly from your website visitors with the engaging Chatbot for website.
Swift, easy, secure. Scalable for your organization.
Executive Dashboard
Customer journey map, craft beautiful surveys, share surveys, gain rich insights, recurring surveys, white label surveys, embedded surveys, conversational forms, mobile-first surveys, audience management, smart surveys, video surveys, secure surveys, api, webhooks, integrations, survey themes, accept payments, custom workflows, all features, customer experience, employee experience, product experience, marketing experience, sales experience, hospitality & travel, market research, saas startup programs, wall of love, success stories, sparrowcast, nps® benchmarks, learning centre, apps & integrations, testimonials.
Our surveys come with superpowers ⚡
Blog General
Descriptive Research 101: Definition, Methods and Examples
Parvathi vijayamohan.
Last Updated:
5 June 2024
Table Of Contents
- Descriptive Research 101: The Definitive Guide
What is Descriptive Research?
Key characteristics of descriptive research.
- Descriptive Research Methods: The 3 You Need to Know!
Observation
Case studies, 7 types of descriptive research, descriptive research: examples to build your next study, tips to excel at descriptive research.
Imagine you are a detective called to a crime scene. Your job is to study the scene and report whatever you find: whether that’s the half-smoked cigarette on the table or the large “RACHE” written in blood on the wall. That, in a nutshell, is descriptive research .
Researchers often need to do descriptive research on a problem before they attempt to solve it. So in this guide, we’ll take you through:
- What is descriptive research + characteristics
- Descriptive research methods
- Types of descriptive research
- Descriptive research examples
- Tips to excel at the descriptive method
Click to jump to the section that interests you.
Definition: As its name says, descriptive research describes the characteristics of the problem, phenomenon, situation, or group under study.
So the goal of all descriptive studies is to explore the background, details, and existing patterns in the problem to fully understand it. In other words, preliminary research.
However, descriptive research can be both preliminary and conclusive . You can use the data from a descriptive study to make reports and get insights for further planning.
What descriptive research isn’t: Descriptive research finds the what/when/where of a problem, not the why/how .
Because of this, we can’t use the descriptive method to explore cause-and-effect relationships where one variable (like a person’s job role) affects another variable (like their monthly income).
- Answers the “what,” “when,” and “where” of a research problem. For this reason, it is popularly used in market research , awareness surveys , and opinion polls .
- Sets the stage for a research problem. As an early part of the research process, descriptive studies help you dive deeper into the topic.
- Opens the door for further research. You can use descriptive data as the basis for more profound research, analysis and studies.
- Qualitative and quantitative . It is possible to get a balanced mix of numerical responses and open-ended answers from the descriptive method.
- No control or interference with the variables . The researcher simply observes and reports on them. However, specific research software has filters that allow her to zoom in on one variable.
- Done in natural settings . You can get the best results from descriptive research by talking to people, surveying them, or observing them in a suitable environment. For example, suppose you are a website beta testing an app feature. In that case, descriptive research invites users to try the feature, tracking their behavior and then asking their opinions .
- Can be applied to many research methods and areas. Examples include healthcare, SaaS, psychology, political studies, education, and pop culture.
Descriptive Research Methods: The Top Three You Need to Know!
In short, survey research is a brief interview or conversation with a set of prepared questions about a topic.
So you create a questionnaire, share it, and analyze the data you collect for further action. Learn about the differences between surveys and questionnaires here .
You can access free survey templates , over 20+ question types, and pass data to 1,500+ applications with survey software, like SurveySparrow . It enables you to create surveys, share them and capture data with very little effort.
Sign up today to launch stunning surveys for free.
Please enter a valid Email ID.
14-Day Free Trial • No Credit Card Required • No Strings Attached
- Surveys can be hyper-local, regional, or global, depending on your objectives.
- Share surveys in-person, offline, via SMS, email, or QR codes – so many options!
- Easy to automate if you want to conduct many surveys over a period.
The observational method is a type of descriptive research in which you, the researcher, observe ongoing behavior.
Now, there are several (non-creepy) ways you can observe someone. In fact, observational research has three main approaches:
- Covert observation: In true spy fashion, the researcher mixes in with the group undetected or observes from a distance.
- Overt observation : The researcher identifies himself as a researcher – “The name’s Bond. J. Bond.” – and explains the purpose of the study.
- Participatory observation : The researcher participates in what he is observing to understand his topic better.
- Observation is one of the most accurate ways to get data on a subject’s behavior in a natural setting.
- You don’t need to rely on people’s willingness to share information.
- Observation is a universal method that can be applied to any area of research.
In the case study method, you do a detailed study of a specific group, person, or event over a period.
This brings us to a frequently asked question: “What’s the difference between case studies and longitudinal studies?”
A case study will go very in-depth into the subject with one-on-one interviews, observations, and archival research. They are also qualitative, though sometimes they will use numbers and stats.
An example of longitudinal research would be a study of the health of night shift employees vs. general shift employees over a decade. An example of a case study would involve in-depth interviews with Casey, an assistant director of nursing who’s handled the night shift at the hospital for ten years now.
- Due to the focus on a few people, case studies can give you a tremendous amount of information.
- Because of the time and effort involved, a case study engages both researchers and participants.
- Case studies are helpful for ethically investigating unusual, complex, or challenging subjects. An example would be a study of the habits of long-term cocaine users.
| Cross-sectional research | Studies a particular group of people or their sections at a given point in time. Example: current social attitudes of Gen Z in the US |
| Longitudinal research | Studies a group of people over a long period of time. Example: tracking changes in social attitudes among Gen-Zers from 2022 – 2032. |
| Normative research | Compares the results of a study against the existing norms. Example: comparing a verdict in a legal case against similar cases. |
| Correlational/relational research | Investigates the type of relationship and patterns between 2 variables. Example: music genres and mental states. |
| Comparative research | Compares 2 or more similar people, groups or conditions based on specific traits. Example: job roles of employees in similar positions from two different companies. |
| Classification research | Arranges the data into classes according to certain criteria for better analysis. Example: the classification of newly discovered insects into species. |
| Archival research | Searching for and extracting information from past records. Example: Tracking US Census data over the decades. |
1. Case Study: Airbnb’s Growth Strategy
In an excellent case study, Tam Al Saad, Principal Consultant, Strategy + Growth at Webprofits, deep dives into how Airbnb attracted and retained 150 million users .
“What Airbnb offers isn’t a cheap place to sleep when you’re on holiday; it’s the opportunity to experience your destination as a local would. It’s the chance to meet the locals, experience the markets, and find non-touristy places.
Sure, you can visit the Louvre, see Buckingham Palace, and climb the Empire State Building, but you can do it as if it were your hometown while staying in a place that has character and feels like a home.” – Tam al Saad, Principal Consultant, Strategy + Growth at Webprofits
2. Observation – Better Tech Experiences for the Elderly
We often think that our elders are so hopeless with technology. But we’re not getting any younger either, and tech is changing at a hair trigger! This article by Annemieke Hendricks shares a wonderful example where researchers compare the levels of technological familiarity between age groups and how that influences usage.
“It is generally assumed that older adults have difficulty using modern electronic devices, such as mobile telephones or computers. Because this age group is growing in most countries, changing products and processes to adapt to their needs is increasingly more important. “ – Annemieke Hendricks, Marketing Communication Specialist, Noldus
3. Surveys – Decoding Sleep with SurveySparrow
SRI International (formerly Stanford Research Institute) – an independent, non-profit research center – wanted to investigate the impact of stress on an adolescent’s sleep. To get those insights, two actions were essential: tracking sleep patterns through wearable devices and sending surveys at a pre-set time – the pre-sleep period.
“With SurveySparrow’s recurring surveys feature, SRI was able to share engaging surveys with their participants exactly at the time they wanted and at the frequency they preferred.”
Read more about this project : How SRI International decoded sleep patterns with SurveySparrow
1: Answer the six Ws –
- Who should we consider?
- What information do we need?
- When should we collect the information?
- Where should we collect the information?
- Why are we obtaining the information?
- Way to collect the information
#2: Introduce and explain your methodological approach
#3: Describe your methods of data collection and/or selection.
#4: Describe your methods of analysis.
#5: Explain the reasoning behind your choices.
#6: Collect data.
#7: Analyze the data. Use software to speed up the process and reduce overthinking and human error.
#8: Report your conclusions and how you drew the results.
Growth Marketer at SurveySparrow
Fledgling growth marketer. Cloud watcher. Aunty to a naughty beagle.
You Might Also Like
Want to expand your business outreach here’s how (in 5 steps), 20 cold email templates to increase lead generation in 2024, thank you for your feedback: 20 gracious responses for customers and colleagues, see it to believe it..
14-Day Free Trial • Cancel Anytime • No Credit Card Required • Need a Demo?
Start your free trial today
No Credit Card Required. 14-Day Free Trial
Request a Demo
Want to learn more about SurveySparrow? We'll be in touch soon!
Scale up your descriptive research with the best survey software
Build surveys that actually work. give surveysparrow a free try today.
14-Day Free Trial • No Credit card required • 40% more completion rate
Hi there, we use cookies to offer you a better browsing experience and to analyze site traffic. By continuing to use our website, you consent to the use of these cookies. Learn More

An official website of the United States government
The .gov means it’s official. Federal government websites often end in .gov or .mil. Before sharing sensitive information, make sure you’re on a federal government site.
The site is secure. The https:// ensures that you are connecting to the official website and that any information you provide is encrypted and transmitted securely.
- Publications
- Account settings
Preview improvements coming to the PMC website in October 2024. Learn More or Try it out now .
- Advanced Search
- Journal List
- HHS Author Manuscripts
Characteristics of Qualitative Descriptive Studies: A Systematic Review
MSN, CRNP, Doctoral Candidate, University of Pennsylvania School of Nursing
Justine S. Sefcik
MS, RN, Doctoral Candidate, University of Pennsylvania School of Nursing
Christine Bradway
PhD, CRNP, FAAN, Associate Professor of Gerontological Nursing, University of Pennsylvania School of Nursing
Qualitative description (QD) is a term that is widely used to describe qualitative studies of health care and nursing-related phenomena. However, limited discussions regarding QD are found in the existing literature. In this systematic review, we identified characteristics of methods and findings reported in research articles published in 2014 whose authors identified the work as QD. After searching and screening, data were extracted from the sample of 55 QD articles and examined to characterize research objectives, design justification, theoretical/philosophical frameworks, sampling and sample size, data collection and sources, data analysis, and presentation of findings. In this review, three primary findings were identified. First, despite inconsistencies, most articles included characteristics consistent with limited, available QD definitions and descriptions. Next, flexibility or variability of methods was common and desirable for obtaining rich data and achieving understanding of a phenomenon. Finally, justification for how a QD approach was chosen and why it would be an appropriate fit for a particular study was limited in the sample and, therefore, in need of increased attention. Based on these findings, recommendations include encouragement to researchers to provide as many details as possible regarding the methods of their QD study so that readers can determine whether the methods used were reasonable and effective in producing useful findings.
Qualitative description (QD) is a label used in qualitative research for studies which are descriptive in nature, particularly for examining health care and nursing-related phenomena ( Polit & Beck, 2009 , 2014 ). QD is a widely cited research tradition and has been identified as important and appropriate for research questions focused on discovering the who, what, and where of events or experiences and gaining insights from informants regarding a poorly understood phenomenon. It is also the label of choice when a straight description of a phenomenon is desired or information is sought to develop and refine questionnaires or interventions ( Neergaard et al., 2009 ; Sullivan-Bolyai et al., 2005 ).
Despite many strengths and frequent citations of its use, limited discussions regarding QD are found in qualitative research textbooks and publications. To the best of our knowledge, only seven articles include specific guidance on how to design, implement, analyze, or report the results of a QD study ( Milne & Oberle, 2005 ; Neergaard, Olesen, Andersen, & Sondergaard, 2009 ; Sandelowski, 2000 , 2010 ; Sullivan-Bolyai, Bova, & Harper, 2005 ; Vaismoradi, Turunen, & Bondas, 2013 ; Willis, Sullivan-Bolyai, Knafl, & Zichi-Cohen, 2016 ). Furthermore, little is known about characteristics of QD as reported in journal-published, nursing-related, qualitative studies. Therefore, the purpose of this systematic review was to describe specific characteristics of methods and findings of studies reported in journal articles (published in 2014) self-labeled as QD. In this review, we did not have a goal to judge whether QD was done correctly but rather to report on the features of the methods and findings.
Features of QD
Several QD design features and techniques have been described in the literature. First, researchers generally draw from a naturalistic perspective and examine a phenomenon in its natural state ( Sandelowski, 2000 ). Second, QD has been described as less theoretical compared to other qualitative approaches ( Neergaard et al., 2009 ), facilitating flexibility in commitment to a theory or framework when designing and conducting a study ( Sandelowski, 2000 , 2010 ). For example, researchers may or may not decide to begin with a theory of the targeted phenomenon and do not need to stay committed to a theory or framework if their investigations take them down another path ( Sandelowski, 2010 ). Third, data collection strategies typically involve individual and/or focus group interviews with minimal to semi-structured interview guides ( Neergaard et al., 2009 ; Sandelowski, 2000 ). Fourth, researchers commonly employ purposeful sampling techniques such as maximum variation sampling which has been described as being useful for obtaining broad insights and rich information ( Neergaard et al., 2009 ; Sandelowski, 2000 ). Fifth, content analysis (and in many cases, supplemented by descriptive quantitative data to describe the study sample) is considered a primary strategy for data analysis ( Neergaard et al., 2009 ; Sandelowski, 2000 ). In some instances thematic analysis may also be used to analyze data; however, experts suggest care should be taken that this type of analysis is not confused with content analysis ( Vaismoradi et al., 2013 ). These data analysis approaches allow researchers to stay close to the data and as such, interpretation is of low-inference ( Neergaard et al., 2009 ), meaning that different researchers will agree more readily on the same findings even if they do not choose to present the findings in the same way ( Sandelowski, 2000 ). Finally, representation of study findings in published reports is expected to be straightforward, including comprehensive descriptive summaries and accurate details of the data collected, and presented in a way that makes sense to the reader ( Neergaard et al., 2009 ; Sandelowski, 2000 ).
It is also important to acknowledge that variations in methods or techniques may be appropriate across QD studies ( Sandelowski, 2010 ). For example, when consistent with the study goals, decisions may be made to use techniques from other qualitative traditions, such as employing a constant comparative analytic approach typically associated with grounded theory ( Sandelowski, 2000 ).
Search Strategy and Study Screening
The PubMed electronic database was searched for articles written in English and published from January 1, 2014 to December 31, 2014, using the terms, “qualitative descriptive study,” “qualitative descriptive design,” and “qualitative description,” combined with “nursing.” This specific publication year, “2014,” was chosen because it was the most recent full year at the time of beginning this systematic review. As we did not intend to identify trends in QD approaches over time, it seemed reasonable to focus on the nursing QD studies published in a certain year. The inclusion criterion for this review was data-based, nursing-related, research articles in which authors used the terms QD, qualitative descriptive study, or qualitative descriptive design in their titles or abstracts as well as in the main texts of the publication.
All articles yielded through an initial search in PubMed were exported into EndNote X7 ( Thomson Reuters, 2014 ), a reference management software, and duplicates were removed. Next, titles and abstracts were reviewed to determine if the publication met inclusion criteria; all articles meeting inclusion criteria were then read independently in full by two authors (HK and JS) to determine if the terms – QD or qualitative descriptive study/design – were clearly stated in the main texts. Any articles in which researchers did not specifically state these key terms in the main text were then excluded, even if the terms had been used in the study title or abstract. In one article, for example, although “qualitative descriptive study” was reported in the published abstract, the researchers reported a “qualitative exploratory design” in the main text of the article ( Sundqvist & Carlsson, 2014 ); therefore, this article was excluded from our review. Despite the possibility that there may be other QD studies published in 2014 that were not labeled as such, to facilitate our screening process we only included articles where the researchers clearly used our search terms for their approach. Finally, the two authors compared, discussed, and reconciled their lists of articles with a third author (CB).
Study Selection
Initially, although the year 2014 was specifically requested, 95 articles were identified (due to ahead of print/Epub) and exported into the EndNote program. Three duplicate publications were removed and the 20 articles with final publication dates of 2015 were also excluded. The remaining 72 articles were then screened by examining titles, abstracts, and full-texts. Based on our inclusion criteria, 15 (of 72) were then excluded because QD or QD design/study was not identified in the main text. We then re-examined the remaining 57 articles and excluded two additional articles that did not meet inclusion criteria (e.g., QD was only reported as an analytic approach in the data analysis section). The remaining 55 publications met inclusion criteria and comprised the sample for our systematic review (see Figure 1 ).

Flow Diagram of Study Selection
Of the 55 publications, 23 originated from North America (17 in the United States; 6 in Canada), 12 from Asia, 11 from Europe, 7 from Australia and New Zealand, and 2 from South America. Eleven studies were part of larger research projects and two of them were reported as part of larger mixed-methods studies. Four were described as a secondary analysis.
Quality Appraisal Process
Following the identification of the 55 publications, two authors (HK and JS) independently examined each article using the Critical Appraisal Skills Programme (CASP) qualitative checklist ( CASP, 2013 ). The CASP was chosen to determine the general adequacy (or rigor) of the qualitative studies included in this review as the CASP criteria are generic and intend to be applied to qualitative studies in general. In addition, the CASP was useful because we were able to examine the internal consistency between study aims and methods and between study aims and findings as well as the usefulness of findings ( CASP, 2013 ). The CASP consists of 10 main questions with several sub-questions to consider when making a decision about the main question ( CASP, 2013 ). The first two questions have reviewers examine the clarity of study aims and appropriateness of using qualitative research to achieve the aims. With the next eight questions, reviewers assess study design, sampling, data collection, and analysis as well as the clarity of the study’s results statement and the value of the research. We used the seven questions and 17 sub-questions related to methods and statement of findings to evaluate the articles. The results of this process are presented in Table 1 .
CASP Questions and Quality Appraisal Results (N = 55)
| CASP Questions • CASP Subquestions | Results | |||||
|---|---|---|---|---|---|---|
| Yes | No | Can’t tell | ||||
| Was the research design appropriate to address the aims of the research? | ||||||
| • Did the researcher justify the research design? | 26 | 47.3 | 28 | 50.9 | 1 | 1.8 |
| Was the recruitment strategy appropriate to the aims of the research? | ||||||
| • Did the researcher explain how the participants were selected? | 44 | 80 | 6 | 10.9 | 5 | 9.1 |
| Was the data collected in a way that addressed the research issue? | ||||||
| • Was the setting for data collection justified? | 31 | 56.4 | 21 | 38.2 | 3 | 5.4 |
| • Was it clear how data were collected e.g., focus group, semistructured interview etc.? | 55 | 100 | 0 | 0.0 | 0 | 0.0 |
| • Did the researcher justify the methods chosen? | 13 | 23.6 | 41 | 74.5 | 1 | 1.8 |
| • Did the researcher make the methods explicit e.g., for the interview method, was there an indication of how interviews were conducted, or did they use a topic guide? | 51 | 92.7 | 4 | 7.3 | 0 | 0.0 |
| • Was the form of data clear e.g., tape recordings, video materials, notes, etc.? | 54 | 98.2 | 0 | 0.0 | 1 | 1.8 |
| • Did the researcher discuss saturation of data? | 20 | 36.4 | 35 | 63.6 | 0 | 0.0 |
| Has the relationship between researcher and participants been adequately considered? | ||||||
| • Did the researcher critically examine their own role, potential bias, and influence during data collection, including sample recruitment and choice of location | 4 | 7.3 | 50 | 90.9 | 1 | 1.8 |
| Have ethical issues been taken into consideration? | ||||||
| • Was there sufficient detail about how the research was explained to participants for the reader to assess whether ethical standards were maintained? | 49 | 89.1 | 4 | 7.3 | 2 | 3.6 |
| • Was approval sought from an ethics committee? | 51 | 92.7 | 4 | 7.3 | 0 | 0.0 |
| Was the data analysis sufficiently rigorous? | ||||||
| • Was there an in-depth description of the analysis process? | 46 | 83.6 | 9 | 16.4 | 0 | 0.0 |
| • Was thematic or content analysis used. If so, was it clear how the categories/themes derived from the data? | 51 | 92.7 | 3 | 5.5 | 1 | 1.8 |
| • Did the researcher critically examine their own role, potential bias and influence during analysis and selection of data for presentation? | 20 | 36.4 | 30 | 54.5 | 5 | 9.1 |
| Was there a clear statement of findings? | ||||||
| • Were the findings explicit? | 55 | 100 | 0 | 0 | 0 | 0 |
| • Did the researcher discuss the credibility of their findings (e.g., triangulation) | 46 | 83.6 | 8 | 14.5 | 1 | 1.8 |
| • Were the findings discussed in relation to the original research question? | 55 | 100 | 0 | 0 | 0 | 0 |
Note . The CASP questions are adapted from “10 questions to help you make sense of qualitative research,” by Critical Appraisal Skills Programme, 2013, retrieved from http://media.wix.com/ugd/dded87_29c5b002d99342f788c6ac670e49f274.pdf . Its license can be found at http://creativecommons.org/licenses/by-nc-sa/3.0/
Once articles were assessed by the two authors independently, all three authors discussed and reconciled our assessment. No articles were excluded based on CASP results; rather, results were used to depict the general adequacy (or rigor) of all 55 articles meeting inclusion criteria for our systematic review. In addition, the CASP was included to enhance our examination of the relationship between the methods and the usefulness of the findings documented in each of the QD articles included in this review.
Process for Data Extraction and Analysis
To further assess each of the 55 articles, data were extracted on: (a) research objectives, (b) design justification, (c) theoretical or philosophical framework, (d) sampling and sample size, (e) data collection and data sources, (f) data analysis, and (g) presentation of findings (see Table 2 ). We discussed extracted data and identified common and unique features in the articles included in our systematic review. Findings are described in detail below and in Table 3 .
Elements for Data Extraction
| Elements | Data Extraction |
|---|---|
| Research objectives | • Verbs used in objectives or aims |
| • Focuses of study | |
| Design justification | • If the article cited references for qualitative description |
| • If the article offered rationale to choose qualitative description | |
| • References cited | |
| • Rationale reported | |
| Theoretical or philosophical frameworks | • If the article has theoretical or philosophical frameworks for study |
| • Theoretical or philosophical frameworks reported | |
| • How the frameworks were used in data collection and analysis | |
| Sampling and sample sizes | • Sampling strategies (e.g., purposeful sampling, maximum variation) |
| • Sample size | |
| Data collection and sources | • Data collection techniques (e.g., individual or focus-group interviews, interview guide, surveys, field notes) |
| Data analysis | • Data analysis techniques (e.g., qualitative content analysis, thematic analysis, constant comparison) |
| • If data saturation was achieved | |
| Presentation of findings | • Statement of findings |
| • Consistency with research objectives |
Data Extraction and Analysis Results
| Authors Country | Research Objectives | Design justification | Theoretical/ philosophical frameworks | Sampling/ sample size | Data collection and data sources | Data analysis | Findings |
|---|---|---|---|---|---|---|---|
| • USA | • Explore • Responses to communication strategies | • (-) Reference • (-) Rationale | Not reported (NR) | • Purposive sampling/ maximum variation • 32 family members | • Interviews • Observations • Review of daily flow sheet • Demographics | • Inductive and deductive qualitative content analysis • (-) Data saturation | Five themes about family members’ perceptions of nursing communication approaches |
| • Sweden | • Describe • Experiences of using guidelines in daily practice | • (-) Reference • (+) Rationale • Part of a research program | NR | • Unspecified • 8 care providers | • Semistructured, individual interviews • Interview guide | • Qualitative content analysis • (-) Data saturation | One theme and seven subthemes about care providers’ experiences of using guidelines in daily practice |
| • USA | • Examine • Culturally specific views of processes and causes of midlife weight gain | • (-) Reference • (-) Rationale | Health belief model and Kleiman’s explanatory model | • Unspecified • 19 adults | • Semistructured, individual interview | • Conventional content analysis • (-) Data saturation | Three main categories (from the model) and eight subthemes about causes of weight gain in midlife |
| • Iran | • Explore • Factors initiating responsibility among medical trainees | • (-) Reference • (+) Rationale | NR | • Convenience, snowball, and maximum variation sampling • 15 trainees and other professionals | • Semistructured, individual interview • Interview guide | • Conventional content analysis • Constant comparison • (+) Data saturation | Two themes and individual and non- individual-based factors per theme |
| • Iran | • Explore • Factors related to job satisfaction and dissatisfaction | • (-) Reference • (-) Rationale | NR | • Convenience sampling • 85 nurses | • Semistructured focus group interviews • Interview guide | • Thematic analysis • (+) Data saturation | Three main themes and associated factors regarding job satisfaction and dissatisfaction |
| • Norway | • Describe • Perceptions on simulation-based team training | • (-) Reference • (-) Rationale | NR | • Strategic sampling • 18 registered nurses | • Semistructured individual interviews | • Inductive content analysis • (-) Data saturation | One main category, three categories, and six sub- categories regarding nurses’ perceptions on simulation-based team training |
| • USA | • Determine • Barriers and supports for attending college and nursing school | • (-) Reference • (-) Rationale | NR | • Unspecified • 45 students | • Focus-group interviews • Using Photovoice and SHOWeD | • Constant comparison • (-) Data saturation | Five themes about facilitators and barriers |
| • USA | • Explore • Reasons for choosing home birth and birth experiences | • (-) Reference • (-) Rationale | NR | • Purposeful sampling • 20 women | • Semistructured focus-group interviews • Interview guide • Field notes | • Qualitative content analysis • (+) Data saturation | Five common themes and concepts about reasons for choosing home birth based on their birth experiences |
| • New Zealand | • Explore • Normal fetal activity related to hunger and satiation | • (+) Reference • (+) Rationale • • Denzin & Lincoln (2011) | NR | • Purposive sampling • 19 pregnant women | • Semistructured individual interviews • Open-ended questions | • Inductive qualitative content analysis • Descriptive statistical analysis • (+) Data saturation | Four patterns regarding fetal activities in relation to meal anticipation, maternal hunger, maternal meal consummation, and maternal satiety |
| • Italy | • Explore, describe, and compare • perceptions of nursing caring | • (+) Reference • (-) Rationale • | NR | • Purposive sampling • 20 nurses and 20 patients | • Semistructured individual interviews • Interview guide • Field notes during interviews | • Unspecified various analytic strategies including constant comparison • (-) Data saturation | Nursing caring from both patients’ and nurses’ perspectives – a summary of data in visible caring and invisible caring |
| • Hong Kong | • Address • How to reduce coronary heart disease risks | • (+) Reference • (+) Rationale • Secondary analysis • • | NR | • Convenience and snowball sampling • 105 patients | • Focus-group interviews • Interview guide | • Content analysis • (+) Data saturation | Four categories about patients’ abilities to reduce coronary heart disease |
| • Taiwan | • Explore • Reasons for young–old people not killing themselves | • (-) Reference • (-) Rationale | NR | • Convenience sampling • 31 older adults | • Semistructured individual interviews • Interview guide • Observation with memos/reflective journal | • Content analysis • (+) Data saturation | Six themes regarding reasons for not committing to suicide |
| • USA | • Explore • Neonatal intensive care unit experiences | • (+) Reference • (+) Rationale • | NR | • Purposive sampling and convenience sample • 15 mothers | • Semistructured individual interviews • Interview guide | • Qualitative content analysis • (+) Data saturation | Four themes about participants’ experiences of neonatal intensive care unit |
| • Colombia | • Investigate • Barriers/facilitators to implementing evidence-based nursing | • (+) Reference • (-) Rationale • | Ottawa model for research use: knowledge translation framework | • Convenience sampling • 13 nursing professionals | • Semistructured individual interviews • Interview guide | • Inductive qualitative content analysis • Constant comparison • (-) Data saturation | Four main barriers and potential facilitators to evidence-based nursing |
| • Australia | • Explore • Perceptions and utilization of diaries | • (+) Reference • (-) Rationale • | NR | • Unspecified • 19 patients and families | • Responses to open-ended questions on survey | • Unspecified analysis strategy • (-) Data saturation | Five themes regarding perceptions on use of diaries and descriptive statistics using frequencies of utilization |
| • USA | • Explore • Knowledge, attitudes, and beliefs about sexual consent | • (-) Reference • (-) Rationale • Part of a larger mixed-method study | Theory of planned behavior | • Purposive sampling • snowball sampling • 26 women | • Semistructured focus-group interviews • Interview guide | • Content analysis • (+) Data saturation | Three main categories and subthemes regarding sexual consent |
| • Sweden | • Describe • Experiences of knowledge development in wound management | • (+) Reference • (+) Rationale: weak • | NR | • Purposive sampling • 16 district nurses | • Individual interviews • Interview guide | • Qualitative content analysis • (-) Data saturation | Three categories and eleven sub-categories about knowledge development experiences in wound management |
| • USA | • Describe • Parental-pain journey, beliefs about pain, and attitudes/behaviors related to children’s responses | • (+) Reference • (+) Rationale • • • Part of a larger mixed methods study | NR | • Purposive sampling • 9 parents | • Individual interviews • One open- ended question | • Qualitative content analysis • (+) Data saturation | Two main themes, categories, and subcategories about parents’ experiences of observing children’s pain |
| • USA | • Describe • Challenges and barriers in providing culturally competent care | • (+) Reference • (+) Rationale • • Secondary analysis | NR | • Stratified sampling • 253 nurses | • Written responses to 2 open-ended questions on survey | • Thematic analysis • (-) Data saturation | Three themes regarding challenges/barriers |
| • Denmark | • Describe • Experiences of childbirth | • (-) Reference • (-) Rationale • A substudy | NR | • Purposive sampling with maximum variation • Partners of 10 women | • Semistructured, individual interviews • Interview guide | • Thematic analysis • (+) Data saturation | Three themes and four subthemes about partners’ experiences of women’s childbirth |
| • Australia | • Explore • Perceptions about medical nutrition and hydration at the end of life | • (+) Reference • (+) Rationale • | NR | • Purposeful sampling • 10 nurses | • Focus-group interviews | • “analyzed thematically” • (-) Data saturation | One main theme and four subthemes regarding nurses’ perceptions on EOL- related medical nutrition and hydration |
| • USA | • Describe • Reasons for leaving a home visiting program early | • (-) Reference • (-) Rationale | NR | • Convenience sample • 32 mothers, nurses, and nurse supervisors | • Semistructured, individual interviews • Focus-group interviews • Interview guide | • Inductive content analysis • Constant comparison approach • (+) Data saturation | Three sets of reasons for leaving a home visiting program |
| • Sweden | • Explore and describe • Beliefs and attitudes around the decision for a caesarean section | • (+) Reference • (+) Rationale • • | NR | • Unspecified • 21 males | • Individual telephone interviews | • Thematic analysis • Constant comparison approach • (-) Data saturation | Two themes and subthemes in relation to the research objective |
| • Taiwan | • Explore • Illness experiences of early onset of knee osteoarthritis | • (+) Reference • (+) Rationale • • • Part of a large research series | NR | • Purposive sampling • 17 adults | • Semistructured, Individual interviews • Interview guide • Memo/field notes (observations) | • Inductive content analysis • (+) Data saturation | Three major themes and nine subthemes regarding experiences of early onset-knee osteoarthritis |
| • Australia | • Explore • Perceptions about bedside handover (new model) by nurses | • (+) Reference • (+) Rationale • • | NR | • Purposive sampling • 30 patients | • Semistructured, individual interviews • Interview guide | • Thematic content analysis • (-) Data analysis | Two dominant themes and related subthemes regarding patients’ thoughts about nurses’ bedside handover |
| • Sweden | • Identify • Patterns in learning when living with diabetes | • (-) Reference • (-) Rationale | NR | • Purposive sampling with variations in age and sex • 13 participants | • Semistructured, individual interviews (3 times over 3 years) | • analysis process • Inductive qualitative content analysis • (-) Data saturation | Five main patterns of learning when living with diabetes for three years following diagnosis |
| • Canada | • Evaluate • Book chat intervention based on a novel | • (-) Reference • (-) Rationale • Part of a larger research project | NR | • Unspecified • 11 long-term- care staff | • Questionnaire with two open- ended questions | • Thematic content analysis • (-) Data saturation | Five themes (positive comments) about the book chat with brief description |
| • Taiwan | • Explore • Facilitators and barriers to implementing smoking- cessation counseling services | • (-) Reference • (-) Rationale | NR | • Unspecified • 16 nurse- counselors | • Semistructured individual interviews • Interview guide | • Inductive content analysis • Constant comparison • (-) Data saturation | Two themes and eight subthemes about facilitators and barriers described using 2-4 quotations per subtheme |
| • USA | • Identify • Educational strategies to manage disruptive behavior | • (-) Reference • (-) Rationale • Part of a larger study | NR | • Unspecified • 9 nurses | • Semistructured, individual interviews • Interview guide | • Content analysis procedures • (-) Data saturation | Two main themes regarding education strategies for nurse educators |
| • USA | • Explore • Experiences of difficulty resolving patient- related concerns | • (-) Reference • (-) Rationale • Secondary analysis | NR | • Unspecified • 1932 physician, nursing, and midwifery professionals | • E-mail survey with multiple- choice and free- text responses | • Inductive thematic analysis • Descriptive statistics • (-) Data saturation | One overarching theme and four subthemes about professionals’ experiences of difficulty resolving patient-related concerns |
| • Singapore | • Explicate • Experience of quality of life for older adults | • (+) Reference • (+) Rationale • | Parse’s human becoming paradigm | • Unspecified • 10 elderly residents | • Individual interviews • Interview questions presented (Parse) | • Unspecified analysis techniques • (-) Data saturation | Three themes presented using both participants’ language and the researcher’s language |
| • China | • Explore • Perspectives on learning about caring | • (-) Reference • (-) Rationale | NR | • Purposeful sampling • 20 nursing students | • Focus-group interviews • Interview guide | • Conventional content analysis • (-) Data saturation | Four categories and associated subcategories about facilitators and challenges to learning about caring |
| • Poland | • Describe and assess • Components of the patient–nurse relationship and pediatric-ward amenities | • (+) Reference • (-) Rationale • | NR | • Purposeful, maximum variation sampling • 26 parents or caregivers and 22 children | • Individual interviews | • Qualitative content analysis • (-) Data saturation | Five main topics described from the perspectives of children and parents |
| • Canada | • Evaluate • Acceptability and feasibility of hand-massage therapy | • (-) Reference • (-) Rationale • Secondary to a RCT | Focused on feasibility and acceptability | • Unspecified • 40 patients | • Semistructured, individual interviews • Field notes • Video recording | • Thematic analysis for acceptability • Quantitative ratings of video items for feasibility • (-) Data analysis | Summary of data focusing on predetermined indicators of acceptability and descriptive statistics to present feasibility |
| • USA | • Understand • Challenges occurring during transitions of care | • (+) Reference • (+) Rationale • • Part of a larger study | NR | • Convenience sample • 22 nurses | • Focus groups • Interview guide | • Qualitative content analysis methods • (+) Data analysis | Three themes about challenges regarding transitions of care: |
| • Canada | • Understand • Factors that influence nurses’ retention in their current job | • (-) Reference • (-) Rationale | NR | • Purposeful sampling • 41 nurses | • Focus-group interviews • Interview guide | • Directed content analysis • (+) Data saturation | Nurses’ reasons to stay and leave their current job |
| • Australia | • Extend • Understanding of caregivers’ views on advance care planning | • (+) Reference • (+) Rationale • • Grounded theory overtone | NR | • Theoretical sampling • 18 caregivers | • Semistructured focus group and individual interviews • Interview guide • Vignette technique | • Inductive, cyclic, and constant comparative analysis • (-) Data analysis | Three themes regarding caregivers’ perceptions on advance care planning |
| • USA | • Describe • Outcomes older adults with epilepsy hope to achieve in management | • (-) Reference • (-) Rationale | NR | • Unspecified • 20 patients | • Individual interview | • Conventional content analysis • (-) Data saturation | Six main themes and associated subthemes regarding what older adults hoped to achieve in management of their epilepsy |
| • The Netherlands | • Gain • Experience of personal dignity and factors influencing it | • (+) Reference • (-) Rationale • | Model of dignity in illness | • Maximum variation sampling • 30 nursing home residents | • Individual interviews • Interview guide | • Thematic analysis • Constant comparison • (+) Data saturation | The threatening effect of illness and three domains being threatened by illness in relation to participants’ experiences of personal dignity |
| • USA | • Identify and describe • Needs in mental health services and “ideal” program | • (+) Reference • (+) Rationale • • There is a primary study | NR | • Unspecified • 52 family members | • Semistructured, individual and focus-group interviews | • “Standard content analytic procedures” with case-ordered meta-matrix • (-) Data saturation | Two main topics – (a) intervention modalities that would fit family members’ needs in mental health services and (b) topics that programs should address |
| • USA | • “What are the perceptions of staff nurses regarding palliative care…?” | • (-) Reference • (-) Rationale | NR | • Purposive, convenience sampling • 18 nurses | • Semistructured and focus-group interviews • Interview guide | • Ritchie and Spencer’s framework for data analysis • (-) Data saturation | Five thematic categories and associated subcategories about nurses’ perceptions of palliative care |
| • Canada | • Describe • Experience of caring for a relative with dementia | • (+) Reference • (+) Rationale • Sandelowski ( ; ) • Secondary analysis • Phenomenological overtone | NR | • Purposive sampling • 11 bereaved family members | • Individual interviews • 27 transcripts from the primary study | • Unspecified • (-) Data saturation | Five major themes regarding the journey with dementia from the time prior to diagnosis and into bereavement |
| • Canada | • Describe Experience of fetal fibronectin testing | • (+) Reference • (+) Rationale • • | NR | • Unspecified • 17 women | • Semistructured individual interviews • Interview guide | • Conventional content analysis • (+) Data saturation | One overarching theme, three themes, and six subthemes about women’s experiences of fetal fibronectin testing |
| • New Zealand | • Explore • Role of nurses in providing palliative and end-of-life care | • (+) Reference • (+) Rationale • • Part of a larger study | NR | • Purposeful sampling • 21 nurses | • Semistructured individual interviews | • Thematic analysis • (-) Data saturation | Three themes about practice nurses’ experiences in providing palliative and end-of-life care |
| • Brazil | • Understand • Experience with postnatal depression | • (+) Reference • (-) Rationale • | NR | • Purposeful, criterion sampling • 15 women with postnatal depression | • Minimally structured, individual interviews | • Thematic analysis • (+) Data saturation | Two themes – women’s “bad thoughts” and their four types of responses to fear of harm (with frequencies) |
| • Australia | • Understand • Experience of peripherally inserted central catheter insertion | • (+) Reference • (+) Rationale • | NR | • Purposeful sampling • 10 patients | • Semistructured, individual interviews • Interview guide | • Thematic analysis • (+) Data saturation | Four themes regarding patients’ experiences of peripherally inserted central catheter insertion |
| • USA | • Discover • Context, values, and background meaning of cultural competency | • (+) Reference • (+) Rationale • | Focused on cultural competence | • Purposive, maximum variation, and network • 20 experts | • Semistructured, individual interviews | • Within-case and across-case analysis • (-) Data saturation | Three themes regarding cultural competency |
| • USA | • Explore and describe • Cancer experience | • (+) Reference • (+) Rationale • | NR | • Unspecified • 15 patients | • Longitudinal individual interviews (4 time points) • 40 interviews | • Inductive content analysis • (-) Data saturation | Processes and themes about adolescent identify work and cancer identify work across the illness trajectory |
| • Sweden | • Explore • Experiences of giving support to patients during the transition | • (-) Reference • (-) Rationale | Focused on support and transition | • Unspecified (but likely purposeful sampling) • 8 nurses | • Semistructured Individual interviews • Interview guide | • Content analysis • (-) Data saturation | One theme, three main categories, and eight associated categories |
| • Taiwan | • Describe • Process of women’s recovery from stillbirth | • (+) Reference • (+) Rationale • | NR | • Purposeful sampling • 21 women | • Individual interview techniques | • Inductive analytic approaches ( ) • (+) Data saturation | Three stages (themes) regarding the recovery process of Taiwanese women with stillbirth |
| • Iran | • Describe • Perspectives of causes of medication errors | • (+) Reference • (+) Rationale • | NR | • Purposeful sampling • 24 nursing students | • Focus-group interviews • Observations with notes | • Content analysis • (-) Data saturation | Two main themes about nursing students’ perceptions on causes of medication errors |
| • Iran | • Explore • Image of nursing | • (-) Reference • (-) Rationale | NR | • Purposeful sampling • 18 male nurses | • Semistructured individual, interviews • Field notes | • Content analysis • (-) Data saturation | Two main views (themes) on nursing presented with subthemes per view |
| • Spain | • Ascertain • Barriers to sexual expression | • (-) Reference • (-) Rationale | NR | • Maximum variation • 100 staff and residents | • Semistructured, individual interview | • Content analysis • (-) Data saturation | 40% of participants without identification of barriers and 60% with seven most cited barriers to sexual expression in the long-term care setting |
| • Canada | • Explore • Perceptions of empowerment in academic nursing environments | • (+) Reference • (+) Rationale • Sandelowski ( , ) | Theories of structural power in organizations and psychological empowerment | • Unspecified • 8 clinical instructors | • Semistructured, individual • interview guide | • Unspecified (but used pre-determined concepts) • (+) Data saturation | Structural empowerment and psychological empowerment described using predetermined concepts |
| • China | • Investigate • Meaning of life and health experience with chronic illness | • (+) Reference • (+) Rationale • Sandelowski ( , ) | Positive health philosophy | • Purposive, convenience sampling • 11 patients | • Individual interviews • Observations of daily behavior with field notes | • Thematic analysis • (-) Data saturation | Four themes regarding the meaning of life and health when living with chronic illnesses |
Note . NR = not reported
Quality Appraisal Results
Justification for use of a QD design was evident in close to half (47.3%) of the 55 publications. While most researchers clearly described recruitment strategies (80%) and data collection methods (100%), justification for how the study setting was selected was only identified in 38.2% of the articles and almost 75% of the articles did not include any reason for the choice of data collection methods (e.g., focus-group interviews). In the vast majority (90.9%) of the articles, researchers did not explain their involvement and positionality during the process of recruitment and data collection or during data analysis (63.6%). Ethical standards were reported in greater than 89% of all articles and most articles included an in-depth description of data analysis (83.6%) and development of categories or themes (92.7%). Finally, all researchers clearly stated their findings in relation to research questions/objectives. Researchers of 83.3% of the articles discussed the credibility of their findings (see Table 1 ).
Research Objectives
In statements of study objectives and/or questions, the most frequently used verbs were “explore” ( n = 22) and “describe” ( n = 17). Researchers also used “identify” ( n = 3), “understand” ( n = 4), or “investigate” ( n = 2). Most articles focused on participants’ experiences related to certain phenomena ( n = 18), facilitators/challenges/factors/reasons ( n = 14), perceptions about specific care/nursing practice/interventions ( n = 11), and knowledge/attitudes/beliefs ( n = 3).
Design Justification
A total of 30 articles included references for QD. The most frequently cited references ( n = 23) were “Whatever happened to qualitative description?” ( Sandelowski, 2000 ) and “What’s in a name? Qualitative description revisited” ( Sandelowski, 2010 ). Other references cited included “Qualitative description – the poor cousin of health research?” ( Neergaard et al., 2009 ), “Reaching the parts other methods cannot reach: an introduction to qualitative methods in health and health services research” ( Pope & Mays, 1995 ), and general research textbooks ( Polit & Beck, 2004 , 2012 ).
In 26 articles (and not necessarily the same as those citing specific references to QD), researchers provided a rationale for selecting QD. Most researchers chose QD because this approach aims to produce a straight description and comprehensive summary of the phenomenon of interest using participants’ language and staying close to the data (or using low inference).
Authors of two articles distinctly stated a QD design, yet also acknowledged grounded-theory or phenomenological overtones by adopting some techniques from these qualitative traditions ( Michael, O'Callaghan, Baird, Hiscock, & Clayton, 2014 ; Peacock, Hammond-Collins, & Forbes, 2014 ). For example, Michael et al. (2014 , p. 1066) reported:
The research used a qualitative descriptive design with grounded theory overtones ( Sandelowski, 2000 ). We sought to provide a comprehensive summary of participants’ views through theoretical sampling; multiple data sources (focus groups [FGs] and interviews); inductive, cyclic, and constant comparative analysis; and condensation of data into thematic representations ( Corbin & Strauss, 1990 , 2008 ).
Authors of four additional articles included language suggestive of a grounded-theory or phenomenological tradition, e.g., by employing a constant comparison technique or translating themes stated in participants’ language into the primary language of the researchers during data analysis ( Asemani et al., 2014 ; Li, Lee, Chen, Jeng, & Chen, 2014 ; Ma, 2014 ; Soule, 2014 ). Additionally, Li et al. (2014) specifically reported use of a grounded-theory approach.
Theoretical or Philosophical Framework
In most (n = 48) articles, researchers did not specify any theoretical or philosophical framework. Of those articles in which a framework or philosophical stance was included, the authors of five articles described the framework as guiding the development of an interview guide ( Al-Zadjali, Keller, Larkey, & Evans, 2014 ; DeBruyn, Ochoa-Marin, & Semenic, 2014 ; Fantasia, Sutherland, Fontenot, & Ierardi, 2014 ; Ma, 2014 ; Wiens, Babenko-Mould, & Iwasiw, 2014 ). In two articles, data analysis was described as including key concepts of a framework being used as pre-determined codes or categories ( Al-Zadjali et al., 2014 ; Wiens et al., 2014 ). Oosterveld-Vlug et al. (2014) and Zhang, Shan, and Jiang (2014) discussed a conceptual model and underlying philosophy in detail in the background or discussion section, although the model and philosophy were not described as being used in developing interview questions or analyzing data.
Sampling and Sample Size
In 38 of the 55 articles, researchers reported ‘purposeful sampling’ or some derivation of purposeful sampling such as convenience ( n = 10), maximum variation ( n = 8), snowball ( n = 3), and theoretical sampling ( n = 1). In three instances ( Asemani et al., 2014 ; Chan & Lopez, 2014 ; Soule, 2014 ), multiple sampling strategies were described, for example, a combination of snowball, convenience, and maximum variation sampling. In articles where maximum variation sampling was employed, “variation” referred to seeking diversity in participants’ demographics ( n = 7; e.g., age, gender, and education level), while one article did not include details regarding how their maximum variation sampling strategy was operationalized ( Marcinowicz, Abramowicz, Zarzycka, Abramowicz, & Konstantynowicz, 2014 ). Authors of 17 articles did not specify their sampling techniques.
Sample sizes ranged from 8 to 1,932 with nine studies in the 8–10 participant range and 24 studies in the 11–20 participant range. The participant range of 21–30 and 31–50 was reported in eight articles each. Six studies included more than 50 participants. Two of these articles depicted quite large sample sizes (N=253, Hart & Mareno, 2014 ; N=1,932, Lyndon et al., 2014 ) and the authors of these articles described the use of survey instruments and analysis of responses to open-ended questions. This was in contrast to studies with smaller sample sizes where individual interviews and focus groups were more commonly employed.
Data Collection and Data Sources
In a majority of studies, researchers collected data through individual ( n = 39) and/or focus-group ( n = 14) interviews that were semistructured. Most researchers reported that interviews were audiotaped ( n = 51) and interview guides were described as the primary data collection tool in 29 of the 51 studies. In some cases, researchers also described additional data sources, for example, taking memos or field notes during participant observation sessions or as a way to reflect their thoughts about interviews ( n = 10). Written responses to open-ended questions in survey questionnaires were another type of data source in a small number of studies ( n = 4).
Data Analysis
The analysis strategy most commonly used in the QD studies included in this review was qualitative content analysis ( n = 30). Among the studies where this technique was used, most researchers described an inductive approach; researchers of two studies analyzed data both inductively and deductively. Thematic analysis was adopted in 14 studies and the constant comparison technique in 10 studies. In nine studies, researchers employed multiple techniques to analyze data including qualitative content analysis with constant comparison ( Asemani et al., 2014 ; DeBruyn et al., 2014 ; Holland, Christensen, Shone, Kearney, & Kitzman, 2014 ; Li et al., 2014 ) and thematic analysis with constant comparison ( Johansson, Hildingsson, & Fenwick, 2014 ; Oosterveld-Vlug et al., 2014 ). In addition, five teams conducted descriptive statistical analysis using both quantitative and qualitative data and counting the frequencies of codes/themes ( Ewens, Chapman, Tulloch, & Hendricks, 2014 ; Miller, 2014 ; Santos, Sandelowski, & Gualda, 2014 ; Villar, Celdran, Faba, & Serrat, 2014 ) or targeted events through video monitoring ( Martorella, Boitor, Michaud, & Gelinas, 2014 ). Tseng, Chen, and Wang (2014) cited Thorne, Reimer Kirkham, and O’Flynn-Magee (2004)’s interpretive description as the inductive analytic approach. In five out of 55 articles, researchers did not specifically name their analysis strategies, despite including descriptions about procedural aspects of data analysis. Researchers of 20 studies reported that data saturation for their themes was achieved.
Presentation of Findings
Researchers described participants’ experiences of health care, interventions, or illnesses in 18 articles and presented straightforward, focused, detailed descriptions of facilitators, challenges, factors, reasons, and causes in 15 articles. Participants’ perceptions of specific care, interventions, or programs were described in detail in 11 articles. All researchers presented their findings with extensive descriptions including themes or categories. In 25 of 55 articles, figures or tables were also presented to illustrate or summarize the findings. In addition, the authors of three articles summarized, organized, and described their data using key concepts of conceptual models ( Al-Zadjali et al., 2014 ; Oosterveld-Vlug et al., 2014 ; Wiens et al., 2014 ). Martorella et al. (2014) assessed acceptability and feasibility of hand massage therapy and arranged their findings in relation to pre-determined indicators of acceptability and feasibility. In one longitudinal QD study ( Kneck, Fagerberg, Eriksson, & Lundman, 2014 ), the researchers presented the findings as several key patterns of learning for persons living with diabetes; in another longitudinal QD study ( Stegenga & Macpherson, 2014 ), findings were presented as processes and themes regarding patients’ identity work across the cancer trajectory. In another two studies, the researchers described and compared themes or categories from two different perspectives, such as patients and nurses ( Canzan, Heilemann, Saiani, Mortari, & Ambrosi, 2014 ) or parents and children ( Marcinowicz et al., 2014 ). Additionally, Ma (2014) reported themes using both participants’ language and the researcher’s language.
In this systematic review, we examined and reported specific characteristics of methods and findings reported in journal articles self-identified as QD and published during one calendar year. To accomplish this we identified 55 articles that met inclusion criteria, performed a quality appraisal following CASP guidelines, and extracted and analyzed data focusing on QD features. In general, three primary findings emerged. First, despite inconsistencies, most QD publications had the characteristics that were originally observed by Sandelowski (2000) and summarized by other limited available QD literature. Next, there are no clear boundaries in methods used in the QD studies included in this review; in a number of studies, researchers adopted and combined techniques originating from other qualitative traditions to obtain rich data and increase their understanding of the phenomenon under investigation. Finally, justification for how QD was chosen and why it would be an appropriate fit for a particular study is an area in need of increased attention.
In general, the overall characteristics were consistent with design features of QD studies described in the literature ( Neergaard et al., 2009 ; Sandelowski, 2000 , 2010 ; Vaismoradi et al., 2013 ). For example, many authors reported that study objectives were to describe or explore participants’ experiences and factors related to certain phenomena, events, or interventions. In most cases, these authors cited Sandelowski (2000) as a reference for this particular characteristic. It was rare that theoretical or philosophical frameworks were identified, which also is consistent with descriptions of QD. In most studies, researchers used purposeful sampling and its derivative sampling techniques, collected data through interviews, and analyzed data using qualitative content analysis or thematic analysis. Moreover, all researchers presented focused or comprehensive, descriptive summaries of data including themes or categories answering their research questions. These characteristics do not indicate that there are correct ways to do QD studies; rather, they demonstrate how others designed and produced QD studies.
In several studies, researchers combined techniques that originated from other qualitative traditions for sampling, data collection, and analysis. This flexibility or variability, a key feature of recently published QD studies, may indicate that there are no clear boundaries in designing QD studies. Sandelowski (2010) articulated: “in the actual world of research practice, methods bleed into each other; they are so much messier than textbook depictions” (p. 81). Hammersley (2007) also observed:
“We are not so much faced with a set of clearly differentiated qualitative approaches as with a complex landscape of variable practice in which the inhabitants use a range of labels (‘ethnography’, ‘discourse analysis’, ‘life history work’, narrative study’, ……, and so on) in diverse and open-ended ways in order to characterize their orientation, and probably do this somewhat differently across audiences and occasions” (p. 293).
This concept of having no clear boundaries in methods when designing a QD study should enable researchers to obtain rich data and produce a comprehensive summary of data through various data collection and analysis approaches to answer their research questions. For example, using an ethnographical approach (e.g., participant observation) in data collection for a QD study may facilitate an in-depth description of participants’ nonverbal expressions and interactions with others and their environment as well as situations or events in which researchers are interested ( Kawulich, 2005 ). One example found in our review is that Adams et al. (2014) explored family members’ responses to nursing communication strategies for patients in intensive care units (ICUs). In this study, researchers conducted interviews with family members, observed interactions between healthcare providers, patients, and family members in ICUs, attended ICU rounds and family meetings, and took field notes about their observations and reflections. Accordingly, the variability in methods provided Adams and colleagues (2014) with many different aspects of data that were then used to complement participants’ interviews (i.e., data triangulation). Moreover, by using a constant comparison technique in addition to qualitative content analysis or thematic analysis in QD studies, researchers compare each case with others looking for similarities and differences as well as reasoning why differences exist, to generate more general understanding of phenomena of interest ( Thorne, 2000 ). In fact, this constant comparison analysis is compatible with qualitative content analysis and thematic analysis and we found several examples of using this approach in studies we reviewed ( Asemani et al., 2014 ; DeBruyn et al., 2014 ; Holland et al., 2014 ; Johansson et al., 2014 ; Li et al., 2014 ; Oosterveld-Vlug et al., 2014 ).
However, this flexibility or variability in methods of QD studies may cause readers’ as well as researchers’ confusion in designing and often labeling qualitative studies ( Neergaard et al., 2009 ). Especially, it could be difficult for scholars unfamiliar with qualitative studies to differentiate QD studies with “hues, tones, and textures” of qualitative traditions ( Sandelowski, 2000 , p. 337) from grounded theory, phenomenological, and ethnographical research. In fact, the major difference is in the presentation of the findings (or outcomes of qualitative research) ( Neergaard et al., 2009 ; Sandelowski, 2000 ). The final products of grounded theory, phenomenological, and ethnographical research are a generation of a theory, a description of the meaning or essence of people’s lived experience, and an in-depth, narrative description about certain culture, respectively, through researchers’ intensive/deep interpretations, reflections, and/or transformation of data ( Streubert & Carpenter, 2011 ). In contrast, QD studies result in “a rich, straight description” of experiences, perceptions, or events using language from the collected data ( Neergaard et al., 2009 ) through low-inference (or data-near) interpretations during data analysis ( Sandelowski, 2000 , 2010 ). This feature is consistent with our finding regarding presentation of findings: in all QD articles included in this systematic review, the researchers presented focused or comprehensive, descriptive summaries to their research questions.
Finally, an explanation or justification of why a QD approach was chosen or appropriate for the study aims was not found in more than half of studies in the sample. While other qualitative approaches, including grounded theory, phenomenology, ethnography, and narrative analysis, are used to better understand people’s thoughts, behaviors, and situations regarding certain phenomena ( Sullivan-Bolyai et al., 2005 ), as noted above, the results will likely read differently than those for a QD study ( Carter & Little, 2007 ). Therefore, it is important that researchers accurately label and justify their choices of approach, particularly for studies focused on participants’ experiences, which could be addressed with other qualitative traditions. Justifying one’s research epistemology, methodology, and methods allows readers to evaluate these choices for internal consistency, provides context to assist in understanding the findings, and contributes to the transparency of choices, all of which enhance the rigor of the study ( Carter & Little, 2007 ; Wu, Thompson, Aroian, McQuaid, & Deatrick, 2016 ).
Use of the CASP tool drew our attention to the credibility and usefulness of the findings of the QD studies included in this review. Although justification for study design and methods was lacking in many articles, most authors reported techniques of recruitment, data collection, and analysis that appeared. Internal consistencies among study objectives, methods, and findings were achieved in most studies, increasing readers’ confidence that the findings of these studies are credible and useful in understanding under-explored phenomenon of interest.
In summary, our findings support the notion that many scholars employ QD and include a variety of commonly observed characteristics in their study design and subsequent publications. Based on our review, we found that QD as a scholarly approach allows flexibility as research questions and study findings emerge. We encourage authors to provide as many details as possible regarding how QD was chosen for a particular study as well as details regarding methods to facilitate readers’ understanding and evaluation of the study design and rigor. We acknowledge the challenge of strict word limitation with submissions to print journals; potential solutions include collaboration with journal editors and staff to consider creative use of charts or tables, or using more citations and less text in background sections so that methods sections are robust.
Limitations
Several limitations of this review deserve mention. First, only articles where researchers explicitly stated in the main body of the article that a QD design was employed were included. In contrast, articles labeled as QD in only the title or abstract, or without their research design named were not examined due to the lack of certainty that the researchers actually carried out a QD study. As a result, we may have excluded some studies where a QD design was followed. Second, only one database was searched and therefore we did not identify or describe potential studies following a QD approach that were published in non-PubMed databases. Third, our review is limited by reliance on what was included in the published version of a study. In some cases, this may have been a result of word limits or specific styles imposed by journals, or inconsistent reporting preferences of authors and may have limited our ability to appraise the general adequacy with the CASP tool and examine specific characteristics of these studies.
Conclusions
A systematic review was conducted by examining QD research articles focused on nursing-related phenomena and published in one calendar year. Current patterns include some characteristics of QD studies consistent with the previous observations described in the literature, a focus on the flexibility or variability of methods in QD studies, and a need for increased explanations of why QD was an appropriate label for a particular study. Based on these findings, recommendations include encouragement to authors to provide as many details as possible regarding the methods of their QD study. In this way, readers can thoroughly consider and examine if the methods used were effective and reasonable in producing credible and useful findings.
Acknowledgments
This work was supported in part by the John A. Hartford Foundation’s National Hartford Centers of Gerontological Nursing Excellence Award Program.
Hyejin Kim is a Ruth L. Kirschstein NRSA Predoctoral Fellow (F31NR015702) and 2013–2015 National Hartford Centers of Gerontological Nursing Excellence Patricia G. Archbold Scholar. Justine Sefcik is a Ruth L. Kirschstein Predoctoral Fellow (F31NR015693) through the National Institutes of Health, National Institute of Nursing Research.
Conflict of Interest Statement
The Authors declare that there is no conflict of interest.
Contributor Information
Hyejin Kim, MSN, CRNP, Doctoral Candidate, University of Pennsylvania School of Nursing.
Justine S. Sefcik, MS, RN, Doctoral Candidate, University of Pennsylvania School of Nursing.
Christine Bradway, PhD, CRNP, FAAN, Associate Professor of Gerontological Nursing, University of Pennsylvania School of Nursing.
- Adams JA, Anderson RA, Docherty SL, Tulsky JA, Steinhauser KE, Bailey DE., Jr Nursing strategies to support family members of ICU patients at high risk of dying. Heart & Lung. 2014; 43 (5):406–415. [ PMC free article ] [ PubMed ] [ Google Scholar ]
- Ahlin J, Ericson-Lidman E, Norberg A, Strandberg G. Care providers' experiences of guidelines in daily work at a municipal residential care facility for older people. Scandinavian Journal of Caring Sciences. 2014; 28 (2):355–363. [ PubMed ] [ Google Scholar ]
- Al-Zadjali M, Keller C, Larkey L, Evans B. GCC women: causes and processes of midlife weight gain. Health Care for Women International. 2014; 35 (11–12):1267–1286. [ PubMed ] [ Google Scholar ]
- Asemani O, Iman MT, Moattari M, Tabei SZ, Sharif F, Khayyer M. An exploratory study on the elements that might affect medical students' and residents' responsibility during clinical training. Journal of Medical Ethics and History of Medicine. 2014; 7 :8. [ PMC free article ] [ PubMed ] [ Google Scholar ]
- Atefi N, Abdullah KL, Wong LP, Mazlom R. Factors influencing registered nurses perception of their overall job satisfaction: a qualitative study. International Nursing Review. 2014; 61 (3):352–360. [ PubMed ] [ Google Scholar ]
- Ballangrud R, Hall-Lord ML, Persenius M, Hedelin B. Intensive care nurses' perceptions of simulation-based team training for building patient safety in intensive care: a descriptive qualitative study. Intensive and Critical Care Nursing. 2014; 30 (4):179–187. [ PubMed ] [ Google Scholar ]
- Benavides-Vaello S, Katz JR, Peterson JC, Allen CB, Paul R, Charette-Bluff AL, Morris P. Nursing and health sciences workforce diversity research using. PhotoVoice: a college and high school student participatory project. Journal of Nursing Education. 2014; 53 (4):217–222. [ PubMed ] [ Google Scholar ]
- Bernhard C, Zielinski R, Ackerson K, English J. Home birth after hospital birth: women's choices and reflections. Journal of Midwifery and Women's Health. 2014; 59 (2):160–166. [ PubMed ] [ Google Scholar ]
- Borbasi S, Jackson D, Langford RW. Navigating the maze of nursing research: An interactive learning adventure. 2nd. New South Wales, Australia: Mosby/Elsevier; 2008. [ Google Scholar ]
- Bradford B, Maude R. Fetal response to maternal hunger and satiation - novel finding from a qualitative descriptive study of maternal perception of fetal movements. BMC Pregnancy and Childbirth. 2014; 14 :288. [ PMC free article ] [ PubMed ] [ Google Scholar ]
- Burns N, Grove SK. The practice of nursing research: Conduct, critique, & utilization. 5th. Philadelphia, PA: Elsevier/Saunders; 2005. [ Google Scholar ]
- Canzan F, Heilemann MV, Saiani L, Mortari L, Ambrosi E. Visible and invisible caring in nursing from the perspectives of patients and nurses in the gerontological context. Scandinavian Journal of Caring Sciences. 2014; 28 (4):732–740. [ PubMed ] [ Google Scholar ]
- Carter SM, Littler M. Justifying knowledge, justifying methods, taking action: Epistemologies, methodologies, and methods in qualitative research. Qualitative Health Research. 2007; 17 (10):1316–1328. [ PubMed ] [ Google Scholar ]
- Critical Appraisal Skills Programme (CASP 2013) 10 questions to help you make sense of qualitative research. Oxford: CASP; 2013. Retrieved from http://media.wix.com/ugd/dded87_29c5b002d99342f788c6ac670e49f274.pdf . [ Google Scholar ]
- Chan CW, Lopez V. A qualitative descriptive study of risk reduction for coronary disease among the Hong Kong Chinese. Public Health Nursing. 2014; 31 (4):327–335. [ PubMed ] [ Google Scholar ]
- Chen YJ, Tsai YF, Lee SH, Lee HL. Protective factors against suicide among young-old Chinese outpatients. BMC Public Health. 2014; 14 :372. [ PMC free article ] [ PubMed ] [ Google Scholar ]
- Cleveland LM, Bonugli R. Experiences of mothers of infants with neonatal abstinence syndrome in the neonatal intensive care unit. Journal of Obstetric Gynecologic, & Neonatal Nursing. 2014; 43 (3):318–329. [ PubMed ] [ Google Scholar ]
- Corbin J, Strauss A. Basics of qualitative research: Techniques and procedures for developing grounded theory. 3rd. Thousand Oaks, CA: Sage Publications; 2008. [ Google Scholar ]
- Corbin JM, Strauss A. Grounded theory research: Procedures, canons and evaluation criteria. Qualitative Sociology. 1990; 13 (1):3–21. [ Google Scholar ]
- DeBruyn RR, Ochoa-Marin SC, Semenic S. Barriers and facilitators to evidence-based nursing in Colombia: perspectives of nurse educators, nurse researchers and graduate students. Investigación y Educación en Enfermería. 2014; 32 (1):9–21. [ PubMed ] [ Google Scholar ]
- Denzin NK, Lincoln YS. The Discipline and practice of qualitative research. In: Denzin NK, Lincoln YS, editors. Handbook of qualitative research. 2nd. Thousand Oaks, CA: Sage Publications; 2000. pp. 1–28. [ Google Scholar ]
- Ewens B, Chapman R, Tulloch A, Hendricks JM. ICU survivors' utilisation of diaries post discharge: a qualitative descriptive study. Australian Critical Care. 2014; 27 (1):28–35. [ PubMed ] [ Google Scholar ]
- Fantasia HC, Sutherland MA, Fontenot H, Ierardi JA. Knowledge, attitudes and beliefs about contraceptive and sexual consent negotiation among college women. Journal of Forensic Nursing. 2014; 10 (4):199–207. [ PubMed ] [ Google Scholar ]
- Friman A, Wahlberg AC, Mattiasson AC, Ebbeskog B. District nurses' knowledge development in wound management: ongoing learning without organizational support. Primary Health Care Research & Development. 2014; 15 (4):386–395. [ PubMed ] [ Google Scholar ]
- Gaughan V, Logan D, Sethna N, Mott S. Parents' perspective of their journey caring for a child with chronic neuropathic pain. Pain Management Nursing. 2014; 15 (1):246–257. [ PubMed ] [ Google Scholar ]
- Hammersley M. The issue of quality in qualitative research. International Journal of Research & Method in Education. 2007; 30 (3):287–305. [ Google Scholar ]
- Hart PL, Mareno N. Cultural challenges and barriers through the voices of nurses. Journal of Clinical Nursing. 2014; 23 (15–16):2223–2232. [ PubMed ] [ Google Scholar ]
- Hasman K, Kjaergaard H, Esbensen BA. Fathers' experience of childbirth when non-progressive labour occurs and augmentation is established. A qualitative study. Sexual & Reproductive HealthCare. 2014; 5 (2):69–73. [ PubMed ] [ Google Scholar ]
- Higgins I, van der Riet P, Sneesby L, Good P. Nutrition and hydration in dying patients: the perceptions of acute care nurses. Journal of Clinical Nursing. 2014; 23 (17–18):2609–2617. [ PubMed ] [ Google Scholar ]
- Holland ML, Christensen JJ, Shone LP, Kearney MH, Kitzman HJ. Women's reasons for attrition from a nurse home visiting program. Journal of Obstetric, Gynecologic, & Neonatal Nursing. 2014; 43 (1):61–70. [ PMC free article ] [ PubMed ] [ Google Scholar ]
- Johansson M, Hildingsson I, Fenwick J. 'As long as they are safe--birth mode does not matter' Swedish fathers' experiences of decision-making around caesarean section. Women and Birth. 2014; 27 (3):208–213. [ PubMed ] [ Google Scholar ]
- Kao MH, Tsai YF. Illness experiences in middle-aged adults with early-stage knee osteoarthritis: findings from a qualitative study. Journal of Advanced Nursing. 2014; 70 (7):1564–1572. [ PubMed ] [ Google Scholar ]
- Kawulich BB. Participant observation as a data collection method. Forum: Qualitative Social Research. 2005; 6 (2) Art. 43. Retrieved from http://www.qualitative-research.net/index.php/fqs/article/view/466/997 . [ Google Scholar ]
- Kerr D, McKay K, Klim S, Kelly AM, McCann T. Attitudes of emergency department patients about handover at the bedside. Journal of Clinical Nursing. 2014; 23 (11–12):1685–1693. [ PubMed ] [ Google Scholar ]
- Kneck A, Fagerberg I, Eriksson LE, Lundman B. Living with diabetes - development of learning patterns over a 3-year period. International Journal of Qualitative Studies on Health and Well-being. 2014; 9 :24375. [ PMC free article ] [ PubMed ] [ Google Scholar ]
- Krippendorf K. Content analysis: An introduction to its methodology. 2nd. Thousand Oaks, CA: Sage Publications; 2004. [ Google Scholar ]
- Larocque N, Schotsman C, Kaasalainen S, Crawshaw D, McAiney C, Brazil E. Using a book chat to improve attitudes and perceptions of long-term care staff about dementia. Journal of Gerontological Nursing. 2014; 40 (5):46–52. [ PubMed ] [ Google Scholar ]
- Li IC, Lee SY, Chen CY, Jeng YQ, Chen YC. Facilitators and barriers to effective smoking cessation: counselling services for inpatients from nurse-counsellors' perspectives--a qualitative study. International Journal of Environmental Research and Public Health. 2014; 11 (5):4782–4798. [ PMC free article ] [ PubMed ] [ Google Scholar ]
- Lux KM, Hutcheson JB, Peden AR. Ending disruptive behavior: staff nurse recommendations to nurse educators. Nurse Education in Practice. 2014; 14 (1):37–42. [ PubMed ] [ Google Scholar ]
- Lyndon A, Zlatnik MG, Maxfield DG, Lewis A, McMillan C, Kennedy HP. Contributions of clinical disconnections and unresolved conflict to failures in intrapartum safety. Journal of Obstetric, Gynecologic, & Neonatal Nursing. 2014; 43 (1):2–12. [ PMC free article ] [ PubMed ] [ Google Scholar ]
- Ma F, Li J, Liang H, Bai Y, Song J. Baccalaureate nursing students' perspectives on learning about caring in China: a qualitative descriptive study. BMC Medical Education. 2014; 14 :42. [ PMC free article ] [ PubMed ] [ Google Scholar ]
- Ma L. A humanbecoming qualitative descriptive study on quality of life with older adults. Nursing Science Quarterly. 2014; 27 (2):132–141. [ PubMed ] [ Google Scholar ]
- Marcinowicz L, Abramowicz P, Zarzycka D, Abramowicz M, Konstantynowicz J. How hospitalized children and parents perceive nurses and hospital amenities: A qualitative descriptive study in Poland. Journal of Child Health Care. 2014 [ PubMed ] [ Google Scholar ]
- Martorella G, Boitor M, Michaud C, Gelinas C. Feasibility and acceptability of hand massage therapy for pain management of postoperative cardiac surgery patients in the intensive care unit. Heart & Lung. 2014; 43 (5):437–444. [ PubMed ] [ Google Scholar ]
- McDonough A, Callans KM, Carroll DL. Understanding the challenges during transitions of care for children with critical airway conditions. ORL Head and Neck Nursing. 2014; 32 (4):12–17. [ PubMed ] [ Google Scholar ]
- McGilton KS, Boscart VM, Brown M, Bowers B. Making tradeoffs between the reasons to leave and reasons to stay employed in long-term care homes: perspectives of licensed nursing staff. International Journal of Nursing Studies. 2014; 51 (6):917–926. [ PubMed ] [ Google Scholar ]
- Michael N, O'Callaghan C, Baird A, Hiscock N, Clayton J. Cancer caregivers advocate a patient- and family-centered approach to advance care planning. Journal of Pain and Symptom Management. 2014; 47 (6):1064–1077. [ PubMed ] [ Google Scholar ]
- Miller WR. Patient-centered outcomes in older adults with epilepsy. Seizure. 2014; 23 (8):592–597. [ PMC free article ] [ PubMed ] [ Google Scholar ]
- Milne J, Oberle K. Enhancing rigor in qualitative description: a case study. Journal of Wound Ostomy & Continence Nursing. 2005; 32 (6):413–420. [ PubMed ] [ Google Scholar ]
- Neergaard MA, Olesen F, Andersen RS, Sondergaard J. Qualitative description - the poor cousin of health research? BMC Medical Research Methodology. 2009; 9 :52. [ PMC free article ] [ PubMed ] [ Google Scholar ]
- O'Shea MF. Staff nurses' perceptions regarding palliative care for hospitalized older adults. The American Journal of Nursing. 2014; 114 (11):26–34. [ PubMed ] [ Google Scholar ]
- Oosterveld-Vlug MG, Pasman HR, van Gennip IE, Muller MT, Willems DL, Onwuteaka-Philipsen BD. Dignity and the factors that influence it according to nursing home residents: a qualitative interview study. Journal of Advanced Nursing. 2014; 70 (1):97–106. [ PubMed ] [ Google Scholar ]
- Oruche UM, Draucker C, Alkhattab H, Knopf A, Mazurcyk J. Interventions for family members of adolescents with disruptive behavior disorders. Journal of Child and Adolescent Psychiatric Nursing. 2014; 27 (3):99–108. [ PMC free article ] [ PubMed ] [ Google Scholar ]
- Parse RR. Qualitative inquiry: The path of sciencing. Sudbury, MA: Jones and Barlett; 2001. [ Google Scholar ]
- Peacock SC, Hammond-Collins K, Forbes DA. The journey with dementia from the perspective of bereaved family caregivers: a qualitative descriptive study. BMC Nursing. 2014; 13 (1):42. [ PMC free article ] [ PubMed ] [ Google Scholar ]
- Peterson WE, Sprague AE, Reszel J, Walker M, Fell DB, Perkins SL, Johnson M. Women's perspectives of the fetal fibronectin testing process: a qualitative descriptive study. BMC Pregnancy and Childbirth. 2014; 14 :190. [ PMC free article ] [ PubMed ] [ Google Scholar ]
- Polit DF, Beck CT. Nursing research: principles and methods. 7. Philadelphia, PA: Lippincott Williams & Wilkins; 2004. [ Google Scholar ]
- Polit DF, Beck CT. International differences in nursing research, 2005–2006. Journal of Nursing Scholarship. 2009; 41 (1):44–53. [ PubMed ] [ Google Scholar ]
- Polit DF, Beck CT. Nursing research: generating and assessing evidence for nursing practice. 9. Philadelphia, PA: Wolters Kluwer Health/Lippincott Williams & Wilkins; 2012. [ Google Scholar ]
- Polit DF, Beck CT. Essentials of Nursing Research: Appraising Evidence for Nursing Practice. 8. Philadelphia, PA: Wolters Kluwer Health; Lippincott Willians & Wilkins; 2014. Supplement for Chapter 14: Qualitative Descriptive Studies. Retrieved from http://downloads.lww.com/wolterskluwer_vitalstream_com/sample-content/9781451176797_Polit/samples/CS_Chapter_14.pdf . [ Google Scholar ]
- Pope C, Mays N. Qualitative research in health care. 3rd. Victoria, Australia: Blackwell Publishing; 2006. [ Google Scholar ]
- Pope C, Mays N. Reaching the parts other methods cannot reach: an introduction to qualitative methods in health and health services research. BMJ. 1995; 311 (6996):42–45. [ PMC free article ] [ PubMed ] [ Google Scholar ]
- Raphael D, Waterworth S, Gott M. The role of practice nurses in providing palliative and end-of-life care to older patients with long-term conditions. International Journal of Palliative Nursing. 2014; 20 (8):373–379. [ PubMed ] [ Google Scholar ]
- Saldana J. Longitudinal qualitative research: Analyzing change through time. Walnut Creek, CA: AltaMira Press; 2003. [ Google Scholar ]
- Sandelowski M. Whatever happened to qualitative description? Research in Nursing & Health. 2000; 23 (4):334–340. [ PubMed ] [ Google Scholar ]
- Sandelowski M. What's in a name? Qualitative description revisited. Research in Nursing & Health. 2010; 33 (1):77–84. [ PubMed ] [ Google Scholar ]
- Santos HP, Jr, Sandelowski M, Gualda DM. Bad thoughts: Brazilian women's responses to mothering while experiencing postnatal depression. Midwifery. 2014; 30 (6):788–794. [ PubMed ] [ Google Scholar ]
- Sharp R, Grech C, Fielder A, Mikocka-Walus A, Cummings M, Esterman A. The patient experience of a peripherally inserted central catheter (PICC): A qualitative descriptive study. Contemporary Nurse. 2014; 48 (1):26–35. [ PubMed ] [ Google Scholar ]
- Soule I. Cultural competence in health care: an emerging theory. ANS Advances in Nursing Science. 2014; 37 (1):48–60. [ PubMed ] [ Google Scholar ]
- Stegenga K, Macpherson CF. "I'm a survivor, go study that word and you'll see my name": adolescent and cancer identity work over the first year after diagnosis. Cancer Nursing. 2014; 37 (6):418–428. [ PubMed ] [ Google Scholar ]
- Streubert HJ, Carpenter DR. Qualitative research in nursing: Advancing the humanistic imperative. 5th. Philadelphia, PA: Lippincott Williams & Wilkins; 2011. [ Google Scholar ]
- Sturesson A, Ziegert K. Prepare the patient for future challenges when facing hemodialysis: nurses' experiences. International Journal of Qualitative Studies on Health and Well-being. 2014; 9 :22952. [ PMC free article ] [ PubMed ] [ Google Scholar ]
- Sullivan-Bolyai S, Bova C, Harper D. Developing and refining interventions in persons with health disparities: the use of qualitative description. Nursing Outlook. 2005; 53 (3):127–133. [ PubMed ] [ Google Scholar ]
- Sundqvist AS, Carlsson AA. Holding the patient's life in my hands: Swedish registered nurse anaesthetists' perspective of advocacy. Scandinavian Journal of Caring Sciences. 2014; 28 (2):281–288. [ PubMed ] [ Google Scholar ]
- Thomson Reuters. EndNote X7. 2014 Retrieved from http://endnote.com/product-details/x7 .
- Thorne S. Data analysis in qualitative research. Evidence Based Nursing. 2000; 3 :68–70. [ Google Scholar ]
- Thorne S, Reimer Kirkham S, O’Flynn-Magee K. The analytic challenge in interpretive description. International Journal of Qualitative Methods. 2004; 3 (1):1–11. [ Google Scholar ]
- Tseng YF, Chen CH, Wang HH. Taiwanese women's process of recovery from stillbirth: a qualitative descriptive study. Research in Nursing & Health. 2014; 37 (3):219–228. [ PubMed ] [ Google Scholar ]
- Vaismoradi M, Jordan S, Turunen H, Bondas T. Nursing students' perspectives of the cause of medication errors. Nurse Education Today. 2014; 34 (3):434–440. [ PubMed ] [ Google Scholar ]
- Vaismoradi M, Turunen H, Bondas T. Content analysis and thematic analysis: Implications for conducting a qualitative descriptive study. Nursing & Health Sciences. 2013; 15 (3):398–405. [ PubMed ] [ Google Scholar ]
- Valizadeh L, Zamanzadeh V, Fooladi MM, Azadi A, Negarandeh R, Monadi M. The image of nursing, as perceived by Iranian male nurses. Nursing & Health Sciences. 2014; 16 (3):307–313. [ PubMed ] [ Google Scholar ]
- Villar F, Celdran M, Faba J, Serrat R. Barriers to sexual expression in residential aged care facilities (RACFs): comparison of staff and residents' views. Journal of Advanced Nursing. 2014; 70 (11):2518–2527. [ PubMed ] [ Google Scholar ]
- Wiens S, Babenko-Mould Y, Iwasiw C. Clinical instructors' perceptions of structural and psychological empowerment in academic nursing environments. Journal of Nursing Education. 2014; 53 (5):265–270. [ PubMed ] [ Google Scholar ]
- Willis DG, Sullivan-Bolyai S, Knafl K, Zichi-Cohen M. Distinguishing Features and Similarities Between Descriptive Phenomenological and Qualitative Description Research. West J Nurs Res. 2016 [ PubMed ] [ Google Scholar ]
- Wu YP, Thompson D, Aroian KJ, McQuaid EL, Deatrick JA. Commentary: Writing and Evaluating Qualitative Research Reports. J Pediatr Psychol. 2016; 41 (5):493–505. [ PMC free article ] [ PubMed ] [ Google Scholar ]
- Zhang H, Shan W, Jiang A. The meaning of life and health experience for the Chinese elderly with chronic illness: a qualitative study from positive health philosophy. International Journal of Nursing Practice. 2014; 20 (5):530–539. [ PubMed ] [ Google Scholar ]
Want to create or adapt books like this? Learn more about how Pressbooks supports open publishing practices.
Chapter 3: Developing a Research Question
3.2 Exploration, Description, Explanation
As you can see, there is much to think about and many decisions to be made as you begin to define your research question and your research project. Something else you will need to consider in the early stages is whether your research will be exploratory, descriptive, or explanatory. Each of these types of research has a different aim or purpose, consequently, how you design your research project will be determined in part by this decision. In the following paragraphs we will look at these three types of research.
Exploratory research
Researchers conducting exploratory research are typically at the early stages of examining their topics. These sorts of projects are usually conducted when a researcher wants to test the feasibility of conducting a more extensive study; he or she wants to figure out the lay of the land with respect to the particular topic. Perhaps very little prior research has been conducted on this subject. If this is the case, a researcher may wish to do some exploratory work to learn what method to use in collecting data, how best to approach research participants, or even what sorts of questions are reasonable to ask. A researcher wanting to simply satisfy his or her own curiosity about a topic could also conduct exploratory research. Conducting exploratory research on a topic is often a necessary first step, both to satisfy researcher curiosity about the subject and to better understand the phenomenon and the research participants in order to design a larger, subsequent study. See Table 2.1 for examples.
Descriptive research
Sometimes the goal of research is to describe or define a particular phenomenon. In this case, descriptive research would be an appropriate strategy. A descriptive may, for example, aim to describe a pattern. For example, researchers often collect information to describe something for the benefit of the general public. Market researchers rely on descriptive research to tell them what consumers think of their products. In fact, descriptive research has many useful applications, and you probably rely on findings from descriptive research without even being aware that that is what you are doing. See Table 3.1 for examples.
Explanatory research
The third type of research, explanatory research, seeks to answer “why” questions. In this case, the researcher is trying to identify the causes and effects of whatever phenomenon is being studied. An explanatory study of college students’ addictions to their electronic gadgets, for example, might aim to understand why students become addicted. Does it have anything to do with their family histories? Does it have anything to do with their other extracurricular hobbies and activities? Does it have anything to do with the people with whom they spend their time? An explanatory study could answer these kinds of questions. See Table 3.1 for examples.
Table 3.1 Exploratory, descriptive and explanatory research differences (Adapted from Adjei, n.d.).
| Degree of Problem Definition | Key variables not define | Key variables not define | Key variables not define |
| “The quality of service is declining and we don’t know why.” | “What have been the trends in organizational downsizing over the past ten years?” | “Which of two training programs is more effective for reducing labour turnover? | |
| “Would people be interested in our new product idea? | “Did last year’s product recall have an impact on our company’s share price?” | “Can I predict the value of energy stocks if I know the current dividends and growth rates of dividends?” | |
| “How important is business process reengineering as a strategy? | “Has the average merger rate for financial institutions increased in the past decade?” | “Do buyers prefer our product in a new package?” |
Research Methods for the Social Sciences: An Introduction Copyright © 2020 by Valerie Sheppard is licensed under a Creative Commons Attribution-NonCommercial-ShareAlike 4.0 International License , except where otherwise noted.
Share This Book
Want to create or adapt books like this? Learn more about how Pressbooks supports open publishing practices.
Chapter 3. Psychological Science
3.2 Psychologists Use Descriptive, Correlational, and Experimental Research Designs to Understand Behaviour
Learning objectives.
- Differentiate the goals of descriptive, correlational, and experimental research designs and explain the advantages and disadvantages of each.
- Explain the goals of descriptive research and the statistical techniques used to interpret it.
- Summarize the uses of correlational research and describe why correlational research cannot be used to infer causality.
- Review the procedures of experimental research and explain how it can be used to draw causal inferences.
Psychologists agree that if their ideas and theories about human behaviour are to be taken seriously, they must be backed up by data. However, the research of different psychologists is designed with different goals in mind, and the different goals require different approaches. These varying approaches, summarized in Table 3.2, are known as research designs . A research design is the specific method a researcher uses to collect, analyze, and interpret data . Psychologists use three major types of research designs in their research, and each provides an essential avenue for scientific investigation. Descriptive research is research designed to provide a snapshot of the current state of affairs . Correlational research is research designed to discover relationships among variables and to allow the prediction of future events from present knowledge . Experimental research is research in which initial equivalence among research participants in more than one group is created, followed by a manipulation of a given experience for these groups and a measurement of the influence of the manipulation . Each of the three research designs varies according to its strengths and limitations, and it is important to understand how each differs.
| Research design | Goal | Advantages | Disadvantages |
|---|---|---|---|
| Descriptive | To create a snapshot of the current state of affairs | Provides a relatively complete picture of what is occurring at a given time. Allows the development of questions for further study. | Does not assess relationships among variables. May be unethical if participants do not know they are being observed. |
| Correlational | To assess the relationships between and among two or more variables | Allows testing of expected relationships between and among variables and the making of predictions. Can assess these relationships in everyday life events. | Cannot be used to draw inferences about the causal relationships between and among the variables. |
| Experimental | To assess the causal impact of one or more experimental manipulations on a dependent variable | Allows drawing of conclusions about the causal relationships among variables. | Cannot experimentally manipulate many important variables. May be expensive and time consuming. |
| Source: Stangor, 2011. | |||
Descriptive Research: Assessing the Current State of Affairs
Descriptive research is designed to create a snapshot of the current thoughts, feelings, or behaviour of individuals. This section reviews three types of descriptive research : case studies , surveys , and naturalistic observation (Figure 3.4).
Sometimes the data in a descriptive research project are based on only a small set of individuals, often only one person or a single small group. These research designs are known as case studies — descriptive records of one or more individual’s experiences and behaviour . Sometimes case studies involve ordinary individuals, as when developmental psychologist Jean Piaget used his observation of his own children to develop his stage theory of cognitive development. More frequently, case studies are conducted on individuals who have unusual or abnormal experiences or characteristics or who find themselves in particularly difficult or stressful situations. The assumption is that by carefully studying individuals who are socially marginal, who are experiencing unusual situations, or who are going through a difficult phase in their lives, we can learn something about human nature.
Sigmund Freud was a master of using the psychological difficulties of individuals to draw conclusions about basic psychological processes. Freud wrote case studies of some of his most interesting patients and used these careful examinations to develop his important theories of personality. One classic example is Freud’s description of “Little Hans,” a child whose fear of horses the psychoanalyst interpreted in terms of repressed sexual impulses and the Oedipus complex (Freud, 1909/1964).
Another well-known case study is Phineas Gage, a man whose thoughts and emotions were extensively studied by cognitive psychologists after a railroad spike was blasted through his skull in an accident. Although there are questions about the interpretation of this case study (Kotowicz, 2007), it did provide early evidence that the brain’s frontal lobe is involved in emotion and morality (Damasio et al., 2005). An interesting example of a case study in clinical psychology is described by Rokeach (1964), who investigated in detail the beliefs of and interactions among three patients with schizophrenia, all of whom were convinced they were Jesus Christ.
In other cases the data from descriptive research projects come in the form of a survey — a measure administered through either an interview or a written questionnaire to get a picture of the beliefs or behaviours of a sample of people of interest . The people chosen to participate in the research (known as the sample) are selected to be representative of all the people that the researcher wishes to know about (the population). In election polls, for instance, a sample is taken from the population of all “likely voters” in the upcoming elections.
The results of surveys may sometimes be rather mundane, such as “Nine out of 10 doctors prefer Tymenocin” or “The median income in the city of Hamilton is $46,712.” Yet other times (particularly in discussions of social behaviour), the results can be shocking: “More than 40,000 people are killed by gunfire in the United States every year” or “More than 60% of women between the ages of 50 and 60 suffer from depression.” Descriptive research is frequently used by psychologists to get an estimate of the prevalence (or incidence ) of psychological disorders.
A final type of descriptive research — known as naturalistic observation — is research based on the observation of everyday events . For instance, a developmental psychologist who watches children on a playground and describes what they say to each other while they play is conducting descriptive research, as is a biopsychologist who observes animals in their natural habitats. One example of observational research involves a systematic procedure known as the strange situation , used to get a picture of how adults and young children interact. The data that are collected in the strange situation are systematically coded in a coding sheet such as that shown in Table 3.3.
| Coder name: | ||||
| This table represents a sample coding sheet from an episode of the “strange situation,” in which an infant (usually about one year old) is observed playing in a room with two adults — the child’s mother and a stranger. Each of the four coding categories is scored by the coder from 1 (the baby makes no effort to engage in the behaviour) to 7 (the baby makes a significant effort to engage in the behaviour). More information about the meaning of the coding can be found in Ainsworth, Blehar, Waters, and Wall (1978). | ||||
| Coding categories explained | ||||
| Proximity | The baby moves toward, grasps, or climbs on the adult. | |||
| Maintaining contact | The baby resists being put down by the adult by crying or trying to climb back up. | |||
| Resistance | The baby pushes, hits, or squirms to be put down from the adult’s arms. | |||
| Avoidance | The baby turns away or moves away from the adult. | |||
| Episode | Coding categories | |||
|---|---|---|---|---|
| Proximity | Contact | Resistance | Avoidance | |
| Mother and baby play alone | 1 | 1 | 1 | 1 |
| Mother puts baby down | 4 | 1 | 1 | 1 |
| Stranger enters room | 1 | 2 | 3 | 1 |
| Mother leaves room; stranger plays with baby | 1 | 3 | 1 | 1 |
| Mother re-enters, greets and may comfort baby, then leaves again | 4 | 2 | 1 | 2 |
| Stranger tries to play with baby | 1 | 3 | 1 | 1 |
| Mother re-enters and picks up baby | 6 | 6 | 1 | 2 |
| Source: Stang0r, 2011. | ||||
The results of descriptive research projects are analyzed using descriptive statistics — numbers that summarize the distribution of scores on a measured variable . Most variables have distributions similar to that shown in Figure 3.5 where most of the scores are located near the centre of the distribution, and the distribution is symmetrical and bell-shaped. A data distribution that is shaped like a bell is known as a normal distribution .
A distribution can be described in terms of its central tendency — that is, the point in the distribution around which the data are centred — and its dispersion, or spread . The arithmetic average, or arithmetic mean , symbolized by the letter M , is the most commonly used measure of central tendency . It is computed by calculating the sum of all the scores of the variable and dividing this sum by the number of participants in the distribution (denoted by the letter N ). In the data presented in Figure 3.5 the mean height of the students is 67.12 inches (170.5 cm). The sample mean is usually indicated by the letter M .
In some cases, however, the data distribution is not symmetrical. This occurs when there are one or more extreme scores (known as outliers ) at one end of the distribution. Consider, for instance, the variable of family income (see Figure 3.6), which includes an outlier (a value of $3,800,000). In this case the mean is not a good measure of central tendency. Although it appears from Figure 3.6 that the central tendency of the family income variable should be around $70,000, the mean family income is actually $223,960. The single very extreme income has a disproportionate impact on the mean, resulting in a value that does not well represent the central tendency.
The median is used as an alternative measure of central tendency when distributions are not symmetrical. The median is the score in the center of the distribution, meaning that 50% of the scores are greater than the median and 50% of the scores are less than the median . In our case, the median household income ($73,000) is a much better indication of central tendency than is the mean household income ($223,960).
A final measure of central tendency, known as the mode , represents the value that occurs most frequently in the distribution . You can see from Figure 3.6 that the mode for the family income variable is $93,000 (it occurs four times).
In addition to summarizing the central tendency of a distribution, descriptive statistics convey information about how the scores of the variable are spread around the central tendency. Dispersion refers to the extent to which the scores are all tightly clustered around the central tendency , as seen in Figure 3.7.
Or they may be more spread out away from it, as seen in Figure 3.8.
One simple measure of dispersion is to find the largest (the maximum ) and the smallest (the minimum ) observed values of the variable and to compute the range of the variable as the maximum observed score minus the minimum observed score. You can check that the range of the height variable in Figure 3.5 is 72 – 62 = 10. The standard deviation , symbolized as s , is the most commonly used measure of dispersion . Distributions with a larger standard deviation have more spread. The standard deviation of the height variable is s = 2.74, and the standard deviation of the family income variable is s = $745,337.
An advantage of descriptive research is that it attempts to capture the complexity of everyday behaviour. Case studies provide detailed information about a single person or a small group of people, surveys capture the thoughts or reported behaviours of a large population of people, and naturalistic observation objectively records the behaviour of people or animals as it occurs naturally. Thus descriptive research is used to provide a relatively complete understanding of what is currently happening.
Despite these advantages, descriptive research has a distinct disadvantage in that, although it allows us to get an idea of what is currently happening, it is usually limited to static pictures. Although descriptions of particular experiences may be interesting, they are not always transferable to other individuals in other situations, nor do they tell us exactly why specific behaviours or events occurred. For instance, descriptions of individuals who have suffered a stressful event, such as a war or an earthquake, can be used to understand the individuals’ reactions to the event but cannot tell us anything about the long-term effects of the stress. And because there is no comparison group that did not experience the stressful situation, we cannot know what these individuals would be like if they hadn’t had the stressful experience.
Correlational Research: Seeking Relationships among Variables
In contrast to descriptive research, which is designed primarily to provide static pictures, correlational research involves the measurement of two or more relevant variables and an assessment of the relationship between or among those variables. For instance, the variables of height and weight are systematically related (correlated) because taller people generally weigh more than shorter people. In the same way, study time and memory errors are also related, because the more time a person is given to study a list of words, the fewer errors he or she will make. When there are two variables in the research design, one of them is called the predictor variable and the other the outcome variable . The research design can be visualized as shown in Figure 3.9, where the curved arrow represents the expected correlation between these two variables.
One way of organizing the data from a correlational study with two variables is to graph the values of each of the measured variables using a scatter plot . As you can see in Figure 3.10 a scatter plot is a visual image of the relationship between two variables . A point is plotted for each individual at the intersection of his or her scores for the two variables. When the association between the variables on the scatter plot can be easily approximated with a straight line , as in parts (a) and (b) of Figure 3.10 the variables are said to have a linear relationship .
When the straight line indicates that individuals who have above-average values for one variable also tend to have above-average values for the other variable , as in part (a), the relationship is said to be positive linear . Examples of positive linear relationships include those between height and weight, between education and income, and between age and mathematical abilities in children. In each case, people who score higher on one of the variables also tend to score higher on the other variable. Negative linear relationships , in contrast, as shown in part (b), occur when above-average values for one variable tend to be associated with below-average values for the other variable. Examples of negative linear relationships include those between the age of a child and the number of diapers the child uses, and between practice on and errors made on a learning task. In these cases, people who score higher on one of the variables tend to score lower on the other variable.
Relationships between variables that cannot be described with a straight line are known as nonlinear relationships . Part (c) of Figure 3.10 shows a common pattern in which the distribution of the points is essentially random. In this case there is no relationship at all between the two variables, and they are said to be independent . Parts (d) and (e) of Figure 3.10 show patterns of association in which, although there is an association, the points are not well described by a single straight line. For instance, part (d) shows the type of relationship that frequently occurs between anxiety and performance. Increases in anxiety from low to moderate levels are associated with performance increases, whereas increases in anxiety from moderate to high levels are associated with decreases in performance. Relationships that change in direction and thus are not described by a single straight line are called curvilinear relationships .
The most common statistical measure of the strength of linear relationships among variables is the Pearson correlation coefficient , which is symbolized by the letter r . The value of the correlation coefficient ranges from r = –1.00 to r = +1.00. The direction of the linear relationship is indicated by the sign of the correlation coefficient. Positive values of r (such as r = .54 or r = .67) indicate that the relationship is positive linear (i.e., the pattern of the dots on the scatter plot runs from the lower left to the upper right), whereas negative values of r (such as r = –.30 or r = –.72) indicate negative linear relationships (i.e., the dots run from the upper left to the lower right). The strength of the linear relationship is indexed by the distance of the correlation coefficient from zero (its absolute value). For instance, r = –.54 is a stronger relationship than r = .30, and r = .72 is a stronger relationship than r = –.57. Because the Pearson correlation coefficient only measures linear relationships, variables that have curvilinear relationships are not well described by r , and the observed correlation will be close to zero.
It is also possible to study relationships among more than two measures at the same time. A research design in which more than one predictor variable is used to predict a single outcome variable is analyzed through multiple regression (Aiken & West, 1991). Multiple regression is a statistical technique, based on correlation coefficients among variables, that allows predicting a single outcome variable from more than one predictor variable . For instance, Figure 3.11 shows a multiple regression analysis in which three predictor variables (Salary, job satisfaction, and years employed) are used to predict a single outcome (job performance). The use of multiple regression analysis shows an important advantage of correlational research designs — they can be used to make predictions about a person’s likely score on an outcome variable (e.g., job performance) based on knowledge of other variables.
An important limitation of correlational research designs is that they cannot be used to draw conclusions about the causal relationships among the measured variables. Consider, for instance, a researcher who has hypothesized that viewing violent behaviour will cause increased aggressive play in children. He has collected, from a sample of Grade 4 children, a measure of how many violent television shows each child views during the week, as well as a measure of how aggressively each child plays on the school playground. From his collected data, the researcher discovers a positive correlation between the two measured variables.
Although this positive correlation appears to support the researcher’s hypothesis, it cannot be taken to indicate that viewing violent television causes aggressive behaviour. Although the researcher is tempted to assume that viewing violent television causes aggressive play, there are other possibilities. One alternative possibility is that the causal direction is exactly opposite from what has been hypothesized. Perhaps children who have behaved aggressively at school develop residual excitement that leads them to want to watch violent television shows at home (Figure 3.13):
Although this possibility may seem less likely, there is no way to rule out the possibility of such reverse causation on the basis of this observed correlation. It is also possible that both causal directions are operating and that the two variables cause each other (Figure 3.14).
Still another possible explanation for the observed correlation is that it has been produced by the presence of a common-causal variable (also known as a third variable ). A common-causal variable is a variable that is not part of the research hypothesis but that causes both the predictor and the outcome variable and thus produces the observed correlation between them . In our example, a potential common-causal variable is the discipline style of the children’s parents. Parents who use a harsh and punitive discipline style may produce children who like to watch violent television and who also behave aggressively in comparison to children whose parents use less harsh discipline (Figure 3.15)
In this case, television viewing and aggressive play would be positively correlated (as indicated by the curved arrow between them), even though neither one caused the other but they were both caused by the discipline style of the parents (the straight arrows). When the predictor and outcome variables are both caused by a common-causal variable, the observed relationship between them is said to be spurious . A spurious relationship is a relationship between two variables in which a common-causal variable produces and “explains away” the relationship . If effects of the common-causal variable were taken away, or controlled for, the relationship between the predictor and outcome variables would disappear. In the example, the relationship between aggression and television viewing might be spurious because by controlling for the effect of the parents’ disciplining style, the relationship between television viewing and aggressive behaviour might go away.
Common-causal variables in correlational research designs can be thought of as mystery variables because, as they have not been measured, their presence and identity are usually unknown to the researcher. Since it is not possible to measure every variable that could cause both the predictor and outcome variables, the existence of an unknown common-causal variable is always a possibility. For this reason, we are left with the basic limitation of correlational research: correlation does not demonstrate causation. It is important that when you read about correlational research projects, you keep in mind the possibility of spurious relationships, and be sure to interpret the findings appropriately. Although correlational research is sometimes reported as demonstrating causality without any mention being made of the possibility of reverse causation or common-causal variables, informed consumers of research, like you, are aware of these interpretational problems.
In sum, correlational research designs have both strengths and limitations. One strength is that they can be used when experimental research is not possible because the predictor variables cannot be manipulated. Correlational designs also have the advantage of allowing the researcher to study behaviour as it occurs in everyday life. And we can also use correlational designs to make predictions — for instance, to predict from the scores on their battery of tests the success of job trainees during a training session. But we cannot use such correlational information to determine whether the training caused better job performance. For that, researchers rely on experiments.
Experimental Research: Understanding the Causes of Behaviour
The goal of experimental research design is to provide more definitive conclusions about the causal relationships among the variables in the research hypothesis than is available from correlational designs. In an experimental research design, the variables of interest are called the independent variable (or variables ) and the dependent variable . The independent variable in an experiment is the causing variable that is created (manipulated) by the experimenter . The dependent variable in an experiment is a measured variable that is expected to be influenced by the experimental manipulation . The research hypothesis suggests that the manipulated independent variable or variables will cause changes in the measured dependent variables. We can diagram the research hypothesis by using an arrow that points in one direction. This demonstrates the expected direction of causality (Figure 3.16):
Research Focus: Video Games and Aggression
Consider an experiment conducted by Anderson and Dill (2000). The study was designed to test the hypothesis that viewing violent video games would increase aggressive behaviour. In this research, male and female undergraduates from Iowa State University were given a chance to play with either a violent video game (Wolfenstein 3D) or a nonviolent video game (Myst). During the experimental session, the participants played their assigned video games for 15 minutes. Then, after the play, each participant played a competitive game with an opponent in which the participant could deliver blasts of white noise through the earphones of the opponent. The operational definition of the dependent variable (aggressive behaviour) was the level and duration of noise delivered to the opponent. The design of the experiment is shown in Figure 3.17
Two advantages of the experimental research design are (a) the assurance that the independent variable (also known as the experimental manipulation ) occurs prior to the measured dependent variable, and (b) the creation of initial equivalence between the conditions of the experiment (in this case by using random assignment to conditions).
Experimental designs have two very nice features. For one, they guarantee that the independent variable occurs prior to the measurement of the dependent variable. This eliminates the possibility of reverse causation. Second, the influence of common-causal variables is controlled, and thus eliminated, by creating initial equivalence among the participants in each of the experimental conditions before the manipulation occurs.
The most common method of creating equivalence among the experimental conditions is through random assignment to conditions, a procedure in which the condition that each participant is assigned to is determined through a random process, such as drawing numbers out of an envelope or using a random number table . Anderson and Dill first randomly assigned about 100 participants to each of their two groups (Group A and Group B). Because they used random assignment to conditions, they could be confident that, before the experimental manipulation occurred, the students in Group A were, on average, equivalent to the students in Group B on every possible variable, including variables that are likely to be related to aggression, such as parental discipline style, peer relationships, hormone levels, diet — and in fact everything else.
Then, after they had created initial equivalence, Anderson and Dill created the experimental manipulation — they had the participants in Group A play the violent game and the participants in Group B play the nonviolent game. Then they compared the dependent variable (the white noise blasts) between the two groups, finding that the students who had viewed the violent video game gave significantly longer noise blasts than did the students who had played the nonviolent game.
Anderson and Dill had from the outset created initial equivalence between the groups. This initial equivalence allowed them to observe differences in the white noise levels between the two groups after the experimental manipulation, leading to the conclusion that it was the independent variable (and not some other variable) that caused these differences. The idea is that the only thing that was different between the students in the two groups was the video game they had played.
Despite the advantage of determining causation, experiments do have limitations. One is that they are often conducted in laboratory situations rather than in the everyday lives of people. Therefore, we do not know whether results that we find in a laboratory setting will necessarily hold up in everyday life. Second, and more important, is that some of the most interesting and key social variables cannot be experimentally manipulated. If we want to study the influence of the size of a mob on the destructiveness of its behaviour, or to compare the personality characteristics of people who join suicide cults with those of people who do not join such cults, these relationships must be assessed using correlational designs, because it is simply not possible to experimentally manipulate these variables.
Key Takeaways
- Descriptive, correlational, and experimental research designs are used to collect and analyze data.
- Descriptive designs include case studies, surveys, and naturalistic observation. The goal of these designs is to get a picture of the current thoughts, feelings, or behaviours in a given group of people. Descriptive research is summarized using descriptive statistics.
- Correlational research designs measure two or more relevant variables and assess a relationship between or among them. The variables may be presented on a scatter plot to visually show the relationships. The Pearson Correlation Coefficient ( r ) is a measure of the strength of linear relationship between two variables.
- Common-causal variables may cause both the predictor and outcome variable in a correlational design, producing a spurious relationship. The possibility of common-causal variables makes it impossible to draw causal conclusions from correlational research designs.
- Experimental research involves the manipulation of an independent variable and the measurement of a dependent variable. Random assignment to conditions is normally used to create initial equivalence between the groups, allowing researchers to draw causal conclusions.
Exercises and Critical Thinking
- There is a negative correlation between the row that a student sits in in a large class (when the rows are numbered from front to back) and his or her final grade in the class. Do you think this represents a causal relationship or a spurious relationship, and why?
- Think of two variables (other than those mentioned in this book) that are likely to be correlated, but in which the correlation is probably spurious. What is the likely common-causal variable that is producing the relationship?
- Imagine a researcher wants to test the hypothesis that participating in psychotherapy will cause a decrease in reported anxiety. Describe the type of research design the investigator might use to draw this conclusion. What would be the independent and dependent variables in the research?
Image Attributions
Figure 3.4: “ Reading newspaper ” by Alaskan Dude (http://commons.wikimedia.org/wiki/File:Reading_newspaper.jpg) is licensed under CC BY 2.0
Aiken, L., & West, S. (1991). Multiple regression: Testing and interpreting interactions . Newbury Park, CA: Sage.
Ainsworth, M. S., Blehar, M. C., Waters, E., & Wall, S. (1978). Patterns of attachment: A psychological study of the strange situation . Hillsdale, NJ: Lawrence Erlbaum Associates.
Anderson, C. A., & Dill, K. E. (2000). Video games and aggressive thoughts, feelings, and behavior in the laboratory and in life. Journal of Personality and Social Psychology, 78 (4), 772–790.
Damasio, H., Grabowski, T., Frank, R., Galaburda, A. M., Damasio, A. R., Cacioppo, J. T., & Berntson, G. G. (2005). The return of Phineas Gage: Clues about the brain from the skull of a famous patient. In Social neuroscience: Key readings. (pp. 21–28). New York, NY: Psychology Press.
Freud, S. (1909/1964). Analysis of phobia in a five-year-old boy. In E. A. Southwell & M. Merbaum (Eds.), Personality: Readings in theory and research (pp. 3–32). Belmont, CA: Wadsworth. (Original work published 1909).
Kotowicz, Z. (2007). The strange case of Phineas Gage. History of the Human Sciences, 20 (1), 115–131.
Rokeach, M. (1964). The three Christs of Ypsilanti: A psychological study . New York, NY: Knopf.
Stangor, C. (2011). Research methods for the behavioural sciences (4th ed.). Mountain View, CA: Cengage.
Long Descriptions
Figure 3.6 long description: There are 25 families. 24 families have an income between $44,000 and $111,000 and one family has an income of $3,800,000. The mean income is $223,960 while the median income is $73,000. [Return to Figure 3.6]
Figure 3.10 long description: Types of scatter plots.
- Positive linear, r=positive .82. The plots on the graph form a rough line that runs from lower left to upper right.
- Negative linear, r=negative .70. The plots on the graph form a rough line that runs from upper left to lower right.
- Independent, r=0.00. The plots on the graph are spread out around the centre.
- Curvilinear, r=0.00. The plots of the graph form a rough line that goes up and then down like a hill.
- Curvilinear, r=0.00. The plots on the graph for a rough line that goes down and then up like a ditch.
[Return to Figure 3.10]
Introduction to Psychology - 1st Canadian Edition Copyright © 2014 by Jennifer Walinga and Charles Stangor is licensed under a Creative Commons Attribution-NonCommercial-ShareAlike 4.0 International License , except where otherwise noted.
Share This Book
Higher Education News , Tips for Online Students , Tips for Students
A Comprehensive Guide to Different Types of Research
Updated: June 19, 2024
Published: June 15, 2024

When embarking on a research project, selecting the right methodology can be the difference between success and failure. With various methods available, each suited to different types of research, it’s essential you make an informed choice. This blog post will provide tips on how to choose a research methodology that best fits your research goals .
We’ll start with definitions: Research is the systematic process of exploring, investigating, and discovering new information or validating existing knowledge. It involves defining questions, collecting data, analyzing results, and drawing conclusions.
Meanwhile, a research methodology is a structured plan that outlines how your research is to be conducted. A complete methodology should detail the strategies, processes, and techniques you plan to use for your data collection and analysis.

Research Methods
The first step of a research methodology is to identify a focused research topic, which is the question you seek to answer. By setting clear boundaries on the scope of your research, you can concentrate on specific aspects of a problem without being overwhelmed by information. This will produce more accurate findings.
Along with clarifying your research topic, your methodology should also address your research methods. Let’s look at the four main types of research: descriptive, correlational, experimental, and diagnostic.
Descriptive Research
Descriptive research is an approach designed to describe the characteristics of a population systematically and accurately. This method focuses on answering “what” questions by providing detailed observations about the subject. Descriptive research employs surveys, observational studies , and case studies to gather qualitative or quantitative data.
A real-world example of descriptive research is a survey investigating consumer behavior toward a competitor’s product. By analyzing the survey results, the company can gather detailed insights into how consumers perceive a competitor’s product, which can inform their marketing strategies and product development.
Correlational Research
Correlational research examines the statistical relationship between two or more variables to determine whether a relationship exists. Correlational research is particularly useful when ethical or practical constraints prevent experimental manipulation. It is often employed in fields such as psychology, education, and health sciences to provide insights into complex real-world interactions, helping to develop theories and inform further experimental research.
An example of correlational research is the study of the relationship between smoking and lung cancer. Researchers observe and collect data on individuals’ smoking habits and the incidence of lung cancer to determine if there is a correlation between the two variables. This type of research helps identify patterns and relationships, indicating whether increased smoking is associated with higher rates of lung cancer.
Experimental Research
Experimental research is a scientific approach where researchers manipulate one or more independent variables to observe their effect on a dependent variable. This method is designed to establish cause-and-effect relationships. Fields like psychology , medicine, and social sciences frequently employ experimental research to test hypotheses and theories under controlled conditions.
A real-world example of experimental research is Pavlov’s Dog experiment. In this experiment, Ivan Pavlov demonstrated classical conditioning by ringing a bell each time he fed his dogs. After repeating this process multiple times, the dogs began to salivate just by hearing the bell, even when no food was presented. This experiment helped to illustrate how certain stimuli can elicit specific responses through associative learning.
Diagnostic Research
Diagnostic research tries to accurately diagnose a problem by identifying its underlying causes. This type of research is crucial for understanding complex situations where a precise diagnosis is necessary for formulating effective solutions. It involves methods such as case studies and data analysis and often integrates both qualitative and quantitative data to provide a comprehensive view of the issue at hand.
An example of diagnostic research is studying the causes of a specific illness outbreak. During an outbreak of a respiratory virus, researchers might conduct diagnostic research to determine the factors contributing to the spread of the virus. This could involve analyzing patient data, testing environmental samples, and evaluating potential sources of infection. The goal is to identify the root causes and contributing factors to develop effective containment and prevention strategies.
Using an established research method is imperative, no matter if you are researching for marketing , technology , healthcare , engineering, or social science. A methodology lends legitimacy to your research by ensuring your data is both consistent and credible. A well-defined methodology also enhances the reliability and validity of the research findings, which is crucial for drawing accurate and meaningful conclusions.
Additionally, methodologies help researchers stay focused and on track, limiting the scope of the study to relevant questions and objectives. This not only improves the quality of the research but also ensures that the study can be replicated and verified by other researchers, further solidifying its scientific value.

How to Choose a Research Methodology
Choosing the best research methodology for your project involves several key steps to ensure that your approach aligns with your research goals and questions. Here’s a simplified guide to help you make the best choice.
Understand Your Goals
Clearly define the objectives of your research. What do you aim to discover, prove, or understand? Understanding your goals helps in selecting a methodology that aligns with your research purpose.
Consider the Nature of Your Data
Determine whether your research will involve numerical data, textual data, or both. Quantitative methods are best for numerical data, while qualitative methods are suitable for textual or thematic data.
Understand the Purpose of Each Methodology
Becoming familiar with the four types of research – descriptive, correlational, experimental, and diagnostic – will enable you to select the most appropriate method for your research. Many times, you will want to use a combination of methods to gather meaningful data.
Evaluate Resources and Constraints
Consider the resources available to you, including time, budget, and access to data. Some methodologies may require more resources or longer timeframes to implement effectively.
Review Similar Studies
Look at previous research in your field to see which methodologies were successful. This can provide insights and help you choose a proven approach.
By following these steps, you can select a research methodology that best fits your project’s requirements and ensures robust, credible results.
Completing Your Research Project
Upon completing your research, the next critical step is to analyze and interpret the data you’ve collected. This involves summarizing the key findings, identifying patterns, and determining how these results address your initial research questions. By thoroughly examining the data, you can draw meaningful conclusions that contribute to the body of knowledge in your field.
It’s essential that you present these findings clearly and concisely, using charts, graphs, and tables to enhance comprehension. Furthermore, discuss the implications of your results, any limitations encountered during the study, and how your findings align with or challenge existing theories.
Your research project should conclude with a strong statement that encapsulates the essence of your research and its broader impact. This final section should leave readers with a clear understanding of the value of your work and inspire continued exploration and discussion in the field.
Now that you know how to perform quality research , it’s time to get started! Applying the right research methodologies can make a significant difference in the accuracy and reliability of your findings. Remember, the key to successful research is not just in collecting data, but in analyzing it thoughtfully and systematically to draw meaningful conclusions. So, dive in, explore, and contribute to the ever-growing body of knowledge with confidence. Happy researching!
At UoPeople, our blog writers are thinkers, researchers, and experts dedicated to curating articles relevant to our mission: making higher education accessible to everyone.
Related Articles
Root out friction in every digital experience, super-charge conversion rates, and optimise digital self-service
Uncover insights from any interaction, deliver AI-powered agent coaching, and reduce cost to serve
Increase revenue and loyalty with real-time insights and recommendations delivered straight to teams on the ground
Know how your people feel and empower managers to improve employee engagement, productivity, and retention
Take action in the moments that matter most along the employee journey and drive bottom line growth
Whatever they’re are saying, wherever they’re saying it, know exactly what’s going on with your people
Get faster, richer insights with qual and quant tools that make powerful market research available to everyone
Run concept tests, pricing studies, prototyping + more with fast, powerful studies designed by UX research experts
Track your brand performance 24/7 and act quickly to respond to opportunities and challenges in your market
Meet the operating system for experience management
- Free Account
- Product Demos
- For Digital
- For Customer Care
- For Human Resources
- For Researchers
- Financial Services
- All Industries
Popular Use Cases
- Customer Experience
- Employee Experience
- Employee Exit Interviews
- Net Promoter Score
- Voice of Customer
- Customer Success Hub
- Product Documentation
- Training & Certification
- XM Institute
- Popular Resources
- Customer Stories
- Artificial Intelligence
- Market Research
- Partnerships
- Marketplace
The annual gathering of the experience leaders at the world’s iconic brands building breakthrough business results.
- English/AU & NZ
- Español/Europa
- Español/América Latina
- Português Brasileiro
- REQUEST DEMO
- Experience Management
- Survey Analysis
Descriptive Statistics
Try Qualtrics for free
Descriptive statistics in research: a critical component of data analysis.
15 min read With any data, the object is to describe the population at large, but what does that mean and what processes, methods and measures are used to uncover insights from that data? In this short guide, we explore descriptive statistics and how it’s applied to research.
What do we mean by descriptive statistics?
With any kind of data, the main objective is to describe a population at large — and using descriptive statistics, researchers can quantify and describe the basic characteristics of a given data set.
For example, researchers can condense large data sets, which may contain thousands of individual data points or observations, into a series of statistics that provide useful information on the population of interest. We call this process “describing data”.
In the process of producing summaries of the sample, we use measures like mean, median, variance, graphs, charts, frequencies, histograms, box and whisker plots, and percentages. For datasets with just one variable, we use univariate descriptive statistics. For datasets with multiple variables, we use bivariate correlation and multivariate descriptive statistics.
Want to find out the definitions? Univariate descriptive statistics: this is when you want to describe data with only one characteristic or attribute
Bivariate correlation: this is when you simultaneously analyse (compare) two variables to see if there is a relationship between them
Multivariate descriptive statistics: this is a subdivision of statistics encompassing the simultaneous observation and analysis of more than one outcome variable
Then, after describing and summarising the data, as well as using simple graphical analyses, we can start to draw meaningful insights from it to help guide specific strategies. It’s also important to note that descriptive statistics can employ and use both quantitative and qualitative research .
Describing data is undoubtedly the most critical first step in research as it enables the subsequent organisation, simplification and summarisation of information — and every survey question and population has summary statistics. Let’s take a look at a few examples.
Examples of descriptive statistics
Consider for a moment a number used to summarise how well a striker is performing in football — goals scored per game. This number is simply the number of shots taken against how many of those shots hit the back of the net (reported to three significant digits). If a striker is scoring 0.333, that’s one goal for every three shots. If they’re scoring one in four, that’s 0.250.
A classic example is a student’s grade point average (GPA). This single number describes the general performance of a student across a range of course experiences and classes. It doesn’t tell us anything about the difficulty of the courses the student is taking, or what those courses are, but it does provide a summary that enables a degree of comparison with people or other units of data.
Ultimately, descriptive statistics make it incredibly easy for people to understand complex (or data intensive) quantitative or qualitative insights across large data sets.
Take your research and subsequent analysis to the next level
Types of descriptive statistics
To quantitatively summarise the characteristics of raw, ungrouped data, we use the following types of descriptive statistics:
- Measures of Central Tendency ,
- Measures of Dispersion and
- Measures of Frequency Distribution.
Following the application of any of these approaches, the raw data then becomes ‘grouped’ data that’s logically organised and easy to understand. To visually represent the data, we then use graphs, charts, tables etc.
Let’s look at the different types of measurement and the statistical methods that belong to each:
Measures of Central Tendency are used to describe data by determining a single representative of central value. For example, the mean, median or mode.
Measures of Dispersion are used to determine how spread out a data distribution is with respect to the central value, e.g. the mean, median or mode. For example, while central tendency gives the person the average or central value, it doesn’t describe how the data is distributed within the set.
Measures of Frequency Distribution are used to describe the occurrence of data within the data set (count).
The methods of each measure are summarised in the table below:
| Measures of Central Tendency | Measures of Dispersion | Measures of Frequency Distribution |
|---|---|---|
| Mean | Range | Count |
| Median | Standard deviation | |
| Mode | Quartile deviation | |
| Variance | ||
| Absolute deviation |
Mean: The most popular and well-known measure of central tendency. The mean is equal to the sum of all the values in the data set divided by the number of values in the data set.
Median: The median is the middle score for a set of data that has been arranged in order of magnitude. If you have an even number of data, e.g. 10 data points, take the two middle scores and average the result.
Mode: The mode is the most frequently occurring observation in the data set.
Range: The difference between the highest and lowest value.
Standard deviation: Standard deviation measures the dispersion of a data set relative to its mean and is calculated as the square root of the variance.
Quartile deviation : Quartile deviation measures the deviation in the middle of the data.
Variance: Variance measures the variability from the average of mean.
Absolute deviation: The absolute deviation of a dataset is the average distance between each data point and the mean.
Count: How often each value occurs.
Scope of descriptive statistics in research
Descriptive statistics (or analysis) is considered more vast than other quantitative and qualitative methods as it provides a much broader picture of an event, phenomenon or population.
But that’s not all: it can use any number of variables, and as it collects data and describes it as it is, it’s also far more representative of the world as it exists.
However, it’s also important to consider that descriptive analyses lay the foundation for further methods of study. By summarising and condensing the data into easily understandable segments, researchers can further analyse the data to uncover new variables or hypotheses.
Mostly, this practice is all about the ease of data visualisation. With data presented in a meaningful way, researchers have a simplified interpretation of the data set in question. That said, while descriptive statistics helps to summarise information, it only provides a general view of the variables in question.
It is, therefore, up to the researchers to probe further and use other methods of analysis to discover deeper insights.
Things you can do with descriptive statistics:
- Define subject characteristics: If a marketing team wanted to build out accurate buyer personas for specific products and industry verticals, they could use descriptive analyses on customer datasets (procured via a survey) to identify consistent traits and behaviours.
They could then ‘describe’ the data to build a clear picture and understanding of who their buyers are, including things like preferences, business challenges, income and so on.
- Measure data trends
Let’s say you wanted to assess propensity to buy over several months or years for a specific target market and product. With descriptive statistics, you could quickly summarise the data and extract the precise data points you need to understand the trends in product purchase behaviour.
- Compare events, populations or phenomena
How do different demographics respond to certain variables? For example, you might want to run a customer study to see how buyers in different job functions respond to new product features or price changes. Are all groups as enthusiastic about the new features and likely to buy? Or do they have reservations? This kind of data will help inform your overall product strategy and potentially how you tier solutions.
- Validate existing conditions
When you have a belief or hypothesis but need to prove it, you can use descriptive techniques to ascertain underlying patterns or assumptions.
- Form new hypotheses
With the data presented and surmised in a way that everyone can understand (and infer connections from), you can delve deeper into specific data points to uncover deeper and more meaningful insights — or run more comprehensive research.
Guiding your survey design to improve the data collected
To use your surveys as an effective tool for customer engagement and understanding, every survey goal and item should answer one simple, yet highly important question:
“What am I really asking?”
It might seem trivial, but by having this question frame survey research, it becomes significantly easier for researchers to develop the right questions that uncover useful, meaningful and actionable insights.
Planning becomes easier, questions clearer and perspective far wider and yet nuanced.
Hypothesise — what’s the problem that you’re trying to solve? Far too often, organisations collect data without understanding what they’re asking, and why they’re asking it.
Finally, focus on the end result. What kind of data do you need to answer your question? Also, are you asking a quantitative or qualitative question? Here are a few things to consider:
- Clear questions are clear for everyone. It takes time to make a concept clear
- Ask about measurable, evident and noticeable activities or behaviours.
- Make rating scales easy. Avoid long lists, confusing scales or “don’t know” or “not applicable” options.
- Ensure your survey makes sense and flows well. Reduce the cognitive load on respondents by making it easy for them to complete the survey.
- Read your questions aloud to see how they sound.
- Pretest by asking a few uninvolved individuals to answer.
Furthermore…
As well as understanding what you’re really asking, there are several other considerations for your data:
- Keep it random
How you select your sample is what makes your research replicable and meaningful. Having a truly random sample helps prevent bias, increasingly the quality of evidence you find.
- Plan for and avoid sample error
Before starting your research project, have a clear plan for avoiding sample error. Use larger sample sizes, and apply random sampling to minimise the potential for bias.
- Don’t over sample
Remember, you can sample 500 respondents selected randomly from a population and they will closely reflect the actual population 95% of the time.
- Think about the mode
Match your survey methods to the sample you select. For example, how do your current customers prefer communicating? Do they have any shared characteristics or preferences? A mixed-method approach is critical if you want to drive action across different customer segments.
Use a survey tool that supports you with the whole process
Surveys created using a survey research software can support researchers in a number of ways:
- Employee satisfaction survey template
- Employee exit survey template
- Customer satisfaction (CSAT) survey template
- Ad testing survey template
- Brand awareness survey template
- Product pricing survey template
- Product research survey template
- Employee engagement survey template
- Customer service survey template
- NPS survey template
- Product package testing survey template
- Product features prioritisation survey template
These considerations have been included in Qualtrics’ survey software , which summarises and creates visualisations of data, making it easy to access insights, measure trends, and examine results without complexity or jumping between systems.
Uncover your next breakthrough idea with Stats iQ™
What makes Qualtrics so different from other survey providers is that it is built in consultation with trained research professionals and includes high-tech statistical software like Qualtrics Stats iQ .
With just a click, the software can run specific analyses or automate statistical testing and data visualisation. Testing parameters are automatically chosen based on how your data is structured (e.g. categorical data will run a statistical test like Chi-squared), and the results are translated into plain language that anyone can understand and put into action.
- Get more meaningful insights from your data
Stats iQ includes a variety of statistical analyses, including: describe, relate, regression, cluster, factor, TURF, and pivot tables — all in one place!
- Confidently analyse complex data
Built-in artificial intelligence and advanced algorithms automatically choose and apply the right statistical analyses and return the insights in plain english so everyone can take action.
- Integrate existing statistical workflows
For more experienced stats users, built-in R code templates allow you to run even more sophisticated analyses by adding R code snippets directly in your survey analysis.
Advanced statistical analysis methods available in Stats iQ
Regression analysis – Measures the degree of influence of independent variables on a dependent variable (the relationship between two or multiple variables).
Analysis of Variance (ANOVA) test – Commonly used with a regression study to find out what effect independent variables have on the dependent variable. It can compare multiple groups simultaneously to see if there is a relationship between them.
Conjoint analysis – Asks people to make trade-offs when making decisions, then analyses the results to give the most popular outcome. Helps you understand why people make the complex choices they do.
T-Test – Helps you compare whether two data groups have different mean values and allows the user to interpret whether differences are meaningful or merely coincidental.
Crosstab analysis – Used in quantitative market research to analyse categorical data – that is, variables that are different and mutually exclusive, and allows you to compare the relationship between two variables in contingency tables.
Go from insights to action
Now that you have a better understanding of descriptive statistics in research and how you can leverage statistical analysis methods correctly, now’s the time to utilise a tool that can take your research and subsequent analysis to the next level.
Try out a Qualtrics survey software demo so you can see how it can take you through descriptive research and further research projects from start to finish.
Related resources
Analysis & Reporting
Statistical Significance Calculator 18 min read
Zero-party data 12 min read, what is social media analytics in 2023 13 min read, topic modelling 16 min read, margin of error 11 min read, text analysis 44 min read, sentiment analysis 21 min read, request demo.
Ready to learn more about Qualtrics?
How it works
Transform your enterprise with the scalable mindsets, skills, & behavior change that drive performance.
Explore how BetterUp connects to your core business systems.
We pair AI with the latest in human-centered coaching to drive powerful, lasting learning and behavior change.
Build leaders that accelerate team performance and engagement.
Unlock performance potential at scale with AI-powered curated growth journeys.
Build resilience, well-being and agility to drive performance across your entire enterprise.
Transform your business, starting with your sales leaders.
Unlock business impact from the top with executive coaching.
Foster a culture of inclusion and belonging.
Accelerate the performance and potential of your agencies and employees.
See how innovative organizations use BetterUp to build a thriving workforce.
Discover how BetterUp measurably impacts key business outcomes for organizations like yours.
A demo is the first step to transforming your business. Meet with us to develop a plan for attaining your goals.

- What is coaching?
Learn how 1:1 coaching works, who its for, and if it's right for you.
Accelerate your personal and professional growth with the expert guidance of a BetterUp Coach.
Types of Coaching
Navigate career transitions, accelerate your professional growth, and achieve your career goals with expert coaching.
Enhance your communication skills for better personal and professional relationships, with tailored coaching that focuses on your needs.
Find balance, resilience, and well-being in all areas of your life with holistic coaching designed to empower you.
Discover your perfect match : Take our 5-minute assessment and let us pair you with one of our top Coaches tailored just for you.

Research, expert insights, and resources to develop courageous leaders within your organization.
Best practices, research, and tools to fuel individual and business growth.
View on-demand BetterUp events and learn about upcoming live discussions.
The latest insights and ideas for building a high-performing workplace.
- BetterUp Briefing
The online magazine that helps you understand tomorrow's workforce trends, today.
Innovative research featured in peer-reviewed journals, press, and more.
Founded in 2022 to deepen the understanding of the intersection of well-being, purpose, and performance
We're on a mission to help everyone live with clarity, purpose, and passion.
Join us and create impactful change.
Read the buzz about BetterUp.
Meet the leadership that's passionate about empowering your workforce.

For Business
For Individuals
9 meaningful life goals to pursue for long-term fulfillment

Jump to section
Why you should set life goals
9 examples of meaningful life goals, how to motivate yourself to achieve life goals: 4 tips, turn your goals into reality.
Everyone’s journey in life is different. You probably know someone who meanders through life with frequent stops to smell the roses — and someone else who rushes around at breakneck speed, knocking things off their task priority list and hardly pausing to take a breath.
Whether you’re the wanderer, the whirlwind, or somewhere in between, you can benefit from thinking about your life goals. If you go with the flow, clarifying your goals can help you dig in and fight for what’s important. And if you rush from one short-term goal to the next, setting life goals can help you stand back and use your energy more strategically.
It’s well worth setting aside some time to develop a list of life goals that deeply align with your values , are built around your life’s purpose , and are part of your overall life plan .
Most children have clear life goals. Take Toby, David, and Alina, three kindergarteners who were asked what they wanted to be when they grew up .
Toby said he wanted to be “a veterinarian so I can help pets get better.” David said, “a fireman since I like explosions and fire.” And Alina said, “I want to be a customer in a store. I will buy broccoli, tomatoes, and carrots. When I get home, I will make soup.”
Whether you’re a go-getter like David or more in Alina’s speed, your life goals might feel less concrete as you age. It’s easy to let financial imperatives and seemingly urgent tasks distract you from more important objectives.
But communicating your life goals (even just to yourself) has surprising health benefits. One study found that journaling about life goals for 20 minutes on four consecutive days reduced physical illness five months later. Another found that students who either wrote or talked about their life goals were less likely to visit the health center due to illness.
Setting your overarching priorities also offers you a sense of purpose in everything you do, so you don’t wake up one day wondering what you have to show for the time that’s passed.
Here are nine life goal examples you can adapt to suit your interests and personal values .
1. Challenge yourself every day
Getting out of your comfort zone is a great way to develop new skills, conquer your fear of failure , and stay humble. It also helps you cultivate a growth mindset — the understanding that you can improve your skills immeasurably through constant learning, determination , and hard work.
You could challenge yourself to grow personally by doing something that scares you ( public speaking , skydiving, or networking ). But this goal isn’t about going bungee jumping every day. Instead, it’s about getting comfortable being uncomfortable .
For you, that might look like steadily working toward a fitness or health goal, taking steps to achieve a professional goal, or taking social risks while pursuing a friendship goal .
2. Become more mindful
Practicing mindfulness, or slowing down and paying attention to the present moment, has impressive benefits. Mindfulness reduces stress, improves memory and focus, makes you a better problem-solver, and improves your relationships , to name only a few.
Setting a mindfulness-related personal goal might look like developing a regular yoga or meditation practice , cultivating a healthier relationship with food through mindful eating , or committing to manage stress and improve your well-being through mindful breathing .
3. Fulfill your professional dream
Perhaps you secretly think you’d do a great job as CEO of your company. Or maybe you’ve always wanted to start your own business or work in a different industry .
Whatever it is, saying it out loud and turning it into a concrete goal sets you on the path toward achieving it. Defining success means you can start planning the small steps you must take to get there.
This might involve improving your leadership skills , preparing for a promotion , making a career change in your 40s , or changing careers in your 50s .

4. Gain financial freedom
Deciding to work toward financial security is a powerful way to focus your attention on what you need to do to get there. Potential financial life goals include:
- Handling your debt
- Buying a home
- Setting up a passive income stream
- Investing a certain amount of your paycheck each month
Choose the financial goal that motivates you most and then break it into milestones you can work toward and celebrate along the way.
5. Look after yourself or others
Balancing the needs of self and others is one of life’s most challenging and gratifying tasks. If you tend to care for everyone else and put yourself last, set a life goal to fill your own cup first through self-care practices , asking for help , and carving out time for yourself .
And if you want to focus on others and strengthen your connections, you could set a relationship goal to become a better friend , parent , or partner.
6. Learn something new
Learning something new puts you on a fast track to personal growth by cultivating humility , critical thinking skills , and mental clarity . If you’ve wanted to dive into a new skill but haven’t found the time, turning it into a life goal might motivate you to pursue it more seriously.
It doesn’t matter what your new skill is — you just need to feel excited about it. Here are some suggestions:
- A musical instrument
- Self-defense
- Woodworking
- Car maintenance
Whenever you learn a new skill, you’re also learning how to learn , which sets you up to learn new skills in the future.

7. Expand your family
For most people, adding a new family member is both exciting and intimidating. While you can never fully prepare for a birth, adoption, foster child, or even pet adoption, setting family goals can help you consider any financial, emotional, and professional conditions you’d like to satisfy before welcoming the new arrival.
Setting a goal to expand your family may affect other big life decisions. If you plan to start a family in the next few years, you might want to structure your job searches to prioritize paid parental leave and benefits like flexible paid time off.
8. Start (and finish) a big creative project
If you have a book, poetry collection, or album of original songs locked inside you, maybe now’s the time to pursue this creative dream. It’s far too easy to put creative projects on the back burner when you’re just trying to make it through your workday. But for many, it’s these projects that make them feel most alive.
Stories abound of creative people who were working normal jobs before they got their big break. Harper Lee started off as an airline clerk, Anne Rice was an insurance claims examiner, and Art Garfunkel was a math teacher. Maybe you’ll be next. If you don’t set this meaningful creative goal, you’ll never know.
9. Give back
Giving back to your community or the world in general makes you happier, healthier, and more connected . Research even shows that life goals that focus on improving life for others make you happier than goals where you’re the only one who benefits .
Here are some ways to give back:
- Making financial donations to causes you care about
- Volunteering
- Planting trees or picking up litter
- Supporting local small businesses
- Entering local politics
- Writing a memoir or a book about something you’d like to share

The sheer magnitude of most life goals can make them feel overwhelming . It’s important to break them down into smaller, more manageable pieces that support your achievement of larger long-term goals. Here are a few ways to stay motivated as you transform important life goals into action.
1. Create a vision board
A vision board is a visual representation of a goal. To create a vision board, find photos, quotes, and other objects (get creative!) that inspire you and put them together. Then put the board above your desk or in a place where you’ll pass by it frequently.
2. Set SMART goals
The SMART goal framework adds helpful structure to goals that are too vague or abstract. According to this framework, goals should be:
- M easurable
- A ttainable
- T ime-bound
If your goal is to learn to cook, a SMART version might be: “Learn to cook five different healthy dinners that the whole family enjoys by the end of this year.”
Some life goals better suit the SMART goal framework than others, so experiment to find out what works.

3. Mark milestones
Breaking big goals into more manageable steps keeps you on track and prevents you from becoming overwhelmed. If your goal is to learn Arabic, you could break that into the following milestones:
- First month: Learn the alphabet
- Second month: Have a simple conversation
- Third month: Increase vocabulary to 500 words
Milestones encourage you to measure — and, more importantly, celebrate — your progress regularly.
4. Create an action plan
An action plan is a map of the steps you’ll take to realize your goal. A good action plan describes the tasks and subtasks involved in achieving your goal and sets a target date for each.
Creating an action plan is an excellent way to avoid becoming stymied by what programmers call “ yak shaving ”: the seemingly endless series of preliminary tasks you have to do before you can start the real task.
If you want to learn self-defense, you might realize you need to research a local self-defense school. And before you do that, you need to learn about different self-defense methods to find the right one.
Figuring out these sub-tasks and writing them down as action steps with deadlines will help you make steady progress and stop procrastination in its tracks .
Setting life goals is the first step toward achieving them. After that, you’ll need to call on motivation, inspiration , and sheer grit to reach them.
It’s important to fight for goals you really care about. But if your priorities change, there’s no shame in dropping one life goal and picking up another. You’re not the same person you were five years ago, and you won’t be the same person five years from now.
The best goals are those you revisit periodically and adapt to changing circumstances .
You might find, for example, that buying your dream car no longer seems like the best path to a fulfilling life. Instead, like Alina, you just want to make a great vegetable soup.
Achieve your life goals
Discover how personalized coaching can guide you toward fulfilling your dreams and ambitions.
Elizabeth Perry, ACC
Elizabeth Perry is a Coach Community Manager at BetterUp. She uses strategic engagement strategies to cultivate a learning community across a global network of Coaches through in-person and virtual experiences, technology-enabled platforms, and strategic coaching industry partnerships. With over 3 years of coaching experience and a certification in transformative leadership and life coaching from Sofia University, Elizabeth leverages transpersonal psychology expertise to help coaches and clients gain awareness of their behavioral and thought patterns, discover their purpose and passions, and elevate their potential. She is a lifelong student of psychology, personal growth, and human potential as well as an ICF-certified ACC transpersonal life and leadership Coach.
10 wellness goals to boost your overall health
Being the boss: 10 tips to find work-life balance for managers, how being intentional can improve your life, emotional goals: 20 examples and how to reach them, how to write a 10 year plan (with examples) and reach your goals, a goal for each part of your life: 13 types of goals that you need to set, how to make an action plan to achieve your goals and follow it, setting smart health goals: be clever about your well-being, how to get your life together in 10 simple steps, similar articles, 20 family goals to practice with your loved ones, how to excel at life planning (a life planning template), long-term versus short-term goals: use both to succeed, get closer to your dreams: 20 examples of monthly goals that work, 5 long-term goals examples (+ tips to achieve them), grow model for coaching: achieve goals and boost performance, setting goals for 2024 to ring in the new year right, stay connected with betterup, get our newsletter, event invites, plus product insights and research..
3100 E 5th Street, Suite 350 Austin, TX 78702
- Platform Overview
- Integrations
- Powered by AI
- BetterUp Lead™
- BetterUp Manage™
- BetterUp Care®
- Sales Performance
- Diversity & Inclusion
- Case Studies
- Why BetterUp?
- About Coaching
- Find your Coach
- Career Coaching
- Communication Coaching
- Life Coaching
- News and Press
- Leadership Team
- Become a BetterUp Coach
- BetterUp Labs
- Center for Purpose & Performance
- Leadership Training
- Business Coaching
- Contact Support
- Contact Sales
- Privacy Policy
- Acceptable Use Policy
- Trust & Security
- Cookie Preferences
IMAGES
VIDEO
COMMENTS
The goal of descriptive research is to provide a comprehensive and accurate picture of the population or phenomenon being studied and to describe the relationships, patterns, and trends that exist within the data. ... Descriptive research allows for a wide range of data collection methods, including surveys, observational studies, ...
Descriptive research methods. Descriptive research is usually defined as a type of quantitative research, though qualitative research can also be used for descriptive purposes. The research design should be carefully developed to ensure that the results are valid and reliable.. Surveys. Survey research allows you to gather large volumes of data that can be analyzed for frequencies, averages ...
Applications of descriptive research with examples. A descriptive research method can be used in multiple ways and for various reasons. Before getting into any survey, though, the survey goals and survey design are crucial. Despite following these steps, there is no way to know if one will meet the research outcome. How to use descriptive research?
Descriptive research is a common investigatory model used by researchers in various fields, including social sciences, linguistics, and academia. ... and where. Obtaining enough knowledge about the research topic is an important component of research. The main goal is to observe and catalog all the variables and conditions that affect the ...
As discussed earlier, common data analysis methods for descriptive research include descriptive statistics, cross-tabulation, content analysis, qualitative coding, visualization, and comparative analysis. I nterpret results: Interpret your findings in light of your research question and objectives.
Descriptive research is a methodological approach that seeks to depict the characteristics of a phenomenon or subject under investigation. In scientific inquiry, it serves as a foundational tool for researchers aiming to observe, record, and analyze the intricate details of a particular topic. This method provides a rich and detailed account ...
Descriptive research design. Descriptive research design uses a range of both qualitative research and quantitative data (although quantitative research is the primary research method) to gather information to make accurate predictions about a particular problem or hypothesis. As a survey method, descriptive research designs will help ...
Definition of descriptive research. Descriptive research is defined as a research method that observes and describes the characteristics of a particular group, situation, or phenomenon. The goal is not to establish cause and effect relationships but rather to provide a detailed account of the situation.
Descriptive Research vs. Exploratory Research. Descriptive research is a research method that focuses on providing a detailed and accurate account of a specific situation, group, or phenomenon. This type of research describes the characteristics, behaviors, or relationships within the given context without looking for an underlying cause.
Descriptive research methods. Descriptive research is usually defined as a type of quantitative research, though qualitative research can also be used for descriptive purposes. The research design should be carefully developed to ensure that the results are valid and reliable.. Surveys. Survey research allows you to gather large volumes of data that can be analysed for frequencies, averages ...
goal is to identify and describe trends and variation in populations, create new measures of key phenomena, or describe samples in studies aimed at ... Example of Descriptive Research that Uses Network and Cluster Analysis as Descriptive Tools 25 Box 12. Visualization as Data Simplification 32 Box 13. Summary of Data Visualization Tips 37
Descriptive research may identify areas in need of additional research and relationships between variables that require future study. Descriptive research is often referred to as "hypothesis generating research." Depending on the data collection method used, descriptive studies can generate rich datasets on large and diverse samples. ...
The end goal is to measure the result of different temperature of water ... A descriptive research design is a type of research design that aims to obtain information to systematically describe a ...
Video 2.4.1. Descriptive Research Design provides explanation and examples for quantitative descriptive research.A closed-captioned version of this video is available here.. Descriptive research is distinct from correlational research, in which researchers formally test whether a relationship exists between two or more variables. Experimental research goes a step further beyond descriptive and ...
For example, suppose you are a website beta testing an app feature. In that case, descriptive research invites users to try the feature, tracking their behavior and then asking their opinions. Can be applied to many research methods and areas. Examples include healthcare, SaaS, psychology, political studies, education, and pop culture.
The research has employed a descriptive design, facilitating the description, explanation, and validation of the research findings (Siedlecki, 2020). When prioritizing cause-effect relationships ...
Descriptive research can be statistical research. The main objective of this type of research is to describe the data and characteristics of what is being studied. The idea behind this type of research is to study frequencies, averages, and other statistical calculations. Although this research is highly accurate, it does not gather the causes ...
Types of descriptive research. Observational method. Case studies. Surveys. Recap. Descriptive research methods are used to define the who, what, and where of human behavior and other ...
There are varied goals for which qualitative research questions are developed. These questions can function in several ways, such as to 1) identify and describe existing conditions (contextual research questions); 2) describe a phenomenon (descriptive research questions); 3) assess the effectiveness of existing methods, protocols, ...
Qualitative description (QD) is a label used in qualitative research for studies which are descriptive in nature, particularly for examining health care and nursing-related phenomena (Polit & Beck, 2009, 2014).QD is a widely cited research tradition and has been identified as important and appropriate for research questions focused on discovering the who, what, and where of events or ...
Descriptive research. Sometimes the goal of research is to describe or define a particular phenomenon. In this case, descriptive research would be an appropriate strategy. A descriptive may, for example, aim to describe a pattern. For example, researchers often collect information to describe something for the benefit of the general public.
Explain the goals of descriptive research and the statistical techniques used to interpret it. Summarize the uses of correlational research and describe why correlational research cannot be used to infer causality. Review the procedures of experimental research and explain how it can be used to draw causal inferences.
This blog post will provide tips on how to choose a research methodology that best fits your research goals. We'll start with definitions: Research is the systematic process of exploring, investigating, and discovering new information or validating existing knowledge. ... Let's look at the four main types of research: descriptive ...
Scientific research can be categorized into: a) descriptive research, with the main goal to summarize characteristics of a group (or person); b) predictive research, with the main goal to forecast future outcomes that can be used for screening, selection, or monitoring; and c) explanatory research, with the main goal to understand the underlying causal mechanism, which can then be used to ...
Descriptive research is considered more vast than other quantitative and qualitative methods as it provides a broader picture of an event or population. ... If a striker is scoring 0.333, that's one goal for every three shots. If they're scoring one in four, that's 0.250. A classic example is a student's grade point average (GPA). This ...
Keep yourself motivated by setting reasonable goals. Relevant: Your goals should be relevant to you—that is, they should align with your long-term aspirations and values. Think of this as the "why" of your goal. Time-bound: Set a deadline for your goals so you can stay on track and motivated. Getting started on professional development goals
Some life goals better suit the SMART goal framework than others, so experiment to find out what works. 3. Mark milestones. Breaking big goals into more manageable steps keeps you on track and prevents you from becoming overwhelmed. If your goal is to learn Arabic, you could break that into the following milestones: First month: Learn the alphabet