Electronic Circuits and Diagrams-Electronic Projects and Design

Log amplifier

Log amplifier..

Log amplifier is a linear circuit in which the output voltage will be a constant times the natural logarithm of the input. The basic output equation of a log amplifier is v Vout = K ln (Vin/Vref); where Vref is the constant of normalisation, and K is the scale factor. Log amplifier finds a lot of application in electronic fields like multiplication or division (they can be performed by the addition and subtraction of the logs of the operand), signal processing, computerised process control, compression, decompression, RMS value detection etc. Basically there are two log amp configurations: Opamp-diode log amplifier and Opamp-transistor log.

Opamp-diode log amplifier.

diode opamp log amplifier

The schematic of a simple Opamp-diode log amplifier is shown above. This is nothing but an opamp wired in closed loop inverting configuration with a diode in the feedback path. The voltage across the diode will be always proportional to the log of the current through it and when a diode is placed in the feedback path of an opamp in inverting mode, the output voltage will be proportional to the negative log of the input current. Since the input current is proportional to the input voltage, we can say that the output voltage will be proportional to the negative log of the input voltage.

A ccording to the PN junction diode equation, the relationship between current and voltage for a diode is Id = Is (e (Vd/Vt) -1) …………(1) Where Id is the diode current, Is is the saturation current, Vd is the voltage across the diode and Vt is the thermal voltage.

Since Vd the voltage across the diode is positive here and Vt the thermal voltage is a small quantity, the equation (1) can be approximated as Id = Is e (Vd/Vt) …………………(2)

Since an ideal opamp has infinite input resistance, the input current Ir has only one path, that is through the diode. That means the input current is equal to the diode current Id. => Ir = Id ………………….(3)

Since the inverting input pin of the opamp is virtually grounded, we can say that Ir = Vin/R

Since Ir = Id (from equation (3) ) Vin/R = Id …………………..(4)

Comparing equation (4) and (2) we have Vin/R = Is e (Vd/Vt)

i.e. Vin = Is R e (Vd/Vt) ……………(5)

Considering that the negative of the voltage across diode is the output voltage Vout (see the circuit diagram (fig1)), we can rearrange the equation (5) to get

Vout = -Vt In(Vin/IsR)

Opamp transistor log amplifier.

In this configuration a transistor is placed in the feedback path of an opamp wired in inverting mode. Collector of the transistor is connected to the inverting input of the opamp, emitter to output and base is grounded. The necessary condition for a log amp to work is that the input voltage must be always positive. Circuit diagram of an Opamp-transistor log amplifier is shown below.

transistor-opamp log amplifier

From  Fig 2  it is clear that base-emitter voltage of the transistor  Vbe = -Vout  ………(1)

We know that Ic = Iso (e (Vbe/Vt) -1) ………….(2) Where Ic is the collector current of the transistor, Iso the saturation current, Vbe the base emitter voltage and Vt the thermal voltage.

Equation (1) can be approximated as Ic = Iso e (Vbe/Vt)  ………….(3) Ie, Vbe = Vt In (Ic/Iso) …………….(4)

Since input pin of an ideal opamp has infinite input impedance, the only path for the input current Ir is through the transistor and that means Ir = Ic.

Since the inverting input of the opamp is virtually grounded Ir = Vin/R

That means Ic = Vin/R  ……………(5)

From equations (5) , (4) and (1) it is clear that

Vout = -Vt ln (Vin/IsoR1) ………….(6)

Related Posts

Cascode amplifier, stereo headphone amplifier, transistor amplifier, 22 comments.

Purpose of hysteresis in a comparator?

How current characteristics of pn junction employed in a log amplifier?

In your article, saying that for Opamp-transistor log amplifier, “The necessary condition for a log amp to work is that the input voltage must be always positive.” Is there any mistake? I feel the input voltage should be always negative, not positive. Please help me clarify this. Thank you.

What would happen if the input voltage is negative? On both cases.

Why use it for mearsurement light?

Can you please tell me the limitations of basic log amplifier?

what is aplication?

Aren’t these circuits very temperature dependent?. Do you have an idea of how strong this dependence will be?

How to convet the one value into log value

does equation five change if opamp is ideal.

Does the formula change if I add a resistor just before the ground on the diode drawing. the resistor would be between the ground and the positive side of the op-amp

which diode is use in log amplefier?

Pn junction diode

Well, any diode with normal thermal characteristics suffices. The Thermal Voltage for a standard diode comes to 26mV at room temperature of 30 degC

PN junction diode is used.

Excuse me but how can a NPN transistor work when base is grounded?

Because the transistor is in the common base configuration

Please make me clear about the final equation in diode model..Thank you..

i.e. Vin = Is R e(Vd/Vt)……………(5) e(Vd/Vt) = Vin/(IsR) ln[e(Vd/Vt)] = ln[Vin/(IsR)] Vd/Vt = ln[Vin/(IsR)] Vd = Vt ln[Vin/(IsR)]

Vout = -Vt ln[Vin/(IsR)]

please, i want more explanation about the transformation from equation 5 to the final form equation in the diode model thnx in advance

Type above and press Enter to search. Press Esc to cancel.

Linear Integrated Circuits Applications Tutorial

  • Linear Integrated Circuits Applications
  • Basics of Integrated Circuits Applications
  • Basics Operational Amplifier
  • Op-Amp applications
  • Arithmetic Circuits
  • Differentiator & Integrator
  • Converters Of Electrical Quantities
  • Comparators
  • Log & Anti-Log Amplifiers
  • Active Filters
  • Sinusoidal Oscillators
  • Waveform Generators
  • Phase Locked Loop Ic
  • Voltage Regulators
  • Data Converters
  • Digital to Analog Converters
  • DAC Example Problem
  • Direct Type ADCs
  • Indirect Type ADC
  • Useful Resources
  • Quick Guide
  • Selected Reading
  • UPSC IAS Exams Notes
  • Developer's Best Practices
  • Questions and Answers
  • Effective Resume Writing
  • HR Interview Questions
  • Computer Glossary

Log And Anti Log Amplifiers

The electronic circuits which perform the mathematical operations such as logarithm and anti-logarithm (exponential) with an amplification are called as Logarithmic amplifier and Anti-Logarithmic amplifier respectively.

This chapter discusses about the Logarithmic amplifier and Anti-Logarithmic amplifier in detail. Please note that these amplifiers fall under non-linear applications.

Logarithmic Amplifier

A logarithmic amplifier , or a log amplifier , is an electronic circuit that produces an output that is proportional to the logarithm of the applied input. This section discusses about the op-amp based logarithmic amplifier in detail.

An op-amp based logarithmic amplifier produces a voltage at the output, which is proportional to the logarithm of the voltage applied to the resistor connected to its inverting terminal. The circuit diagram of an op-amp based logarithmic amplifier is shown in the following figure −

Logarithmic Amplifier

In the above circuit, the non-inverting input terminal of the op-amp is connected to ground. That means zero volts is applied at the non-inverting input terminal of the op-amp.

According to the virtual short concept , the voltage at the inverting input terminal of an op-amp will be equal to the voltage at its non-inverting input terminal. So, the voltage at the inverting input terminal will be zero volts.

The nodal equation at the inverting input terminal’s node is −

$$\frac{0-V_i}{R_1}+I_{f}=0$$

$$=>I_{f}=\frac{V_i}{R_1}......Equation 1$$

The following is the equation for current flowing through a diode, when it is in forward bias −

$$I_{f}=I_{s} e^{(\frac{V_f}{nV_T})} ......Equation 2$$

$I_{s}$ is the saturation current of the diode,

$V_{f}$ is the voltage drop across diode, when it is in forward bias,

$V_{T}$ is the diode’s thermal equivalent voltage.

The KVL equation around the feedback loop of the op amp will be −

$$0-V_{f}-V_{0}=0$$

$$=>V_{f}=-V_{0}$$

Substituting the value of $V_{f}$ in Equation 2, we get −

$$I_{f}=I_{s} e^{\left(\frac{-V_0}{nV_T}\right)} ......Equation 3$$

Observe that the left hand side terms of both equation 1 and equation 3 are same. Hence, equate the right hand side term of those two equations as shown below −

$$\frac{V_i}{R_1}=I_{s}e^{\left(\frac{-V_0}{nV_T}\right)}$$

$$\frac{V_i}{R_1I_s}= e^{\left(\frac{-V_0}{nV_T}\right)}$$

Applying natural logarithm on both sides, we get −

$$In\left(\frac{V_i}{R_1I_s}\right)= \frac{-V_0}{nV_T}$$

$$V_{0}=-{nV_T}In\left(\frac{V_i}{R_1I_s}\right)$$

Note that in the above equation, the parameters n, ${V_T}$ and $I_{s}$ are constants. So, the output voltage $V_{0}$ will be proportional to the natural logarithm of the input voltage $V_{i}$ for a fixed value of resistance $R_{1}$.

Therefore, the op-amp based logarithmic amplifier circuit discussed above will produce an output, which is proportional to the natural logarithm of the input voltage ${V_T}$, when ${R_1I_s}=1V$.

Observe that the output voltage $V_{0}$ has a negative sign , which indicates that there exists a 180 0 phase difference between the input and the output.

Anti-Logarithmic Amplifier

An anti-logarithmic amplifier , or an anti-log amplifier , is an electronic circuit that produces an output that is proportional to the anti-logarithm of the applied input. This section discusses about the op-amp based anti-logarithmic amplifier in detail.

An op-amp based anti-logarithmic amplifier produces a voltage at the output, which is proportional to the anti-logarithm of the voltage that is applied to the diode connected to its inverting terminal.

The circuit diagram of an op-amp based anti-logarithmic amplifier is shown in the following figure −

Anti Logarithmic Amplifier

In the circuit shown above, the non-inverting input terminal of the op-amp is connected to ground. It means zero volts is applied to its non-inverting input terminal.

According to the virtual short concept , the voltage at the inverting input terminal of op-amp will be equal to the voltage present at its non-inverting input terminal. So, the voltage at its inverting input terminal will be zero volts.

$$-I_{f}+\frac{0-V_0}{R_f}=0$$

$$=>-\frac{V_0}{R_f}=I_{f}$$

$$=>V_{0}=-R_{f}I_{f}.........Equation 4$$

We know that the equation for the current flowing through a diode, when it is in forward bias, is as given below −

$$I_{f}=I_{s} e^{\left(\frac{V_f}{nV_T}\right)}$$

Substituting the value of $I_{f}$ in Equation 4, we get

$$V_{0}=-R_{f}\left \{{I_{s} e^{\left(\frac{V_f}{nV_T}\right)}}\right \}$$

$$V_{0}=-R_{f}{I_{s} e^{\left(\frac{V_f}{nV_T}\right)}}......Equation 5$$

The KVL equation at the input side of the inverting terminal of the op amp will be

$$V_{i}-V_{f}=0$$

$$V_{f}=V_{i}$$

Substituting, the value of 𝑉𝑓 in the Equation 5, we get −

$$V_{0}=-R_{f}{I_{s} e^{\left(\frac{V_i}{nV_T}\right)}}$$

Note that, in the above equation the parameters n, ${V_T}$ and $I_{s}$ are constants. So, the output voltage ${V_0}$ will be proportional to the anti-natural logarithm (exponential) of the input voltage ${V_i}$, for a fixed value of feedback resistance ${R_f}$.

Therefore, the op-amp based anti-logarithmic amplifier circuit discussed above will produce an output, which is proportional to the anti-natural logarithm (exponential) of the input voltage ${V_i}$ when, ${R_fI_s}= 1V$. Observe that the output voltage ${V_0}$ is having a negative sign , which indicates that there exists a 180 0 phase difference between the input and the output.

  • Relay Latching Circuit: How to Design
  • Multi-Switch Relay Control with EX-OR Gates
  • Mic Preamp Schematic: Elevate Your DIY Audio Projects
  • Simple Intruder Alarm Circuit
  • Exploring the ICL8038: Building an Audio Function Generator Circuit

Engineering Projects

Projects for Engineering Students

  • Electronic Tutorial

Logarithmic Amplifier using Diode and Transistor

  • It produces output that is proportional to the logarithmic input
  • It is a non-linear amplifier used for amplification or compression of a wide range of input signals for better resolution.
  • It can be used direct DB display on a spectrum analyzer.

You may also like: Antilogarithmic Amplifier

Log Amplifier using a Single Diode and Op-Amp

The circuit arrangement for the logarithmic amplifier/converter is illustrated in figure 1. Here a silicon diode D is connected in the feedback path and the current via the diode is dependent upon the output voltage.

Now from the diagram,

I_f = I_s\times (e^{\dfrac{V_D}{\eta V_T}})

Where I s = Saturation Current

V T = Thermal Voltage

\eta

Now, from the above condition we can write

I_f = I_s \times e^{\dfrac{V_D}{\eta V_T}}

Hence, V 0  is the logarithmic function of input voltage V in .

\eta V_T ln(\dfrac{1}{R T_s})

Log Amplifier using a transistor and op-amp

The circuit arrangement for the logarithmic amplifier is illustrated in figure 2. Here the NPN transistor is connected in the feedback path.

logarithmic amplifier using single transistor

Thus, we can write,

I_c = I_s\times e^{\dfrac{V_{BE}}{V_T}}

Log amplifier using two op-amps and two matched diodes

logarithmic amplifier using two matched diodes

R T = temperature dependent resistor

  • This circuit eliminates the saturation term by giving a constant current source.
  • Assuming two diodes are matched

I_f = I_s \times (e^{\dfrac{V_D}{\eta times V_T}}-1)

Thus, we can write

I_f = i_s \times (e^{\dfrac{V_d}{\eta \times V_T}})

Output diode voltage

V_D = \eta \times V_T ln \times (\dfrac{I_f}{I_s})

Now, form figure 3

V^+-V_{D2}+V_{D1} = 0

Now, putting the value of I R in the above equation of voltage output of diode.

\eta_1 \times V_{T1} \times ln (\dfrac{V_s}{R\times I_{s1}})

Assuming both diodes are matched

\eta_1 = \eta_2 = \eta

Subtracting equation 5 from equation 6

V_{D2}-V_{D1} = \eta \times V_T \times ln(\dfrac{I_R}{I_s})-\eta \times V_T \times ln(\dfrac{V_s}{R\times I_s})

Log amplifier using two matched transistors and two op-amps

  • It provides wide dynamic range amplification for input voltage then the diode

logarithmic amplifier using two matched transistors

From figure, we can write

V^+ - V_{BE2} + V_{BE1} = 0

For transistor,

I_c = I_s \times e^{\dfrac{V_{BE}}{V_T}}

Assuming two transistors are matched.

I_{s1} = I_{s2} = I_s

For transistor T 1

V_{BE1} = V_{T1} \times ln(\dfrac{I_C1}{I_{s1}})

For transistor T 2

V_{BE2} = V_{T2} \times ln (\dfrac{I_{c2}}{I_{s2}})

From equation 8

V^+ = V_{T2} \times ln(\dfrac{I_{c2}}{I_{s2}})-V_{T1} \times ln(\dfrac{T_{c1}}{I_{s1}})

  • Temperature-sensitive factors can be compensated by making the gain of op-amp A2 also temperature-sensitive by introducing the temperature-dependent resistor so as to make the circuit independent of temperature.

Share this:

  • Click to share on Facebook (Opens in new window)
  • Click to share on Twitter (Opens in new window)
  • Click to share on Pinterest (Opens in new window)
  • Click to share on LinkedIn (Opens in new window)

Leave a Comment Cancel reply

Notify me of follow-up comments by email.

Notify me of new posts by email.

Electricalvoice

Log Amplifier Circuit Applications

Log amplifier or logarithmic amplifier is an electronic circuit that produces output that is proportional to the logarithm of the applied input. Basically it performs mathematical operation of a logarithm. In this article, we will see the different log amplifier circuits, its working and log amplifier applications. Basically two circuits are there to perform the logarithmic function. First, using diode and op-amp and second, using BJT and op-amp.

Log amplifier using diode and op-amp

Log amplifier circuit using diode and op amp

Diode, resistor and op-amp used in the log amplifier as shown in figure 1. The input V i  is applied through resistor R at the inverting terminal. V o is the output voltage. The non-inverting terminal of the op-amp is connected to the ground. This means that the voltage of the non-inverting terminal is zero volts.

The analysis of the log amplifier is shown in figure 2. Since the op-amp is ideal and negative feedback is present, the voltage of the inverting terminal (V − ) is equal to the voltage of the non-inverting terminal (V + = 0V), according to the virtual short concept .

V − = V + = 0V

The currents entering both terminals of the op-amp are zero since the op-amp is ideal.

Log amplifier circuit using diode and op amp analysis

Let current I flows through the resistor R.

\begin{equation} \label{eq:poly}

I=\frac{V_{i}-0}{R}=\frac{V_{i}}{R}

\end{equation}

and diode current $I_{d}$,

I_{d}=I_{o}e^{\frac{V_{d}}{\eta V_{T}}}

where $V_d$ = forward bias voltage across diode D

Apply KCL at node P

$I = 0 + I_{d}$

$V_{d} = 0-V_{o}$

\[V_{d} = -V_{o}\]

Therefore, equation (2) becomes

I_{d}=I_{o}e^{-\frac{V_{o}}{\eta V_{T}}}

From equation (1), (3) and (4), we have

\[\frac{V_{i}}{R}=I_{o}e^{-\frac{V_{o}}{\eta V_{T}}}\]

\[\ln \frac{V_{i}}{I_{0}R}=-{\frac{V_{o}}{\eta V_{T}}}\]

Therefore, we have

\quicklatex{color=”#000000″ size=20} \boxed{V_{o}=-\eta V_{T}\ln \frac{V_{i}}{I_{0}R}}

Note: The above circuit is valid only for $V_{i}>0$.

Note: The negative sign in the output signifies that there is a 180° phase difference between output and the applied input.

Log amplifier using diode and transistor

Log amplifier circuit using transistor and op amp

Another circuit comprises of a BJT (NPN) T, resistor (R) and op-amp used as the log amplifier as shown in figure 3. The input V i  is applied through resistor R at the inverting terminal. V o is the output voltage. The non-inverting terminal of the op-amp is connected to the ground. This means that the voltage of the non-inverting terminal is zero volts.

The analysis of the log amplifier is shown in figure 4. Since the op-amp is ideal and negative feedback is present, the voltage of the inverting terminal (V − ) is equal to the voltage of the non-inverting terminal (V + = 0V), according to the virtual short concept .

logarithmic amplifier experiment

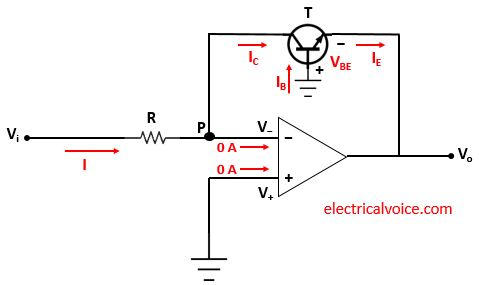
and collector current $I_{C}$,

I_{C}=I_{s}e^{\frac{V_{BE}}{\eta V_{T}}}

where $V_{BE} = V_B – V_E$

and I s = Reverse saturation current of emitter-base junction

As we know that

$I_C + I_B = I_E$

since I B ≅ 0 A

$I_C = I_E$

$I = 0 + I_{C}$

$V_{BE} = 0-V_{o}$

\[V_{BE} = -V_{o}\]

Therefore, equation (6) becomes

I_{C}=I_{s}e^{-\frac{V_{o}}{\eta V_{T}}}

From equation (5), (7), (8) and (9), we have

\[\frac{V_{i}}{R}=I_{s}e^{-\frac{V_{o}}{\eta V_{T}}}\]

\[\ln \frac{V_{i}}{I_{s}R}=-{\frac{V_{o}}{\eta V_{T}}}\]

\quicklatex{color=”#000000″ size=20} \boxed{V_{o}=-\eta V_{T}\ln \frac{V_{i}}{I_{s}R}}

Log amplifier Applications

1. It is used for measuring the signal strength.

Follow

  • Antilog Amplifier Circuit Applications
  • Inverting Amplifier – Applications
  • Non Inverting Amplifier – Applications
  • Op-amp Differentiator Circuit and Applications
  • Summing Amplifier or Op-amp Adder – Applications
  • Op-amp Integrator Circuit and Applications
  • Voltage Follower – Applications and Advantages
  • Differential Amplifier – Working and Applications
  • Op amp as a Comparator – Working
  • Current to Voltage Converter – Applications

Leave a Comment Cancel reply

This site uses Akismet to reduce spam. Learn how your comment data is processed .

web analytics

Tesca Global Blog

Study of Logarithmic and Anti-Logarithmic Amplifier

' src=

Table of Contents

Have you ever wondered how your favourite radio station can broadcast its signal to you? Or how your smartphone camera can adjust to different lighting conditions? It’s all thanks to the dynamic duo of logarithmic and anti-logarithmic amplifier ! These amplifiers play a vital role in a wide range of applications, from measuring the strength of a radio signal to determining the intensity of light in photonics. 

Uses, Components, Types and setup of Logarithmic and Anti-Logarithmic Amplifier

Whether you are a seasoned engineer or just starting to explore the world of electronics, understanding the concepts and applications of these amplifiers is essential, as these amplifiers work together to ensure that signals are accurately processed, and information is accurately conveyed. This comprehensive blog will delve into the theory and applications of logarithmic and anti-logarithmic amplifiers, exploring the different types of amplifiers, their advantages, and their limitations.

Here we are read about uses, components, types and setup of Logarithmic and Anti-Logarithmic Amplifier Training Board

What is a Logarithmic and Anti-Logarithmic Amplifier Training Board?

A Logarithmic and Anti-Logarithmic Amplifier Training Board is an educational tool designed to teach students and engineers about the principles and applications of logarithmic and anti-logarithmic amplifiers. This training board is a laboratory-style setup that provides hands-on experience and practical knowledge of these amplifiers.

While the board typically consists of various components, such as logarithmic and anti-logarithmic amplifiers, input signals, power supplies, oscilloscopes, and other equipment, the setup allows students and engineers to experiment with different configurations of the amplifiers and observe the effect on the input signal. They can also measure the accuracy and performance of the amplifiers and learn how to troubleshoot any issues that may arise. Engineers can also use it to test and optimize new amplifier designs and evaluate the performance of existing amplifiers under different conditions.

The applications of logarithmic and anti-logarithmic amplifiers are numerous and diverse. They are used in radio communications to measure the strength of a radio signal, in audio systems to adjust the volume of a sound, and in photonics to measure light intensity. These amplifiers are also commonly used in scientific instruments, such as oscilloscopes, to display signals in a logarithmic format, making it easier to observe and analyze signals that span a wide range of values.

Uses of Logarithmic and Anti-Logarithmic Amplifier Training Board?

The Logarithmic and Anti-Logarithmic Amplifier Training Boards are used for educational and training purposes in electrical and electronics engineering. Some of the common uses of this training board include:

  • Purpose : The Logarithmic and Anti-Logarithmic Amplifier Training Board are designed for educational and training purposes in electrical and electronics engineering.
  • Hands-on experience : The board provides students with hands-on experience in designing, testing, and analyzing logarithmic and anti-logarithmic circuits, helping them understand the principles practically.
  • Circuit design and troubleshooting : Students can build and test logarithmic and anti-logarithmic circuits, enabling them to practice their circuit design and troubleshooting skills.
  • Real-world applications : The board demonstrates how logarithmic and anti-logarithmic amplifiers are used in real-world applications such as signal processing, data acquisition, and measurement systems.
  • Technical skill development : Students can develop various technical skills, such as circuit design, testing, and analysis, as well as troubleshooting and problem-solving skills.
  • Interactive learning : The Logarithmic and Anti-Logarithmic Amplifier Training Board provide students with an interactive and hands-on learning experience that deepens their understanding of logarithmic and anti-logarithmic amplifiers and their applications.

Overall, the Logarithmic and Anti-Logarithmic Amplifier Training Board provide students and trainees with an interactive and hands-on learning experience that helps them develop a deeper understanding of logarithmic and anti-logarithmic amplifiers and their applications.

Working Principle of Logarithmic and Anti-Logarithmic Amplifier?

The working principle of a logarithmic amplifier is to produce an output voltage proportional to the logarithm of the input voltage. Imagine you’re climbing a mountain and trying to keep track of your altitude. The range of elevations you encounter is massive, from sea level to the summit, and it can be challenging to track your progress. But what if you could map your journey on a logarithmic scale, where each step represents a set percentage increase in elevation? This is where the use of a logarithmic amplifier comes in. 

It maps a wide range of input voltage levels into a much smaller range of output levels, making it useful for applications where an extensive dynamic range is required. On the other hand, the anti-logarithmic Amplifier produces an output voltage proportional to the exponential of the input voltage.

The exponential function maps a small range of input voltage levels into a much more extensive range of output levels, making it useful for applications where a high voltage gain is required. The specialized circuits used in amplifiers take a wide dynamic range of input signals and map them to a smaller or larger dynamic range of output signals, respectively. Think of it as compressing or expanding your mountain climb range to make it easier to track.

Both logarithmic and anti-logarithmic amplifiers are typically implemented using specialized ICs (Integrated Circuits) or active devices such as diodes or transistors. While the basic circuit for a logarithmic amplifier typically includes an input stage with a logarithmic characteristic, a gain stage adjusts the overall gain of the circuit, and an output stage drives the load. Similarly, the anti-logarithmic amplifier circuit includes an input stage with an exponential characteristic, a gain stage to adjust the overall gain, and an output stage to drive the load.

Components of the Logarithmic and Anti-Logarithmic Amplifier Training Board?

A Logarithmic Amplifier and Anti-Logarithmic Amplifier Training Board typically consists of the following components:

1. Logarithmic Amplifier :

    * Operational Amplifier (Op-Amp)

    * Feedback Resistor Network

    * Diodes

    * Zener Diodes

    * Capacitors

Read also: Difference Between Diode, Zener Diode and LED ! TescaGlobal

2. Anti-Logarithmic Amplifier :

    * Potentiometers

3. Power Supply Unit :

    * DC Power Supply

    * Regulators

    * Voltage Reference

    * Protection Circuitry

    * Indicators (LEDs)

4. Input/Output Connectors :

    * BNC Connectors

    * Terminal Blocks

5. PCB (Printed Circuit Board)

These components are used to perform logarithmic and anti-logarithmic amplification, which are helpful in various applications such as signal processing, data conversion, and power control.

Logarithmic and Anti-Logarithmic Amplifier Training Board Setup?

The setup of a Logarithmic and Anti-Logarithmic Amplifier Training Board typically involves the following steps:

1. Unpacking the Board : Carefully unpack the board and make sure all components are present and in good condition.

2. Assembly : Assemble the board’s components as per the instructions provided in the manual. Make sure all connections are secure and tight.

3. Power Supply : Connect the power supply to the board, ensuring the voltage and current ratings are as specified in the manual.

4. Input Signals : Connect the input signals to the board, ensuring the voltage and current levels are within the specified range.

5. Output Signals : Connect the output signals to an oscilloscope or other measuring instrument to observe the output waveform.

6. Calibration : Calibrate the board as per the instructions provided in the manual, making sure all parameters are within the specified range.

7. Testing : Test the board by applying various input signals and observing the corresponding output signals. Make any necessary adjustments to the board to optimize performance.

8. Documentation : Keep detailed records of the setup process, including any adjustments made to the board and the results of the tests performed. This documentation will be helpful for future reference and troubleshooting.

You also need to know how to connect the components internally through these steps. 

1. Power Supply Unit :

    * Connect the DC power supply to the board’s power supply input.

    * Turn on the power supply and adjust the voltage to the required value.

    * Check the voltage readings using the indicators on the board.

2. Logarithmic Amplifier :

    * Connect the input signal to the input of the Logarithmic Amplifier.

    * Adjust the potentiometer on the board to set the input signal level.

    * Observe the output signal on an oscilloscope or voltmeter.

3. Anti-Logarithmic Amplifier :

    * Connect the input signal to the input of the Anti-Logarithmic Amplifier.

4. Input/Output Connections :

    * Connect the input and output signals using the BNC connectors or terminal blocks.

    * Make sure that the connections are secure.

These steps will help you set up the Logarithmic and Anti-Logarithmic Amplifier Training Board and perform experiments to understand the functioning of these amplifiers. It’s essential to follow the instructions and safety precautions specified by the manufacturer to ensure proper functioning and avoid damage to the components.

Types of Logarithmic and Anti-Logarithmic Amplifier Training Board?

There are two main types of Logarithmic and Anti-Logarithmic Amplifier Training Boards: analogue and digital.

  • Analog Logarithmic and Anti-Logarithmic Amplifier Training Board : This type of board uses analogue circuits and is typically used for electrical and electronics engineering educational purposes. The analogue board provides students with a hands-on learning experience, allowing them to understand and practice the principles of logarithmic and anti-logarithmic amplifiers.
  • Digital Logarithmic and Anti-Logarithmic Amplifier Training Board : The digital version of the training board operates using digital circuits and is used to teach students about the design and implementation of logarithmic and anti-logarithmic amplifiers in modern digital systems. This type of board is often used in advanced training programs and provides students with experience designing and testing digital logarithmic and anti-logarithmic circuits.

Both Logarithmic and Anti-Logarithmic Amplifier Training Boards have advantages and limitations. The choice of a board depends on the application’s specific requirements and the user’s skill level. Analog boards help learn the fundamentals of logarithmic and anti-logarithmic amplification, while digital boards offer more versatility and precision in a compact form factor.

Logarithmic and Anti-Logarithmic Amplifier Training Board Brochure?

A brochure for a Logarithmic and Anti-Logarithmic Amplifier Training Board would provide an overview of the product, its functions, and its benefits for students, engineers, and educators in electronics and electrical engineering. A Logarithmic and Anti-Logarithmic Amplifier Training Board brochure, is a helpful resource for anyone looking to buy or learn more about the product. Potential clients can more easily comprehend what the training board offers and how it can be utilized, thanks to the brochure’s thorough presentation of the product’s characteristics.

The brochure’s introduction of the product and discussion of its advantages is one of its primary goals. Potential consumers can more easily comprehend the product and its benefits by reading the brochure, which can outline the Logarithmic and Anti-Logarithmic Amplifier Training Board and its function. To assist buyers, it can also outline the essential characteristics of the training board, such as its design, functionality, and instructional value. The brochure may include the following information:

  • Introduction to logarithmic and anti-logarithmic amplifiers and their applications
  • Description of the training board’s features, such as input and output signal ranges, available circuits and experiments, and hardware specifications
  • Explanation of the educational resources included with the training board, such as tutorials, experiments, and project ideas
  • List of vital technical specifications, including power supply requirements, dimensions, and weight
  • Images and diagrams to help illustrate the training board’s features and functions.

Overall, the brochure would provide an in-depth look at the Logarithmic and Anti-Logarithmic Amplifier Training Board and its capabilities as a tool for hands-on learning and experimentation in electronics.

Logarithmic and Anti-Logarithmic Amplifier Training Board Price?

The average price range of a Logarithmic and Anti-Logarithmic Amplifier Training Board can vary depending on the features and specifications included. Entry-level models can cost anywhere from a few hundred to a few thousand dollars. More advanced models with additional features and capabilities could cost several thousand dollars. But there are several other factors to consider while choosing a product that meets your needs and provides the best value. Some of these factors include:

  • Purpose : Consider what you will use the training board for and what types of experiments or projects you plan to perform.
  • Features : Look for a board with the features and specifications you need, such as the range of input and output signals, the number of circuits and experiments available, and the quality and accuracy of the hardware and software.
  • Educational resources : Consider whether the training board comes with comprehensive educational resources, such as tutorials, experiments, project ideas, and support materials, to help you get the most out of your purchase.
  • Compatibility : Ensure the training board is compatible with your existing equipment and hardware, such as power supplies and data acquisition systems.
  • Brand and reputation : Consider the importance of the manufacturer and the quality of their products and support services.

Considering these factors, you can choose a Logarithmic and Anti-Logarithmic Amplifier Training Board that meets your needs and provides the best value for your investment.

Tesca Global Logarithmic and Anti-Logarithmic Amplifier Training Board?

Tesca Global’s 36372 Experimental Training Board is a comprehensive and self-contained tool for studying temperature-compensated logarithmic and anti-logarithmic amplifiers. It is designed specifically for science and engineering students, providing a hands-on educational experience that can be very valuable.

The board has various built-in components, including a regulated power supply, reference voltage, digital voltmeters, OP-AMPs , transistors, and other electronic components, making it easy to start your experiments immediately.

Additionally, the board features a compact and portable design, with dimensions of W 340 x H 125 x D 210 and a weight of 2.100 kg. It makes the Amplifier easy to transport and use in various settings, from a lab or classroom to a workshop or maker space.

Overall, Tesca Global’s 36372 Experimental Training Board is a high-quality, reliable tool that provides a comprehensive learning experience for students studying logarithmic and anti-logarithmic amplifiers. Its built-in components, compact design, and practical educational value make it an excellent choice for anyone looking to improve their understanding of these critical electronic circuits.

In addition to its practical value, Tesca Global ‘s 36372 Experimental Training Board is also an important educational tool, providing students with hands-on experience in studying logarithmic and anti-logarithmic amplifiers. One of the key advantages of Tesca Global’s 36372 Experimental Training Board is its built-in components, which include a regulated power supply, reference voltage, digital voltmeters, OP-AMPs, transistors, and other electronic components. 

These components provide students with a complete and ready-to-use setup, making it easy to start their experiments immediately. By working with this training board, students can gain a deeper understanding of these essential electronic circuits and the principles and concepts that underlie their operation.

Related posts:

  • Electrical Specimen Board: A Simple (But Complete) Guide
  • A Complete Guide on Digital Overlay Learning System
  • IC Trainer Kit: Introduction, Uses, Diagram & Manufacturer
  • A Complete Guide on Semi-Conductor Devices Characteristics Training Board

' src=

Ashok Pareek

Add comment, cancel reply.

Save my name, email, and website in this browser for the next time I comment.

This site uses Akismet to reduce spam. Learn how your comment data is processed .

You may also like

  • Unveiling the Future of Educational Systems: Embracing the EdTech Revolution

Table of Contents The Future of Educational Systems: A Glimpse into EdTech1. Current Challenges in Education2. The Rise of EdTech3. Empowering Teachers with EdTech4. Transforming the Learning Experience5. The Role of...

logarithmic amplifier experiment

  • Transforming Education: The Vital Role of AI in Modern Educational Systems

Table of Contents Embracing AI in Education1. Understanding AI in Education1.1 The Emergence of AI in Educational Settings1.2 Benefits of AI Adoption in Education2. Personalized Learning through AI2.1 Tailoring...

  • Safe Handling and Maintenance of Lab Equipment: A Guide

Table of Contents 13 Tips to Safely Use and Maintain Lab EquipmentTypes of Lab Equipment1. General Safety Guidelines in the Laboratory2. Safe Usage of Common Lab Equipment3. Maintaining Laboratory Glassware4...

  • The Significance of Lab Equipment in STEM Education

Table of Contents What is STEM Education?Importance of Hands-on LearningThe Role of Lab Equipment in STEM Education1. Understanding Theoretical Concepts through Experiments2. Developing Analytical and Critical Thinking3...

PRODUCTS CATEGORIES

  • EDUCATIONAL TRAINER / SOFTWARE
  • TEST & MEASUREMENT INSTRUMENTS
  • E-LEARNING LMS / CMS
  • SCIENCE LAB
  • MECHANICAL & CIVIL LAB
  • CIVIL ENGINEERING
  • HAND / POWER TOOLS
  • ELECTRONIC COMPONENTS
  • AGRI. PRODUCTS
  • LABORATORY PLASTICWARE
  • SCHOOL PRODUCTS
  • SOLAR PRODUCTS
  • WEB & SOFTWARE APPLICATIONS
  • CABLES & WIRES
  • SWITCH GEAR CONTROL PANELS
  • IT – COMPUTERS – NETWORKING
  • SOLDERING & DESOLDERING STATION
  • VARIACS/DIMMERSTAT
  • OIL INSULATION TESTERS
  • FLUKE PRODUCTS
  • LAB FURNITURE
  • INTERACTIVE WHITEBOARDS

Recent Posts

  • Tesca Global: Best Lab Furniture Manufacturer In India

[INSERT_ELEMENTOR id="576"]

Tesca Global Pvt Ltd Logo (1)

Tesca specializes in doing turnkey projects that are fully operable when it is handed over to the project authority. Starting from inception to application training, Tesca provides the services as ONE source solution. Working side by side with government authorities and people across the World, we help countries to perform better. We support countries to grow their economies, strengthen their education and health systems and improve financial management. We do this by providing consultancy & training in environmental safety, education, and health strengthening.

ALSO DEALS IN

  • Variacs/Dimmerstat
  • Laboratory Plasticware
  • Whatman Filters
  • Science Lab
  • Educational Trainers
  • Test & Measurement Instruments
  • Soldering & Desoldering Station
  • Hand / Power Tools
  • Authorized Dealers
  • CERTIFICATES
  • PRIVACY POLICY
  • TESTIMONIALS

Copyright © 2024. Created by Meks . Powered by WordPress

  • Web Stories
  • Engineering & Technology
  • Electrical Engineering

Experiment No. -1 Aim: To Plot the Frequency Response of a single

Related documents.

Current and Voltage Relationship for a Capacitor: Derivative

Add this document to collection(s)

You can add this document to your study collection(s)

Add this document to saved

You can add this document to your saved list

Suggest us how to improve StudyLib

(For complaints, use another form )

Input it if you want to receive answer

Officials probe death of Wells Fargo employee found in her cubicle 4 days after last scanning into work

A 60-year-old Arizona Wells Fargo employee scanned into her office on a Friday on what appeared to be an ordinary workday. Then, four days later, she was found dead in her cubicle.

Denise Prudhomme, 60, was found dead on Aug. 20 in her office in Tempe, police said.

She had last scanned in the building at 7 a.m. on Aug. 16, a Friday, and there was no further scan in or out of the office, authorities said.

Tempe police responded to the Wells Fargo office in the 1100 block of West Washington Street after on-site security called about an employee they believed to be dead. She was pronounced dead at 4:55 p.m., police said.

The cause of death is pending determination by the Maricopa County medical examiner. Police said the preliminary investigation showed no obvious signs of foul play.

The investigation continues.

It's not clear how Prudhomme had gone unnoticed for so long. NBC affiliate KPNX of Phoenix reported that she worked in a cubicle on the third floor, away from the main aisle.

An employee who spoke with KPNX on the condition of anonymity said that a colleague found her at her desk while walking around the building and that several people had smelled a foul odor but believed it to be faulty plumbing. 

Wells Fargo confirmed she sat in an underpopulated area of the building.

“We are deeply saddened by the loss of our colleague, Denise Prudhomme. Our thoughts are with her family and loved ones, and we are in contact to ensure they are well supported during this difficult time,” the company said in a statement Thursday .

It said that it is "committed to the safety and wellness of our workforce" and that it is "reviewing our own internal procedures after this event."

Counselors have been made available to support employees. Prudhomme's fellow employees were told of her death after the company notified her family, Wells Fargo said.

Marlene Lenthang is a breaking news reporter for NBC News Digital.

Please enter your information to subscribe to the Microsoft Fabric Blog.

Microsoft fabric updates blog.

Microsoft Fabric August 2024 Update

  • Announcements

Data Engineering

Data factory, data science, data warehouse.

  • Microsoft Fabric
  • Monthly Update

Real-Time Intelligence

Headshot of article author

Welcome to the August 2024 Update.

Here are a few, select highlights of the many we have for Fabric. V-Order behavior of Fabric Warehouses allows you to manage the V-Order behavior at the warehouse level. Monitor ML Experiments from the Monitor Hub allows you to integrate experiment items into Monitoring Hub with this new feature. You can easily browse and connect to your Azure resources automatically with the modern data experience of Data Pipeline.

There is more to explore, please continue to read on.

European Fabric Community Conference

Join us at Europe’s first  Fabric Community Conference , the ultimate  Power BI,   Fabric, SQL & AI  learning event in  Stockholm, Sweden  from  September 24 -27, 2024 .

With 120 sessions, daily keynotes, 10 pre-conference workshops, an expo hall with community lounge, and “ask the expert” area, the conference offers a rich learning experience you don’t want to miss. This is a unique opportunity to meet the Microsoft teams building these products, customers betting their business on them, and partners at the forefront of deployment and adoption.

Register today  using code MSCUST for an  exclusive discount  on top of  early bird pricing!

Attention Power BI users! 

If you are accessing Power BI on a web browser version older than Chrome 94, Edge 94, Safari 16.4, Firefox 93, or equivalent, you need upgrade your web browser to a newer version by  August 31, 2024 . Using an outdated browser version after this date, may prevent you from accessing features in Power BI.

Ask Copilot questions against your semantic model (preview)

Visual level format strings (preview), dynamic per recipient subscriptions (generally available), deliver subscriptions to onedrive and sharepoint (generally available), updated save and upload to onedrive flow in power bi, visuals, shapes and line enhancements, dax query view in the web, narrative visual with copilot available in saas embed, paginated reports: sharing of reports connecting to get data data sources made easy, workspace filter improvement to support nested folders, onelake data access role improvements, managing v-order behavior of fabric warehouses, delta lake log publishing pause and resume, alter table add nullable column, truncate table, mirroring azure sql database, mirroring integration with modern get data experience, announcing mssparkutils upgrade to notebookutils, import notebook ux improvement, fabric runtime lifecycle, semantic link labs is now live, apply mlflow tags on ml experiment runs and model versions, track related ml experiment runs in your spark application, monitor ml experiments from the monitor hub, use predict with fabric automl models, the ai skill is now in public preview, fabric real-time hub teaching bubble, kql queryset rest api support, certified connector updates, new connectors, data warehouse connector supports tls 1.3, easily connect to your azure resources by modern get data experience in data pipeline.

Copilot and AI

You can now ask Copilot for data from your entire semantic model in Desktop ! Just tell Copilot what you’re looking for, and Copilot will query your model to answer your question with a visual.

Since the Copilot pane in Desktop is still in preview, you do not need to turn on the preview toggle to use this new capability.

logarithmic amplifier experiment

To find out more about how this feature works and the types of questions that are supported check out our previous blog post and documentation page .

Visual level format strings are here, providing you with more options to configure formatting. Originally built for visual calculations, the core ability that visual-level format strings provide is the ability to format visual calculations. Since visual calculations are not in the model, you could not format them, unless you were using them in data labels or in specific parts of the new card and new slicer visuals. With visual level format strings, you can!

logarithmic amplifier experiment

Visual level format strings, however, are useful even without using visual calculations.

With the introduction of visual-level format strings, Power BI now has three levels for format strings:

  • Model. You can set a format string for columns and measures in the model. Anywhere you use that column or measure the format string will be applied, unless it’s overridden by a visual or element level format string.
  • Visual. This is what we’re introducing today. You can set format strings on any column, measure or visual calculation that is on your visual, even if they already had a format string. In that case the model level format string will be overridden, and the visual level format string is used.
  • Element. You can set a format string for data labels and for specific elements of the new card and the new slicer visuals. This level will be expanded to include much more in the future. Any format string you set here will override the format string set on the visual and model level.

These levels are hierarchical, with the model level being the lowest level and the element level the highest. A format string defined on a column, measure or visual calculation on a higher-level override what was defined on a lower level.

logarithmic amplifier experiment

Since visual calculations are not in the model, they cannot have a format string set on the model level but can on the visual or element level. Measures and columns can have format strings on all three levels:

Level

Impacts

Available for

ELEMENT

Selected element of the selected visual

X

X

Visual

Selected visual

X

X

Model

All visuals, all pages, all reports on the same model

X


The image below summarizes this and shows that higher level format strings override lower-level format strings:

logarithmic amplifier experiment

Take a look at this example using a measure.

There is a Profit measure in the model, which is set to a decimal number format. To do this, you might have set the formatting for this measure using the ribbon:

logarithmic amplifier experiment

Alternatively, you could have made the same selections in the properties pane for the measure in the model view or entered the following custom formatting code:

logarithmic amplifier experiment

If you put this measure on a visual it now returns a decimal number, as expected:

logarithmic amplifier experiment

However, on a particular visual you want that measure to be formatted as a whole number. You can now do that by setting the format code on the visual level by opening the format pane for that visual and the Data format options found there under General:

logarithmic amplifier experiment

Now that same measure shows as a whole number, but just on that visual:

logarithmic amplifier experiment

On top of that, you might want to use a scientific notation for that measure but only in the data label on a particular visual. No problem, you set the format code on the data label for that measure:

logarithmic amplifier experiment

Now the total shows in scientific notation, but only in the data label and not in other places (such as the tooltip as shown below). Notice how the element level format is used in the data label but the visual or model level format string is still used for the other elements in the same visual.

logarithmic amplifier experiment

For visual calculations the same principle applies but of course without the model level. For example, if you have a visual calculation that returns a percentage, you can now format it as such using the Data Format options in the General on the visual in the format pane:

logarithmic amplifier experiment

The ability to set visual level format strings makes it much easier to get the exact formatting you need for your visualizations. However, this is only the first iteration of the visual level format strings. We are planning to add the settings you’re used to for the model level format strings to the visual level soon.

Since visual level format strings are introduced as part of the visual calculations preview, you will need to turn on the visual calculations preview to use them. To do that, go to Options and Settings > Options > Preview features . Select Visual calculations and select OK . Visual calculations and visual level format strings are enabled after Power BI Desktop is restarted.

Please refer to our docs to read more about format strings or visual calculations .

Dynamic per recipient subcriptions are now generally available for Power BI and paginated reports. Dynamic per recipient subscriptions is designed to simplify distributing a personalized copy of a report to each recipient of an email subscription. You define which view of the report an individual receives by specifying which filters are applied to their version of the report. The feature is now available in Sov. Clouds as well.

Create a dynamic per recipient with a simple drag and drop experience. First, subscribe to the report by selecting “Subscribe to report”, then “Create Subscriptions”.

logarithmic amplifier experiment

Select “Dynamic per recipient” subscription.

logarithmic amplifier experiment

Connect to data that has recipient email, names or report parameters.

logarithmic amplifier experiment

Then, select and filter data that you want in your subscription. You probably only want to send emails conditionally. To do that, you can filter the data in the “Filter” pane.

logarithmic amplifier experiment

You can select the recipient email addresses and the email subject from the dataset that you connected to by selecting “Get Data”.

logarithmic amplifier experiment

Then map your data to the subscription.

logarithmic amplifier experiment

Next, schedule the subscription and save it.

logarithmic amplifier experiment

The subscriptions will be triggered based on the schedule that you have set up. Personalized reports can be sent to up to a thousand recipients! Learn more about Dynamic per recipient subscriptions for Power BI reports, and paginated reports .

Do you have reports that are too large to be delivered by email? Do you have reports that are eating into your email in just a few weeks, or do you need you to move it to a different location? You can now deliver Power BI and paginated report subscriptions to OneDrive or SharePoint. With this capability, you can schedule and send full report attachments to a OneDrive or SharePoint location. Learn more about how to deliver report subscriptions to OneDrive or SharePoint .

logarithmic amplifier experiment

Beginning the first weeks of August, desktop users should see a preview switch starting in SU8 to turn on the updated Save and Upload to OneDrive experience in Power BI. To enable this, navigate to the Preview features section of Options in Power BI. Users will then need to select “Saving to OneDrive and SharePoint uploads the file in the background”.

With these updates, we’ve improved the experience of uploading new Power BI files to OneDrive, and easily upload new changes in the background.

logarithmic amplifier experiment

Preview switch that needs to be selected.

For uploading new files, after navigating to the correct location in the OneDrive file picker and saving, a dialog box appears while the file is being uploaded. The option to cancel the upload is there if needed. This dialog will only show up the first time a new file is uploaded to OneDrive.

logarithmic amplifier experiment

Dialog for saving a new file to OneDrive.

When new changes are saved to a file uploaded to OneDrive, the top of the toolbar indicates that the new changes are also being uploaded to OneDrive.

logarithmic amplifier experiment

Additional changes being uploaded in the background to the existing file.

If you click on the title bar flyout in the toolbar, you can also now access more information about the file. Clicking “View your file in OneDrive” will provide a direct link to where the file is stored in OneDrive.

logarithmic amplifier experiment

Drop down including the link to the file in OneDrive.

We are introducing the data limit capability to help you manage performance issues. This feature allows you to set the maximum data load for a single session per visual displaying only the rows of data in an ascending order by default.

To use this feature:

  • Go to the ‘Filters on this visual’ menu in the filter pane.
  • Click on the data limit menu to open a new filter card.

logarithmic amplifier experiment

3. Set your desired data limit value.

logarithmic amplifier experiment

The filter card features include:

  • Removing, locking, or clearing filters.
  • Hiding or showing filters.
  • Expanding or collapsing filter cards.
  • Applying filters.
  • Renaming and reordering filters.

Report consumers can see any data limits applied to a visual in the filter visual header, even if the filter pane is hidden.

Over the past few months, we have been fine-tuning the visual elements of your reports, including columns, bars, ribbons, and lines. We have given you the ability to craft these Cartesians with precision. However, we noticed that the legends and tooltips were not quite accurate.

logarithmic amplifier experiment

With the latest update, the legend and tooltip icons will now automatically and accurately reflect per-series formatting settings, such as border colors, shapes, and line styles. This makes it easier to match series to their visual representations. Additionally, we have added consistency to how per-series formatting is applied to line charts, column/bar charts, scatter charts, and other Cartesian formatting options for common items like error bars and anomalies.

Write DAX queries on your published semantic models with DAX query view in the web. DAX query view, already available in Power BI Desktop, is now also available when you are in the workspace.

Look for Write DAX queries on your published semantic model.

  • Right-click on the semantic model and choose Write DAX queries .
  • Click on the semantic model to open the details page, then click Write DAX queries at the top of the page.

logarithmic amplifier experiment

This will launch DAX query view in the web, where you can write DAX queries, use quick queries to have DAX queries written for you on tables, columns, or measures, or use Fabric Copilot to not only write DAX queries but explain DAX queries, functions, or topics. DAX queries work on semantic models in import, DirectQuery, and Direct Lake storage mode.

logarithmic amplifier experiment

Write permission, that is permission to make changes to the semantic model, is currently needed to write DAX queries in the web. And, the workspace setting, User can edit data models in the Power BI service (preview) , needs to be enabled.

DAX query view in the web includes DAX query view’s way to author measures. Define measures with references, edit any of them, and try out changes across multiple measures by running the DAX query, then update the model with all the changes in a single click of a button. DAX query view in web brings this functionality for the first time to semantic models in Direct Lake mode!

logarithmic amplifier experiment

If you do not have write permission, you can still live connect to the semantic model in Power BI Desktop and run DAX queries there.

Try out DAX query view in web today and learn more about how DAX queries can help you in Power BI and Fabric.

  • Deep dive into DAX query view in web
  • DAX queries
  • Work with DAX query view
  • Deep dive into DAX query view and writing DAX queries
  • Write DAX queries with Copilot
  • Deep dive into DAX query view with Copilot
  • Overview of Copilot for Power BI
  • Direct Lake

Embedded Analytics

Narrative visual with Copilot is available for user owns data scenarios (SaaS) and secure embed. When a user embeds a report containing the narrative visual in a solution where users must sign in – they will now be able to refresh the visual with their data. The first step on our Copilot embed journey!

When you embed a Power BI report in an application in the “embed for your organization” scenario, it allows organizations to integrate rich, interactive data visualizations seamlessly into their internal tools and workflows. Now this solution supports the Copilot visual. A sales team might want to embed a Power BI report in their internal CRM application to streamline their workflow. By integrating sales performance dashboards directly into the CRM, team members can easily monitor key metrics like monthly sales targets, pipeline status, and individual performance, without switching between different tools. This integration enables quicker access to actionable insights, helping the team make informed decisions, identify trends, and react swiftly to market changes, all within the secure environment of their organization’s data infrastructure.

Supported Scenarios:

  • Embed a report in a secure portal or website Power BI.
  • User owns data : A user embeds a report containing the narrative visual in a solution where users must sign in. They need a license to do so. This action is also known as embed for your organization . It includes when users want to embed visuals in solutions like PowerPoint as well.

Unsupported Scenario:

  • App owns data: A customer embeds a narrative visual on a website where users visit, and don’t need to sign in. Also known as embed for your customer’s application .

To get this set up, there are a few steps to follow – so make sure to check out the documentation . 

You will need to Edit your Microsoft Entra app permissions to enable the embedded scenario to work.

logarithmic amplifier experiment

From here you’ll need to add the MLModel.Execute.All permission.

logarithmic amplifier experiment

Once completed, your visual should work in your embedded experiences where users still sign in.

Check out the documentation for additional details.

We announced the ability to create paginated reports from Power BI Report Builder by connecting to over 100 data sources with the Get Data experience. You can learn more about Connect paginated reports to data sources using Power Query (Preview) – Power BI | Microsoft Learn. You no longer need to share the shareable cloud connection. You only need to share the report and ensure that those consuming the report have access to view the report. This update will be rolling out in the coming weeks.

Since folders were introduced in workspaces, it can be hard to find items sometimes because they are all hidden in the hierarchy. We have upgraded the filter experience to support filtering through the entire workspace or through a specific folder with all its nested folders.

logarithmic amplifier experiment

OneLake data access roles allow for granular security to be defined within a lakehouse. This month, we’ve updated data access roles based on key feedback.

The assign roles page in the user interface has been redesigned to make it easier to understand access. The page now has the “Add people or groups” control front and center, with less emphasis on assigning users via item permissions.

Item permissions control has been rebuilt for ease of use, including a new “user count” to show how many users will get added to the role based on the permissions you select. The members list now includes sort options and shows newly added users and groups with an icon to help validate pending changes.

Schema support for lakehouses was announced last month, and OneLake data access roles now allows for defining security for schemas. Schema support follows the same inheritance model as folders, allowing multiple tables to be managed easily by securing the parent schema. To get started with schema level security, create a new lakehouse and check the “enable schemas” preview button, and then enable OneLake data access roles for that lakehouse.

To learn more or get started, view the documentation on OneLake data access roles .

V-Order is a write-time optimization for the Parquet file format, enabling Direct Lake mode with Power BI. It applies special sorting and compression to Parquet files, offering query benefits but potentially increasing data ingestion time in Fabric Warehouse.

We are excited to share a new feature in Fabric Warehouse that allows you to manage V-Order behavior at the warehouse level. You can now disable V-Order, providing better control over ETL performance when V-Order is unnecessary. This enhancement is particularly beneficial for scenarios where V-Order optimization may not offer significant advantages, such as in typical ETL processes with write-intensive staging tables.

Disabling V-Order on a warehouse is a non-reversible operation. You should thoroughly test the performance of your warehouse queries and ETL processes to determine if this option is suitable for your scenario before disabling it. Currently, there is no way to re-enable V-Order.

For more details and to determine if disabling V-Order is suitable for your scenarios, refer to the product documentation.

Fabric Warehouse publishes Delta Lake Logs for every table created in your Warehouses. Any modifications made to a Warehouse table will be reflected in the Delta Lake Log within a minute of the transaction being committed. This enables other analytical engines in Microsoft Fabric to read the latest data on user tables without any data duplication.

This new feature allows you to pause and resume the publishing of Delta Lake Logs for Warehouses. When publishing is paused, Microsoft Fabric engines that read tables outside of the Warehouse will see the data as it was before the pause. This ensures that reports remain stable and consistent, reflecting data from all tables as they existed before any changes were made to the tables. It is especially beneficial if you have many tables and reports that are frequently changing, it will minimize the risk of data inconsistencies.

Once your ETL/ELT process is complete, you can resume Delta Lake Log publishing to make all recent data changes visible to other analytical engines.

To learn more about Delta Lake Log publishing pause and resume, refer to the product documentation.

Alter Table add Nullable Columns is now generally available! This feature allows for adding new nullable columns to previously created Delta Parquet-backed tables in a warehouse in Microsoft Fabric. In the ever-evolving data landscape of data organizations, schemas are shifting and changing to keep up with the influx of new data.

Whether your schema modifications are few and far between, or a regular occurrence that constantly needs to adapt to changing requirements, we have you covered. Our goal is to ensure that customers have everything they need for a seamless warehousing experience, and we continue to strive towards ensuring our TSQL surface area meets the needs of our customers.

Note that today, only the following subset of ALTER TABLE operations in Warehouse in Microsoft Fabric are supported:

  • ADD nullable columns of supported column data types.
  • ADD or DROP PRIMARY KEY, UNIQUE, and FOREIGN_KEY column constraints, but only if the NOT ENFORCED option has been specified.

All other ALTER TABLE operations such as drop / rename/ adding non nullable columns are currently blocked

Here are some example syntaxes to get started with ALTER TABLE functionality.

ALTER TABLE [AdventureWorksSales].[dbo].[Product]

ADD [status] VARCHAR(50); — any supported data types

Learn more here .

Truncate Table in Fabric Datawarehouse, enhancing data management capabilities for the users is now generally available.

Truncate removes all rows from any warehouse user table that the user has permission to update, while preserving the table’s metadata. This command is beneficial for situations that demand quick data removal and table maintenance. It is ideal for scenarios where staging tables need regular data clearing without altering the table’s structure.

Truncate operation is only allowed on a parquet backed Datawarehouse user table.

There are few Limitations such as:

  • Truncating a specific table partition is not allowed in Fabric Datawarehouse
  • Truncation of a Lakehouse table, views, table referenced by materialized views, system tables, system DMVs are also not allowed.

Syntax for truncate table to remove rows from a Parquet-backed user table in Microsoft Fabric Warehouse:

TRUNCATE TABLE { database_name.schema_name.table_name | schema_name.table_name | table_name } [;]

Learn more here

We’ve heard your requests and we’re excited to extend our capabilities with support for mirrored tables within additional SQL’s Dynamic Definition Language (DDL). Now, operations such as Drop Table, Rename Table, and Rename Column can be seamlessly executed while tables are in the process of mirroring.

Click here to watch a demo .

You can use a more intuitive experience with Modern Get Data to connect data source for Mirroring. On the homepage of Data Warehouse experience, click any Mirroring module to get started.

Let’s use the “Mirrored Azure SQL Database” to get started.

logarithmic amplifier experiment

After entering the “Mirrored Azure SQL Database”, you can use the Modern Get Data experience by choosing all the available databases in the OneLake data hub. More details of how to do this, you can take reference on this document Tutorial: Configure Microsoft Fabric mirrored databases from Azure SQL Database (Preview) .

logarithmic amplifier experiment

Beginning in August, the library MsSparkUtils will be rebranded as NotebookUtils. This change reflects our commitment to providing the best tools and utilities for your data processing needs.

While NotebookUtils will be backward compatible with MsSparkUtils, we want to inform you that new features will only be added to the NotebookUtils namespace. Therefore, we strongly recommend that you start replacing the old namespace with the new one in your projects, and the NotebookUtils will be only supported on runtime version 1.2 and above, please note to upgrade your runtime version as well.

The transition to NotebookUtils is a step forward in our journey to enhance your experience and efficiency. We appreciate your cooperation in this change and are here to support you through the transition process. Thank you for your continued support and happy coding!

The Import Notebook feature has recently been enhanced making it more accessible and intuitive. With this update, you can effortlessly import notebooks, reports, or paginated reports using the unified entry in the workspace toolbar. This improvement streamlines the process, ensuring a seamless experience for developers.

logarithmic amplifier experiment

We recently released the Lifecycle of Apache Spark runtimes in Fabric . Our team diligently delivers new versions, ensuring they are of high quality, well-integrated, and supported continuously. Each version includes about 110 components, and as the runtime grows, we make sure it integrates smoothly into Microsoft Fabric and Azure.

We cautiously approach new preview runtime releases, aiming for an experimental preview in roughly 3 months, although the exact timeline varies per case. The latest runtime, Version 1.3 based on Apache Spark 3.5, is currently in Public Preview, and we’re preparing it for General Availability (GA). Runtime 1.2, based on Apache Spark 3.4, is already stable in GA. We have announced the end-of-support date for Runtime 1.1 on Apache Spark 3.3, which will be deprecated and not available after March 31, 2025.

Recently, Michael Kovalsky released a python library called ‘ fabric_cat_tools ‘ for Fabric notebooks. This library includes 120+ additional functions which extend semantic-link’s capabilities ranging from automating the migration of semantic models to Direct Lake , analyzing semantic models via a Best Practice Analyzer , showing Vertipaq Analyzer statistics, wrapping the full Tabular Object Model …and much more. You can even automatically translate your entire semantic model’s metadata into any language in seconds! All of this is self-contained inside of the Fabric ecosystem.

Check out this GIF

Figure 1: Using Semantic Link Labs to analyze semantic models via Vertipaq Analyzer .

We are excited to announce that this library has been renamed to Semantic Link Labs and open-sourced on Microsoft’s official GitHub page. As its name implies, semantic-link-labs is now an official extension of Semantic Link, offering early access to many features not yet available in Semantic Link but having the reassurance of a Microsoft-branded, open-sourced product. All functions within Semantic Link Labs are fully documented here . We are confident Semantic Link Labs will help Power BI developers and admins easily automate previously complicated tasks as well as make semantic model optimization tooling more easily accessible within the Fabric ecosystem. The overwhelmingly positive feedback from this library (in its time as fabric_cat_tools) shows that semantic-link and Semantic Link Labs can offer a great deal to the Power BI community, not just the data science community. We warmly welcome your contributions to our GitHub repository .

Figure 2: Using Semantic Link Labs to analyze semantic models via a Best Practice Analyzer .

Figure 3: Using Semantic Link Labs to automatically translate a semantic model’s metadata .

We have released a new feature that allows users to apply MLflow tags directly on their ML experiment runs and ML model versions from the user interface. This enhancement empowers users to add annotations, track changes, and incorporate additional metadata seamlessly. Whether you are fine-tuning a model or running extensive experiments, tagging will enable you to organize and contextualize your results more effectively.

Moreover, these tags are easily accessible from the run or model version details page, providing a comprehensive overview briefly. Users can also utilize these tags to compare views within the item or inline notebook authoring, making it effortless to compare across multiple runs or model versions. This streamlined tagging capability is designed to enhance your workflow, offering deeper insights and improved management of your machine learning projects.

To learn more about tagging, refer to the product documentation.

We have a new feature for you that is designed to help users track related ML experiment runs within their Spark applications. This feature allows users to monitor the progress of their Spark applications, which can create one or multiple experiments and related experiment runs. By navigating to the Monitoring Hub, users can click on a Spark application and go to item snapshots to find experiments and runs created within that application.

logarithmic amplifier experiment

This enhancement makes it easier to debug Spark applications, especially when they impact specific machine learning workflows. For instance, if a Spark application fails, users can quickly identify which ML training runs were affected, facilitating efficient troubleshooting and resolution. This new capability ensures a smoother and more transparent process for managing and debugging ML workflows within Spark applications.

To learn more about monitoring data science items, refer to the product documentation.

Integrate Experiment items into the Monitoring Hub with this new feature! With this enhancement, users can track experiment runs directly from the Monitoring Hub, providing a unified view of all their activities. This integration includes powerful filtering options, enabling users to focus on experiments or runs created within the last 30 days or other specified periods.

logarithmic amplifier experiment

This feature offers a comprehensive “single pane of glass” experience, giving users a holistic overview of all activities in their workspace. Whether managing multiple projects or tracking specific experiment runs, this integration simplifies the process, making it easier to stay organized and informed. Enhance your workflow with this seamless monitoring capability, designed to provide clarity and efficiency in managing your machine learning experiments.

To learn more about monitoring data science items, refer to the product documentation .

We’re releasing an update to code-first AutoML in Fabric. With this update, we now automatically log the input and output schema for non-Spark models trained using AutoML. This enhancement allows users to seamlessly move from training with AutoML to making predictions by leveraging the built-in Fabric PREDICT UI and code-first APIs for batch predictions. This streamlined process ensures a smooth transition from model training to making accurate and efficient predictions, enhancing overall productivity and ease of use.

To learn more about AutoML in Fabric Data Science, refer to the product documentation .

You can now build your own generative AI experiences over your data in Fabric with the Public Preview of the AI skill ! With this new capability, you can build question and answering AI systems over your Lakehouses and Warehouses. You can configure the AI to respond to questions in the way that works for you and your organization by providing instructions and examples.

Many generative AI experiences are generic; they do not understand all the nuances that come along with your data. These systems can output very reasonable looking answers that are ultimately incorrect. The issue is that this nuance is not expressed in the schema or the data itself. How should the AI count sales across different time zones? Or what should you do if the customer ID is not unique? These kinds of issues arise frequently in real world data systems, and only you have all the context needed to provide these answers.

With the new AI skill experience, domain experts and data professionals now have the power to configure and guide the AI by providing instructions and examples. Your colleagues can then ask their questions and have the AI generate reliable queries for them. The AI skill parses the generated queries before the queries are executed, to ensure they do not alter or delete data. Also, the AI skill uses your credentials to execute the query, which ensures that data governance rules remain adhered to.

For more details on the AI Skill, read the full update here.

The Fabric Real-Time Hub now introduces ‘teaching bubbles’ that provide a step-by-step guide through its major functionalities. These interactive guides allow you to seamlessly navigate each tab of the Real-Time Hub, offering a clear understanding of the value and core functions. By following these teaching bubbles, you can efficiently kick off the GetEvents flow, ensuring a best-in-class streaming data ingestion experience. This feature is designed to enhance your learning curve and maximize the capabilities of the Real-Time Hub.

KQL Queryset is a data analysis tool that enables users to write and execute KQL queries against large datasets. It allows for advanced data exploration, manipulation, and visualization, making it easier to derive insights from structured and semi-structured data.

The new Fabric Queryset REST APIs allow you to create/update/delete KQL Querysets in Fabric, and programmatically manage them without manual intervention.

Read more here .

Dataflow Gen2

Below are the new and updated connectors in this release:

  • Delta Sharing
  • SiteImprove
  • LinkedIn Learning
  • Wolters Kluwer CCH Targetik
  • SolarWinds Service Desk
  • Emplifi Metrics
  • Socialbakers Metrics

Are you interested in creating your own connector and publishing it for your customers? Learn more about the Power Query SDK and the Connector Certification program .

Data pipeline

We are excited to announce the release of two powerful new connectors in Fabric Data Factory data pipeline:

  • Salesforce Connector
  • Vertica Connector

The Salesforce connector using Bulk API 2.0 in Fabric Data Factory offers a high-performance solution for integrating Salesforce data with Microsoft Fabric. Bulk API 2.0 is designed to handle large volumes of data efficiently by processing batches of records asynchronously, making it ideal for large-scale data migrations and synchronizations. This connector enables users to seamlessly extract, transform, and load extensive datasets from Salesforce into various destinations or vice versa.

By utilizing this connector, organizations can accelerate data operations, streamline workflows, and leverage the full potential of their Salesforce data alongside other data sources, ensuring robust and scalable data integration and analytics.

The Vertica connector offers unparalleled ease of connection to Vertica, a high-performance, distributed SQL database designed for big data analytics through on-premises gateway. By leveraging the Vertica connector, organizations can harness the robust analytical capabilities of Vertica alongside the scalability and flexibility of Fabric Data Factory, thereby enhancing their data workflows and accelerating insights across their enterprise data ecosystem.

Elevate your data integration experience with these new connectors in Fabric Data Factory and unlock the full potential of your data ecosystems.

The introduction of TLS 1.3 support in the Data Warehouse connector marks a significant improvement in data security for data integration processes. TLS 1.3, the latest version of the Transport Layer Security protocol, provides improved encryption, reduced latency, and enhanced privacy over previous versions. By supporting TLS 1.3, the Data Warehouse connector ensures that data transmitted between the data warehouse and other systems is protected with state-of-the-art encryption, mitigating the risk of cyber threats and data breaches.

This update not only strengthens the security posture of data operations but also optimizes performance, enabling faster and more secure data transfers. Organizations can now confidently leverage the Data Warehouse connector in data pipeline to integrate and analyze their data, knowing that their information is safeguarded with the most advanced security protocols available.

You can easily browse and connect to your Azure resources automatically with the modern data experience of Data Pipeline. With the Browse Azure experience, you can quickly connect to Azure resources without manual filling in some information, such as endpoint, URL, etc.

Currently we have supported connecting Azure Blob, Azure Data Lake Gen 2, Azure Cosmos DB and Synapse through Browse Azure experience. To browse the Azure resources, you need at least a Reader access role on the data source. To be able to connect to the resource with OAuth, you need at least the Storage Blob Data Reader role on the data source. For more information on access roles.

Let’s get started with the Geta Data experience in Fabric Pipeline. After you navigate to the Azure module, you will land into browse Azure module.

logarithmic amplifier experiment

In the browsing Azure module, you can select subscription, resource group and resource types to filter on the resources that you want. In this example, my account is Azure Blob storage, so I will connect the resource with the Azure Blobs storage type.

logarithmic amplifier experiment

After connecting to Azure Blob storage, you can easily select the file to preview data.

logarithmic amplifier experiment

You can also use a similar easy way to connect with other supported Azure resources. Learn more here .

Get certified on Fabric!

We’d like to thank the thousands of you who completed the  Fabric AI  and  30 Days to Learn It Skills Challenge  and earned a discount voucher for  Exam DP-600  which leads to the  Fabric Analytics Engineer Associate  certification.

If you earned a discount voucher, you can find redemption instructions in your email. We recommend that you  schedule your exam  promptly, before your  discount voucher expires. 

If you need a little more help with exam prep, visit the  Fabric Career Hub  which has expert-led training, exam crams, practice tests and more.

Fabric Sticker Challenge Winners Announced!

The Fabric Community Sticker Challenge launched August 1-23 and winners are in! All Fabric Community members were invited to create unique stickers showcasing their enthusiasm and creativity under the following categories: Community Enthusiasm, Inspirational, “Inside Joke” for developers and data, and Super Users. To see winning designs, check out our Community News . Thank you all who participated in this challenge; it was great to see so much involvement!

Fabric Influencers Spotlight

Check out our latest initiative, the  Fabric Influencers Spotlight .   Each month, we’ll be highlighting some of the great blog, videos presentations and other contributions submitted by members of Microsoft MVP & Fabric Super User communities that cover the Fabric Platform, Data Engineering & Data Science in Fabric, Data Warehousing, Power BI, Real-Time Intelligence, Data Integration, Fabric Administration & Governance, Databases and Learning. 

Related blog posts

Fabric community sticker challenge 2024.

Hey Community Members! Are you a sticker enthusiast, do you enjoy adding stickers to your laptop?  We invite all Fabric Community members to participate in the Fabric Community Sticker Challenge through August 28th. Your creative submissions will be voted on by the community to determine the best of the best!  The challenge winners will have their … Continue reading “Fabric Community Sticker Challenge 2024”

Introducing AI Skills in Microsoft Fabric: Now in Public Preview

Additional authors: Alex van Grootel At Build, we announced AI skills – a new capability in Fabric that allows you to build your own generative AI experiences. We believe that generative AI enables a fundamentally new way for you to interact with your data, dramatically increasing the amount of data-driven decision-making in organizations across the … Continue reading “Introducing AI Skills in Microsoft Fabric: Now in Public Preview”

  • To perform the live experiment on the lab, the student needs to login, or create a login id (if new).
  • After logging on, the student should select any one option from list of labs a) Slot System b) One Shot system
  • To perform the experiment on Slot System , student has to book their slot time. Student should click on Slot Booking
  • As student will click on Slot Booking , a new window will appear which has all slot timing. Student can select only one slot in a single day.
  • After selection of slot, you should click on Submit button .
  • As you will click on Submit button , an acknowledgment pop up window will open to give the information that slot has been selected, click on OK button.
  • Now student has to click on Home button.
  • Now click on Slot System.
  • Now select the experiment Logarithmic Amplifier from the experiment list.
  • After selecting the experiment you will see the schematic and breadboard circuit diagram. The bread board circuit diagram is an example how to connect components on board. Student can connect the components by drag and drop process. Before starting, you should click on Lock button, by doing this your slot time will be locked which means only you have access to the hardware at that time.
  • Now start to connect the components on Breadboard by drag and drop process.
  • Now connect the components by wires, there are four different colors of wires available. Red, Green, Blue and Black.
  • When the process of connecting the components is complete, then student should check that all the components are in proper manner, if the any of the components are not in proper manner then delete the respective components and reconnect the circuit. If you want to delete any wire, click on that wire, the color of wire will change to yellow color; now delete it by clicking on Delete button.
  • After implementation of components on bread board, student must have connect function generator for providing Input signal, Power Supply for providing power to circuit, these are on left side of bread board. Three different channels are available for seeing the output at right side of the bread board. The green wires are of the ground connection.
  • Now student must have switch ON power supply for providing DC supply to the circuit.
  • When all the components are connected properly, student should click on FG (Function Generator), After clicking on FG , a new window of function Generator will be appear, The all value like as amplitude, frequency, wave (sine, square, ramp, etc.) and DC offset should be proper and with its unit, after that click on Update Display.
  • Now click on Run button to see the output.
  • As you’ll click on run button, two waveforms of different colors will appear in CRO, the yellow color waveform shows the output and red color waveform indicates the value of Input.
  • You can see result in separate window after clicking on CRO.

Scientists testing deadly heat limits on humans show thresholds may be much lower than first thought

Topic: Heatwaves

A world-first study challenges our understanding of how humans cope with extreme heat.

Owen Dillon's heart is pounding. Sweat is dripping down his neck, and he's feeling tired and weak.

Inside the climate chamber where he's sitting, it's unbearably hot.

It's been set to 54 degrees Celsius, with 26 per cent humidity — a combination believed to be lethal after six hours.

After just a short period of time, he understands why.

Owen has been put into the climate chamber by Jem Cheng, a research fellow at the Heat and Health Research Centre at the University of Sydney.

It's part of a world-first study all about finding out at what point heat becomes deadly.

Dr Jem Cheng looking questioning at two team members in front of a screen

Fifteen years ago, scientists proposed an environmental threshold at which no person would be able to survive for six hours.

But these conditions have never been tested on humans.

"This study is all about human survivability," Dr Cheng says.

"So we are the first to actually put people in these environments to actually see, physiologically, what is happening to their core temperature or to their heart rate.

"What is happening to a real human when we put them in these environments?"

A sign on a door saying 'climate chamber' with a padlock.

In a warming world, researchers say this question is more important than ever.

Rising CO2 emissions from fossil fuels are driving increases in deadly heat around the world. This summer alone, in the northern hemisphere, thousands have died during extreme heat events.

According to Ollie Jay, a professor of heat and health and the director of the university's Heat and Health Research Centre, there's mounting evidence to show the limit may be lower than first thought.

"We don't want to be sleepwalking into a scenario where we think that these future conditions are going to be survivable when in fact they're not going to be," Professor Jay says.

Owen Dillon is one of the first participants to go through the experiment, having volunteered to be a part of it.

Wider portrait shot of test subject Owen Dillon, smiling

"The simple fact is, more and more people are going to be facing, maybe not quite these conditions, but getting close," he says.

"And it's important that we understand what the limits are and what sort of conditions we should expect people to actually be able to work."

As far as his ability to handle heat, researchers say the 31-year-old should be about as good as it gets.

He's young, healthy and fit — currently running 100 kilometres a week as he trains for the Bondi to Manly ultramarathon.

He's allowed to drink as much water as he likes throughout the experiment.

His body is also prepared to handle the heat, having been put through a week of acclimation sessions before the experiment.

"It's essentially in a best-case scenario," Dr Cheng says.

"When your body is fully acclimatised or acclimated to the environment, how do you perform?"

tight crop of the left half of a man's face, wearing glasses

The conditions Owen is being exposed to over the course of the study are varied.

Some — like today — are very hot and drier, while others have lower temperatures but much higher humidity.

But, except one, they're all equivalent to a wet-bulb temperature of 35C — the critical threshold at which no human can survive for more than six hours, according to the original theory.

So, what is a wet-bulb temperature, and what does it have to do with how humans cope with heat?

It's a measure that combines the two factors that, together, make heat dangerous to people.

Wet bulb temperature axis

Temperature — how hot the air is — and humidity.

The name comes from the temperature a thermometer would read if its bulb was wrapped in a wet cloth — cooling the thermometer the same way sweat cools a person.

logarithmic amplifier experiment

A wet-bulb temperature of 35C means the air temperature is 35C outside and the humidity is 100 per cent.

Explaining wet bulb temperature

But a thermometer wrapped in a wet cloth will show 35C under many different combinations of temperature and humidity.

logarithmic amplifier experiment

That is because lower humidity means more evaporation, bringing the thermometer temperature down.

That's why on days where the air temperature is hotter than 35C outside, you still might be OK, provided the humidity is low enough.

Explaining wet bulb temperature

This is what Owen is experiencing.

Back in the chair, Owen's body is working overtime to cool down.

But the researchers monitoring his vitals can already see it's not enough to stop his core temperature from rising.

Dr Cheng says there are two factors that can hinder the body's ability to cool down.

Dr Jem Cheng looking worried at a screen

One is the environment.

On a very humid day, the air is so full of moisture that the sweat struggles to evaporate.

"You're sweating as much as you can, but the sweat essentially just sits on your body, and that's why you can't cool down," Dr Cheng says.

"That sweat actually needs to be able to evaporate from your body. It's that evaporation that is actually what cools you down."

The other is the limits of the human body itself.

On a very hot, relatively dry day — such as the conditions Owen is currently in — the problem is how much you can sweat in the first place.

"It's sort of the opposite," Dr Cheng says.

"You're producing as much sweat as you can, it's all evaporating, but for you to cool down to the degree that you need to, you need to produce sweat at a rate that is just not possible, even for a heat-acclimated person.

"You max out. Your body physiologically can't produce enough sweat."

Halfway into the three-hour experiment, Owen's core temperature is starting to climb — currently at 38.4C, up from his starting temperature of 37.13C.

From a core temperature of 39C, mild heat exhaustion, such as headaches and faintness, can begin to occur.

At 40C the risk of severe heat exhaustion, including vomiting and disorientation, becomes increasingly likely.

At more than 40.5C, your risk of heat stroke escalates rapidly.

By the time someone's core rises to 43C, a person is all but guaranteed to die.

Wet-bulb temperatures of 35C are rare, even for hot, humid climates, which tend to see higher wet-bulb temperatures.

A 2020 study, published in Science Advances , found there have been a handful of instances, all in the past decade, where places have briefly reached that threshold — in Saudi Arabia and Pakistan.

None have reached those thresholds for sustained periods of time, and climate scientists say it's very unlikely they will during this century.

But history shows it doesn't have to be that hot for deaths to occur.

In Australia, since 1900, extreme heat has caused more deaths than all other natural disasters combined. 

An overhead shot of a large crowd of pilgrims wearing white. There is a mosque building to the left.

During 2023, the hottest year on record, more than 47,000 people in Europe are estimated to have died from heat, according to a study published in Nature.

These deaths occurred in conditions that were lower than the 35C wet-bulb threshold.

Professor Jay says that's why it's important to test the conditions on real people. Working with Arizona State University, his team modified the original model to factor in the way the human body works.

The 2023 study, published in Nature Communications , found the thresholds for when heat turns deadly could be much lower in certain climates than first thought.

Explaining wet bulb temperature

Let's bring back that wet-bulb temperature limit. Remember, anything above 35C is not survivable, according to the original study.

Explaining wet bulb temperature

The new study shows that for healthy, young people, it could be as low as 25.8C.

Explaining wet bulb temperature

And for older people, it could be as low as 21.9C.

The chart highlights how humans struggle to survive at lower wet bulb temperatures when the air temperature is high.

The biggest difference is when the air temperature is extremely high and the humidity is low.

"The 35C wet-bulb temperature model is very compelling and in many cases, it's accurate," Professor Jay says.

"What this new model shows is, when you take into account the limitations of human physiology, these upper wet-bulb temperature limits look as though they are much lower under certain types of conditions."

Those "more true" limits are far more likely to occur in a future climate, according to Australian National University professor of climate science Sarah Perkins Kirkpatrick.

Heatwave in Oklahoma, USA

"I would certainly say by the end of the century, we'd be seeing these conditions somewhat regularly during summer seasons," she says.

A man lies on his back, with no shirt on, on the road side during a heatwave in New York City in June

She says places at risk include cities like London, Beijing, Johannesburg, Los Angeles and New York, located in the mid-latitude belt, as well as Australia.

"So when we're thinking about New South Wales, Victoria, South Australia, and especially those desert regions, those thresholds will ultimately be reached," she says.

"But it'll be the temperature and not the humidity that's driving them.

"It ultimately depends by how much the globe warms. The more global warming we see, the higher likelihood of these deadly events occurring and sooner, as well."

Owen reaches his limit

Owen is meant to stay in the chamber for three hours.

But two hours into the experiment, the researchers can see that won't be the case.

His muscles are cramping. His breathing is laboured.

And his core temperature is nearing the experiment's safety cut-off point of 39C.

At two and a half hours, he's pulled out of the chamber.

It's the first time he's not been able to complete the experiment to the full three hours — providing valuable insight to the researchers.

His core temperature rose faster than during the high humidity sessions, despite the wet-bulb temperature being the same.

"Humid conditions have their own sort of more perceptual limitations, that difficulty breathing, because it feels so claustrophobic," Dr Cheng says.

"But in the dry environment, so far, the rate at which [their core temperature] is rising can be one-and-a-half to two times what we're seeing with the more humid conditions."

Planning for a future climate

The researchers recognise there are limitations to their study. After all, the participants are sitting in one spot for several hours, far from the realities of everyday life.

Professor Jay says in some cases, real life could be easier, and in others, it could be harder.

Air conditioning, for instance, goes a big way to providing an escape from hot conditions when they occur.

But outside, in our cities, factors like physical activity, direct exposure to sun, or heavily built-up environments can all make it worse.

Dr Cheng says understanding these risks is particularly important for vulnerable populations in Australia and elsewhere around the world.

Man sprays water in his face during heatwave May 2023 India

"It's really for a lot of those nations, that don't have a choice but to actually live in these conditions 24/7 … or for people in circumstances where air conditioning is not an option, or areas of the world where manual labour in the field is just sort of their way of life," Dr Cheng says.

"A lot of those parts of the world that are most affected by it, are also the ones that have the least resources, I think, to deal with it."

Professor Jay says allowing temperatures to continue to rise will have global consequences.

"First of all, we might be purely dependent on infrastructure to keep us cool and safe, so we would need a lot of air conditioning," he says.

"The only other way is that people are going to start moving, [either] within-country migration or even, in extreme cases, international migration.

"The downstream impacts of those types of consequences, of mass migration, on resources, employments, all these different types of considerations, could have real profound impacts and serve as a bit of a catalyst for future conflict as well."

The researchers will keep testing the conditions on people until the end of the year.

But in the meantime, it's given both the researchers, and Owen, an important glimpse into where the heat threshold of the human body lies.

"It's harder than I thought it was going to be," Owen says.

"I would say the first time running 80km felt pretty similar to doing 90 minutes in that hot room.

"It's definitely made me a lot more aware of the balance between temperature and humidity, and also a lot more aware of how that's going to impact your ability to perform.

"Now I can look at a weather forecast and say for sure that I will not go running that day."

Reporter: Tyne Logan

Video/Photography: Kit Mochan , Jack Fisher, Adam Wyatt

Design: Alex Lim

Production: Fran Rimrod

Editor: Tim Leslie

  • X (formerly Twitter)

Related stories

How work, a cricket game and even just sitting at home can be catastrophic during a heatwave.

Topic: Health

Illustration of 45 year old woman struggling to sleep using purple and yellow colour tones.

More than a dozen hajj pilgrims dead amid extreme heat, gruelling rites

Topic: Religion

An overhead shot of a large crowd of pilgrims wearing white. There is a mosque building to the left.

50C heatwaves across the northern hemisphere drive global temps to 1.5 degrees above average

Topic: Climate Change

A man covers his face using a cloth to shield himself from the sun as he inspects railway tracks

Take a look at 2023's record-breaking temperatures in graphs and photos

Topic: Weather

A close up of a cacti dotting a desert underneath a blazing sun.

Related topics

Climate Change

Environment

Environmental Health

Science and Technology

  • Chrome for Developers

Gemini Nano language detection API available for early preview

Kenji Baheux

A language detection API is now available for local experimentation to our early preview program (EPP) participants. With this API, you can determine what language is being used on a web page.

The language detection APIs explainer is available as a proposal for the future development of this exploratory API and other APIs, including a translation API.

Language detection is the first step for translation. Browsers often already have language detection capabilities, and this API will allow web developers to access this technology with a JavaScript API.

As with our other APIs, we'll take your feedback to update the way language detection works, to ensure it meets the needs of developers and users. We hope to learn about the detection quality of summarization, feedback on the API design, and the impact of the current implementation in Chrome Canary.

Once you've signed up and been accepted to the EPP, you'll have access to a demo so you can experiment with this API.

Join the early preview program

As of now, the Prompt API, summarization API, and the language detection API are available for prototyping .

Sign up for the early preview program to gain access to the documentation and demos, stay up-to-date with the latest changes, and discover new APIs.

Except as otherwise noted, the content of this page is licensed under the Creative Commons Attribution 4.0 License , and code samples are licensed under the Apache 2.0 License . For details, see the Google Developers Site Policies . Java is a registered trademark of Oracle and/or its affiliates.

Last updated 2024-08-27 UTC.

IMAGES

  1. Fig: Logarithmic Amplifier Using Matched Transistors

    logarithmic amplifier experiment

  2. Log amplifier using op-amp

    logarithmic amplifier experiment

  3. logarithmic amplifier experiment part-2|

    logarithmic amplifier experiment

  4. Solved Logarithmic Amplifier: The circuit shown below is

    logarithmic amplifier experiment

  5. (a) Logarithmic amplifier circuit with offset cancellation feedback

    logarithmic amplifier experiment

  6. Logarithmic Amplifier Using Diode

    logarithmic amplifier experiment

VIDEO

  1. Logarithmic Amplifier(Tamil)

  2. logarithmic amplifier experiment part-2|

  3. Logarithmic Amplifier

  4. Writing Exponential Equations in Logarithmic Form

  5. LEC 187: LOGARITHMIC AMPLIFIER USING OP-AMP. NET & SET PAPER-II, UNIT-IV,ELECTRONICS SCIENCE

  6. Simulation-Logarithmic Amplifier using IC741| Multisim

COMMENTS

  1. 7.6: Log and Anti-Log Amplifiers

    A basic anti-log amplifier is shown in Figure 7.6.3. Note that the transistor is used to turn the input voltage into an input current, with a log function. This current then feeds Rf, which produces the output voltage. The derivation of the input/output Equation is similar to the log circuit's: Vout = −RfIc.

  2. PDF AN-311Theory and Applications of Logarithmic Amplifiers

    1 Theory and Applications of Logarithmic Amplifiers. The theory and construction of these circuits are actually readily understood. Figure 1 shows an amplifier that provides a logarithmic output for a linear input current or voltage. For input currents, the circuit will maintain 1% logarithmic conformity over almost six decades of operation.

  3. Log amplifier

    A log amplifier, also known as logarithmic amplifier or logarithm amplifier or log amp, is an amplifier for which the output voltage V out is K times the natural log of the input voltage V in.This can be expressed as, = ⁡ where V ref is the normalization constant in volts and K is the scale factor.. The log amplifier gives an output voltage which is proportional to the logarithm of the ...

  4. Log Amplifier using Op Amp Experiment

    About this Video:-Dive into the world of logarithmic amplifiers with our latest YouTube video! 🚀 In this comprehensive tutorial, we demonstrate the simulati...

  5. PDF Experiment 10 Operational Amplifier Circuits

    in process control. When used with a diode, an op amp can perform non-linear mathematical operations like logarithmic or exponential amplification. For this section of the experiment, please note that it is possible to burn out the op-amp by applying a voltage to the op amp inputs that exceeds the supply voltages, V S= ±15V.

  6. Log amplifier circuit . Opamp transistor log amplifier. opamp diode log

    Log amplifier is a linear circuit in which the output voltage will be a constant times the natural logarithm of the input. The basic output equation of a log amplifier is v Vout = K ln (Vin/Vref); where Vref is the constant of normalisation, and K is the scale factor. Log amplifier finds a lot of application in electronic fields like ...

  7. Log And Anti Log Amplifiers

    Anti-Logarithmic Amplifier. An anti-logarithmic amplifier, or an anti-log amplifier, is an electronic circuit that produces an output that is proportional to the anti-logarithm of the applied input. This section discusses about the op-amp based anti-logarithmic amplifier in detail. An op-amp based anti-logarithmic amplifier produces a voltage ...

  8. Logarithmic Amplifier using Diode and Transistor

    April 10, 2018 Engineeering Projects. Logarithmic Amplifier using Diode and Transistor. It produces output that is proportional to the logarithmic input. It is a non-linear amplifier used for amplification or compression of a wide range of input signals for better resolution. It can be used direct DB display on a spectrum analyzer.

  9. ECD Lab 09

    ECD Lab 09_Log and Antilog Amps - Free download as PDF File (.pdf), Text File (.txt) or read online for free. This document describes an experiment on logarithmic and anti-logarithmic amplifier circuits. The objectives are to understand the operation of a logarithmic amplifier and an anti-logarithmic amplifier. It provides schematic diagrams and components used.

  10. Log Amplifier Circuit Applications

    Log amplifier or logarithmic amplifier is an electronic circuit that produces output that is proportional to the logarithm of the applied input. Basically it performs mathematical operation of a logarithm. In this article, we will see the different log amplifier circuits, its working and log amplifier applications. Basically two circuits are there to perform the ... <a title="Log Amplifier ...

  11. Frequency Response Analysis of Amplifiers and Filters

    In Electronics, the Logarithm, or "log" for short is defined as the power to which the base number must be raised to get that number. Then on a Bode plot, the logarithmic x-axis scale is graduated in log 10 divisions, so every decade of frequency (e.g, 0.01, 0.1, 1, 10, 100, 1000, etc.) is equally spaced onto the x-axis. The opposite of the ...

  12. Logarithmic Amplifier

    To design and study a Logarithmic Amplifier using Op-amp 741. Introduction. Log amplifier is a linear circuit in which the output voltage will be a constant times the natural logarithm of the input. The basic output equation of a log amplifier is v V out = K ln ( V in / V ref); where V ref is the constant of normalization and K is the scale ...

  13. Study Of Logarithmic And Anti-Logarithmic Amplifier

    The setup of a Logarithmic and Anti-Logarithmic Amplifier Training Board typically involves the following steps: 1. Unpacking the Board: Carefully unpack the board and make sure all components are present and in good condition. 2. Assembly: Assemble the board's components as per the instructions provided in the manual.

  14. Logarithmic Amplifier

    Live Experiment; Questionnair; Video Tutorial; Logarithmic Amplifier Theory. The schematic of a simple Op-amp-diode log amplifier is shown below. This is nothing but an op-amp wired in closed loop inverting configuration with a diode in the feedback path. The voltage across the diode will be always proportional to the log of the current through ...

  15. PDF CIRCUITS LABORATORY EXPERIMENT 9 Operational Amplifiers

    An operational amplifier ("op amp") is a direct-coupled, differential-input, high-. gain voltage amplifier, usually packaged in the form of a small integrated circuit. The. term "operational" dates back to the early days of analog computers when these devices. were employed in circuits that performed mathematical operations such as addition ...

  16. Logarithmic Amplifier

    Logarithmic Amplifier Calculations & Observations Fig.1 Logarithmic Amplifier circuit. The relationship between the input voltage V in and the output voltage V out is given by: Where I S and V T are the saturation current and the thermal voltage of the diode respectively.. Fig.2 Shows Input Signal (Red) and Output Signal (Yellow)

  17. PDF Study of Logarithmic Amplifier Experiment Apparatus PDF

    for Antilog Amplifier. Features : Instrument comprises of DC Regulated short circuit and over-load protected continuously variable Power Supply, ±15 VDC Regulated Power Supply, one Potentiometer, IC 741 and Diode 4007/IN 34. Catalog No. Particulars JE21150 Study of Logarithmic Amplifier Experiment Apparatus

  18. Experiment No. -1 Aim: To Plot the Frequency Response of a single

    The two power levels of input and output of an amplifier are compared on a logarithmic scale rather than linear scale. The number of bels by which the output power P2 exceeds the input power P1 is defined as Because of dB scale the gain can be directly added when a number of stages are cascaded. ... Page 10 of 26 Experiment No. -4 Aim: To study ...

  19. Study of Logarithmic Amplifier Experiment Apparatus

    Objective: To study the Log. Antilog and ideality factor for Log Amplifier and plot a graph for Antilog Amplifier. Features : Instrument comprises of DC Regulated short circuit and over-load protected continuously variable Power Supply, ±15 VDC Regulated Power Supply, one Potentiometer, IC 741 and Diode 4007/IN 34.

  20. log amplifier using op amp experiment

    Log amplifier. Log amplifier.. Log amplifier is a linear circuit in which the output voltage will be a constant times the natural logarithm of the input. The basic output equation

  21. Officials probe death of Wells Fargo employee found in her cubicle 4

    Denise Prudhomme, 60, was found dead on Aug. 20 in her Arizona office. Police say the preliminary investigation shows no signs of foul play.

  22. Microsoft Fabric August 2024 Update

    Track related ML Experiment runs in your Spark Application. We have a new feature for you that is designed to help users track related ML experiment runs within their Spark applications. This feature allows users to monitor the progress of their Spark applications, which can create one or multiple experiments and related experiment runs.

  23. Logarithmic Amplifier for Ultrasonic Sensor Signal Conditioning

    1.1 Principle Operation of the Log Amp. The logarithmic amplifier calculates the log function of the envelope of an input signal. As the amplitude of the envelope increases linearly, the output of the log amplifier yields the log function of the input. The logarithmic scale is used to quantify relative changes to the input, rather than the ...

  24. Mark Zuckerberg says Meta was 'pressured' by Biden ...

    Mark Zuckerberg, chairman and CEO of the social media company Meta, said in a letter to the House Judiciary committee on Monday that his teams were "pressured" by the Biden White House to ...

  25. US Army rebukes Trump campaign for incident at Arlington National

    The US Army issued a stark rebuke of former President Donald Trump's presidential campaign over the incident on Monday at Arlington National Cemetery, saying in a statement on Thursday that ...

  26. Logarithmic Amplifier

    Now select the experiment Logarithmic Amplifier from the experiment list. After selecting the experiment you will see the schematic and breadboard circuit diagram. The bread board circuit diagram is an example how to connect components on board. Student can connect the components by drag and drop process.

  27. Microsoft Fabric August 2024 Update

    Track related ML Experiment runs in your Spark Application. We have a new feature for you that is designed to help users track related ML experiment runs within their Spark applications. This feature allows users to monitor the progress of their Spark applications, which can create one or multiple experiments and related experiment runs.

  28. Scientists testing deadly heat limits on humans show thresholds may be

    Heatwaves loom as a growing threat to humanity in a warming climate. This summer alone, in the northern hemisphere, thousands have died during extreme heat events. It's driving researchers to find ...

  29. Gemini Nano language detection API available for early preview

    Once you've signed up and been accepted to the EPP, you'll have access to a demo so you can experiment with this API. Join the early preview program. As of now, the Prompt API, summarization API, and the language detection API are available for prototyping.

  30. PDF Comparing gas composition from fast pyrolysis of live foliage measured

    Log-ratio balances of the measured gases common to both environments (CO, CO 2, CH 4, H 2, C 6H 6O (phenol), and other gases) were examined by principal components analysis (PCA), canonical discriminant analysis (CDA) and permu- ... experiments (Safdari 2018), the composition of the gas samples was determined off-line. Foliage from 15 different ...