popular searches
- Request Info

Suggested Ways to Introduce Quotations
When you quote another writer's words, it's best to introduce or contextualize the quote.
How To Quote In An Essay?
To introduce a quote in an essay , don't forget to include author's last name and page number (MLA) or author, date, and page number (APA) in your citation. Shown below are some possible ways to introduce quotations. The examples use MLA format.
Use A Full Sentence Followed by A Colon To Introduce A Quotation
- The setting emphasizes deception: "Nothing is as it appears" (Smith 1).
- Piercy ends the poem on an ironic note: "To every woman a happy ending" (25).
Begin A Sentence with Your Own Words, Then Complete It with Quoted Words
Note that in the second example below, a slash with a space on either side ( / ) marks a line break in the original poem.
- Hamlet's task is to avenge a "foul and most unnatural murder" (Shakespeare 925).
- The speaker is mystified by her sleeping baby, whose "moth-breath / flickers among the flat pink roses" (Plath 17).
Use An Introductory Phrase Naming The Source, Followed By A Comma to Quote A Critic or Researcher
Note that the first letter after the quotation marks should be upper case. According to MLA guidelines, if you change the case of a letter from the original, you must indicate this with brackets. APA format doesn't require brackets.
- According to Smith, "[W]riting is fun" (215).
- In Smith's words, " . . .
- In Smith's view, " . . .
Use A Descriptive Verb, Followed by A Comma To Introduce A Critic's Words
Avoid using says unless the words were originally spoken aloud, for instance, during an interview.
- Smith states, "This book is terrific" (102).
- Smith remarks, " . . .
- Smith writes, " . . .
- Smith notes, " . . .
- Smith comments, " . . .
- Smith observes, " . . .
- Smith concludes, " . . .
- Smith reports, " . . .
- Smith maintains, " . . .
- Smith adds, " . . .
Don't Follow It with A Comma If Your Lead into The Quotation Ends in That or As
The first letter of the quotation should be lower case.
- Smith points out that "millions of students would like to burn this book" (53).
- Smith emphasizes that " . . .
- Smith interprets the hand washing in MacBeth as "an attempt at absolution" (106).
- Smith describes the novel as "a celebration of human experience" (233).
Other Writing Resources
Enhance your academic writing skills by exploring our additional writing resources that will help you craft compelling essays, research papers, and more.

Your New Chapter Starts Wherever You Are
The support you need and education you deserve, no matter where life leads.
because a future built by you is a future built for you.
Too many people have been made to feel that higher education isn’t a place for them— that it is someone else’s dream. But we change all that. With individualized attention and ongoing support, we help you write a new story for the future where you play the starring role.
- Generating Ideas
- Drafting and Revision
- Sources and Evidence
- Style and Grammar
- Specific to Creative Arts
- Specific to Humanities
- Specific to Sciences
- Specific to Social Sciences
- CVs, Résumés and Cover Letters
- Graduate School Applications
- Other Resources
- Hiatt Career Center
- University Writing Center
- Classroom Materials
- Course and Assignment Design
- UWP Instructor Resources
- Writing Intensive Requirement
- Criteria and Learning Goals
- Course Application for Instructors
- What to Know about UWS
- Teaching Resources for WI
- FAQ for Instructors
- FAQ for Students
- Journals on Writing Research and Pedagogy
- University Writing Program
- Degree Programs
- Graduate Programs
- Brandeis Online
- Summer Programs
- Undergraduate Admissions
- Graduate Admissions
- Financial Aid
- Summer School
- Centers and Institutes
- Funding Resources
- Housing/Community Living
- Clubs and Organizations
- Community Service
- Brandeis Arts Engagement
- Rose Art Museum
- Our Jewish Roots
- Mission and Diversity Statements
- Administration
- Faculty & Staff
- Alumni & Friends
- Parents & Families
- Campus Calendar
- Directories
- New Students
- Shuttle Schedules
- Support at Brandeis
Writing Resources
Phrases for introducing sources and quotations.
This handout is available for download in DOCX format and PDF format .
Capturing Authorial Action through Summaries or Paraphrasing
These phrases alert your reader that you as a writer are about to summarize or paraphrase another idea established by an authority on a chosen topic. Note that while some of these are quite neutral, others allow you to imply things about the quote’s tone, similarity, contrast, and/or significance in relation to other sources or to your larger argument.
Author X…
- acknowledges that [blank].
- agrees that [blank].
- argues that [blank].
- believes that [blank].
- celebrates the fact that [blank].
- claims that [blank].
- complains that [blank].
- concedes that [blank].
- demonstrates that [blank].
- deplores the tendency to [blank].
- denies/does not deny that [blank].
- emphasizes that [blank].
- insists that [blank].
- maintains that [blank].
- observes that [blank].
- opines that [blank].
- questions whether [blank].
- refutes the claim that [blank].
- reminds us that [blank].
- reports that [blank].
- suggests that [blank].
- urges us to [blank].
Introducing Quotations
These phrases alert your reader that you are about to quote directly from another source. As with the phrases above, some are quite neutral, while others allow you to imply things about the quote’s tone, similarity, contrast, and/or significance in relation to other sources or to your larger argument.
- X states, “ [blank] .”
- As X puts it, “ [blank] .”
- According to X, “ [blank] .”
- X writes, “ [blank] .”
- In her book/essay [blank] , X maintains that “ [blank] .”
- Writing in the journal [blank] , X complains that “ [blank] .”
- In X's view, “ [blank] .”
- X agrees when she writes, “ [blank] .”
- X disagrees when he writes, “ [blank] .”
- X complicates matters further when they write, “ [blank] .”
Explaining Quotations
Remember that every paragraph must provide clarification, interpretation, or necessary analysis of a supplied quotation or paraphrase; this allows you to explain not only the quote itself, but how it fits into your larger argument. The phrases listed here are just some of the ways in which you can alert your reader that you are about to rephrase, clarify, expand, and otherwise analyze the source you have previously introduced.
- Basically/Essentially, X is saying [blank] .
- In other words, X believes [blank] .
- In making this comment, X urges us to [blank] .
- X is corroborating the idea that [blank] .
- X's point is that [blank] .
- The core/gist/meaning/significance of X' s argument is that [blank] .
And of course, remember that all outside sources must be cited correctly! For more information on how to effectively and accurately incorporate outside sources into your writing, please refer to the handout on “Working with Quotations.”
Adapted from Gerald Graff and Cathy Birkenstein, They Say/I Say: The Moves that Matter in Academic Writing (New York: W.W. Norton, 2014) and David Glen Smith (http://www.davidglensmith.com/Tomball/supplemental/signal-phrases.pdf) by Robert B. Cochran, Brandeis University Writing Program, 2020.
- Resources for Students
- Writing Intensive Instructor Resources
- Research and Pedagogy
Writing Studio
Who said what introducing and contextualizing quotations.
In an effort to make our handouts more accessible, we have begun converting our PDF handouts to web pages. Download this page as a PDF: Introducing and Contextualizing Quotations Return to Writing Studio Handouts
Quotations (as well as paraphrases and summaries) play an essential role in academic writing, from literary analyses to scientific research papers; they are part of a writer’s ever-important evidence, or support, for his or her argument.
But oftentimes, writers aren’t sure how to incorporate quotes and thus shove them into paragraphs without much attention to logic or style.
For better quotations (and better writing), try these tips.
Identify Clearly Where the Borrowed Material Begins
The quotation should include a signal phrase, or introductory statement, which tells the reader whom or what you are citing. The phrase may indicate the author’s name or credentials, the title of the source, and/or helpful background information.
Sample signal phrases
- According to (author/article)
- Author + verb
Some key verbs for signal phrases
- says, writes, accepts, criticizes, describes, disagrees, discusses, explains, identifies, insists, offers, points out, suggests, warns
Two Signal Phrase Examples
- According to scholar Mary Poovey, Shelley’s narrative structure, which allows the creature to speak from a first-person point of view, forces the reader “to identify with [the creature’s] anguish and frustration” (259).
- In an introduction to Frankenstein in 1831, the author Mary Shelley describes even her own creative act with a sense of horror: “The idea so possessed my mind, that a thrill of fear ran through me, and I wished to exchange that ghastly image of my fancy for the realities around” (172).
Create Context for the Material
Don’t just plop in quotes and expect the reader to understand. Explain, expand, or refute the quote. Remember, quotations should be used to support your ideas and points.
Here’s one simple, useful pattern: Introduce quote, give quote, explain quote.
“Introduce, Give, Explain” Example 1
[Introduce] Dorianne Laux’s “Girl in the Doorway” uses many metaphors to evoke a sense of change between the mother and daughter: [Give] “I stand at the dryer, listening/through the thin wall between us, her voice/rising and falling as she describes her new life” (3-5). [Explain] The “thin wall” is literal but also references their communication barrier; “rising and falling” is the sound of the girl’s voice but also a reference to her tumultuous preteen emotions.
“Introduce, Give, Explain” Example 2 (longer block quotation)
[Introduce] After watching the cottagers with pleasure, Frankenstein’s creature has a startling moment of revelation and horror when he sees his own reflection for the first time:
[Give] I had admired the perfect forms of my cottagers — their grace, beauty, and delicate complexions: but how was I terrified, when I viewed myself in a transparent pool! At first I started back, unable to believe that it was indeed I who was reflected in the mirror; and when I became fully convinced that I was in reality the monster that I am, I was filled with the bitterest sensations of despondence and mortification. Alas! I did not yet entirely know the fatal effects of this miserable deformity. (76)
[Explain] This literal moment of reflection is key in the creature’s growing reflection of self: In comparing himself with humans, he sees himself not just as different but as “the monster that I am.”
Additional Advice
Pay attention to proper format and grammar (See VU Writing Studio handout Quotation Basics: Grammar, Punctuation, and Style ), and always, always credit your source in order to avoid plagiarism.
Citation styles (e.g. MLA, APA, or Chicago) vary by discipline. Ask your professor if you are uncertain, and then check style guides for formats. (The above examples use MLA format.)
Last revised: 06/2008 | Adapted for web delivery: 06/2021
In order to access certain content on this page, you may need to download Adobe Acrobat Reader or an equivalent PDF viewer software.
- Link to facebook
- Link to linkedin
- Link to twitter
- Link to youtube
- Writing Tips
How to Introduce Quotes in Academic Writing
- 3-minute read
- 17th October 2019
It would be hard to write a good essay without quoting sources. And as well as using quote marks , this means working quotations into your own writing. But how can you do this? In this post, we provide a few helpful tips on how to introduce quotes (short and long) in academic writing.
Introducing Short Quotations
The easiest way to quote a source is to work a short passage (sometimes just a single word) into your own sentence. For example:
The tomb was one of archaeology’s “most intriguing discoveries” (Andronicus, 1978, p. 55) and has fascinated researchers ever since.
Here, the only requirements placing the quoted text within quotation marks and making sure the quote follows grammatically from the surrounding text.
Quoting After a Colon
If you need to quote a source after a full sentence, introduce it with a colon:
On the basis of Philip II’s estimated date of death, Andronicus (1978) draws a conclusion : “This, in all probability, must be his tomb” (p. 76).
When using a colon to introduce a quotation, the text before the colon must be a full sentence. The text after the colon, however, can be just a few words.
Quoting After a Comma
Alternatively, you can use a comma to introduce a quote. When doing this, the quoted text should follow from the preceding sentence (usually after a word like “says” or “argues”):
Andronicus (1978) says , “The weapons bore witness that the tomb could not have belonged to a commoner” (p. 73).
Find this useful?
Subscribe to our newsletter and get writing tips from our editors straight to your inbox.
However, when a quote follows the word “that,” no comma is needed:
Andronicus (1978) says that “The weapons bore witness that the tomb could not have belonged to a commoner” (p. 73).
Block Quotes
Finally, for longer quotations, use a block quote . These are also introduced with a colon, but they don’t have to follow a full sentence. Furthermore, quoted text should be indented and the block quote should begin on a new line. For example, we could introduce a block quote as follows:
Andronicus (1978) describes the fresco in the following terms:
The barely visible painting depicts three hunters with spears and five horsemen with dogs pursuing their prey, wild boars and lions. This and three other paintings discovered in the adjacent tomb are among the few extant examples of fourth-century BC Greek frescoes. (p. 72)
This emphasizes how important the discovery was for understanding…
Usually, you’ll only need block quotes for passages with more than 40 words (or four lines). The exact rules depend on the reference system you’re using, though, so be sure to check your style guide. And, when in doubt, you can always submit a document for proofreading . We can help make sure your quotations are fully integrated into the rest of your text.
Share this article:
Post A New Comment
Got content that needs a quick turnaround? Let us polish your work. Explore our editorial business services.
5-minute read
Free Email Newsletter Template
Promoting a brand means sharing valuable insights to connect more deeply with your audience, and...
6-minute read
How to Write a Nonprofit Grant Proposal
If you’re seeking funding to support your charitable endeavors as a nonprofit organization, you’ll need...
9-minute read
How to Use Infographics to Boost Your Presentation
Is your content getting noticed? Capturing and maintaining an audience’s attention is a challenge when...
8-minute read
Why Interactive PDFs Are Better for Engagement
Are you looking to enhance engagement and captivate your audience through your professional documents? Interactive...
7-minute read
Seven Key Strategies for Voice Search Optimization
Voice search optimization is rapidly shaping the digital landscape, requiring content professionals to adapt their...
4-minute read
Five Creative Ways to Showcase Your Digital Portfolio
Are you a creative freelancer looking to make a lasting impression on potential clients or...
Make sure your writing is the best it can be with our expert English proofreading and editing.
Get creative with full-sentence rewrites
Polish your papers with one click, avoid unintentional plagiarism.
- Academic Writing
How to Write a Research Paper Introduction in 4 Steps
Published on July 2, 2024 by Hannah Skaggs . Revised on September 11, 2024.
Having a hard time learning how to write a research paper introduction? Follow these four steps:
- Draw readers in.
- Zoom in on your topic and its importance.
- Explain how you’ll add new knowledge.
- Tell readers what they’ll find in your paper.
To understand why a great introduction matters, imagine a friend inviting you to lunch with another friend of hers. You show up at the restaurant and find them waiting for you at the table. You sit down, and her friend says, “So I wanna tell you about my major goal in life.”
Pretty awkward, right? You don’t even know this guy’s name yet, and he’s already diving into the heavy stuff. You’d probably prefer to have your friend introduce him, then spend some time learning about his background and personality before you get into deeper conversation.
Research paper readers need this kind of warmup, too. A good introduction, or intro, lives up to its name—it introduces readers to the topic. It prepares them to care about and understand your research, and it’s more convincing.
Free Grammar Checker
Table of contents
Steps to write a research paper introduction, tips for writing a research paper introduction, tools for writing a research paper introduction, frequently asked questions about how to write a research paper.
By following the steps below, you can learn how to write an introduction for a research paper that helps readers “shake hands” with your topic. In each step, thinking about the answers to key questions can help you reach your readers.
1. Get your readers’ attention
To speak to your readers effectively, you need to know who they are. Consider who is likely to read the paper and the extent of their knowledge on the topic. Then begin your introduction with a sentence or two that will capture their interest.
For instance, you might begin with an interesting quote or an example of a situation that illustrates your argument (as we did above). Or you could start by simply stating a fact that most people aren’t aware of, which may be a better approach in scientific fields. Whichever method you choose, remember that this is academic writing —keep your phrasing formal and don’t sensationalize.
Key questions:
- Who is your audience?
- What will your paper talk about?
- What will grab your audience’s interest in the topic?
2. Explain why your topic matters
Just as you’d like to understand where a new acquaintance is coming from as you get to know them, your readers want to understand the background of your research. Once you’ve got their attention, explain why they should care.
You can give background for your research by discussing previous research on the topic. While this part should be shorter than a literature review , it can explore some of the same kinds of connections and themes. Make sure the sources you cite relate to the argument you’re making or the problem you want to solve. The information you provide here should lay a factual foundation for your research.
- Why should readers care about your topic?
- What do readers need to know to understand your research?
- What have other researchers said about the topic?
- What is the field’s overall view of the topic?
3. Lay out your argument and plan
After showing your reader the existing knowledge on the topic, you can turn to how your paper will contribute new knowledge. Tying your research to previous research is the most important aspect of this step.
Explain what knowledge is missing from the existing research and how you plan to uncover that knowledge. This is the most common place for the thesis statement, which succinctly tells readers the purpose and main idea of your paper (though it could also appear at the end of Step 4).
- How does your research relate to the studies you described in Step 2?
- What question are you aiming to answer , or what problem are you looking to solve?
- What methods will you use to answer that question or solve that problem?
4. Define your direction
Besides introducing your readers to the topic and your related findings or argument, you’re introducing them to your research process and the paper itself. This means you need to help them understand how the paper is organized and where it’s going. Add a sentence, or a few sentences, describing the sections of your paper in order or the main ideas it will cover.
While longer papers typically need to include this step, shorter ones, such as a five-paragraph essay , can usually skip it. In these cases, the thesis statement outlines the paper’s structure.
- What goal will each section of your paper accomplish?
- What should readers take away from your paper?
As you go through the steps above, keep in mind the principles of quality academic writing. Specifically, understanding how to organize and summarize will empower you to complete each step with excellence.
Keep it smooth
A good flow helps readers follow your logic. As you progress from Step 1 to Step 4, the information you give should grow more and more specific. It’s similar to how, when you meet a person, you learn basics like their name and appearance first. Then you learn about their background and more specific details, like their political views.
To make your introduction flow, start with an outline. The outline functions like a skeleton. It provides a structure for the details that make up your introduction like muscles and other tissues. It helps you make sure you don’t miss any important elements. Then, as you flesh out the details, use transition words and phrases between them to show how they relate to each other.
Keep it brief
How long should a research paper introduction be? It depends on the overall length of your paper, but the intro is typically one of the shortest sections. For example, in a short paper like an essay, you can complete each of the steps above in just a sentence or two. But in a longer one, such as a dissertation , each step may take a couple of paragraphs.
In a sense, the intro is a summary of the rest of the paper, and summarizing is all about prioritizing. As business guru Karen Martin said, “When everything is a priority, nothing is a priority.”
Martin was talking about deciding which tasks are more urgent in a business, but the same principle applies to summarizing. You must decide which ideas are the most fundamental and leave the rest out. Think about it: when you’re first meeting someone, they don’t give you an exhaustive list of all their traits. They introduce themselves with just a few of their most prominent ones.
Besides narrowing your focus, another way to keep your introduction short is to write concisely. Plain, direct language helps hold the reader’s attention, but wordy sentences will make them nod off and lose interest.
Since the introduction of a research paper is basically a summary, you may find it helpful to write it last, after you’ve finished the rest of your paper. If you write it first, there’s a good chance you’ll have to change some of its main points later. This can happen because the other sections of your paper, which your intro is based on, may evolve while you’re writing them.
Of course, you should always go back and take a second or even third look at every section of your research paper to check for errors and other necessary changes. But if you write your intro last, editing it is likely to take much less time.
Now that we’ve introduced you to the basics of writing a research paper introduction, we’d like to introduce you to QuillBot. At every step of writing your intro, it can help you upgrade your writing skills:
- Cite sources using the Citation Generator .
- Avoid plagiarism using the Plagiarism Checker .
- Reword statements from previous research (but still cite them) using the Paraphraser .
- Write spectacular and concise thesis statements (or even your whole introduction section!) using the Summarizer .
A research paper introduction starts by acquainting readers with the topic generally. Then it explores the background of the research. Finally, it explains the specific purpose of the research and its contribution.
Quotes , anecdotes, and interesting facts are all effective hooks to begin the introduction of a research paper. Which one you choose depends on the subject of your paper and your field of study.
Is this article helpful?

Hannah Skaggs
Instant insights, infinite possibilities
How to write an effective introduction for your research paper
Last updated
20 January 2024
Reviewed by
However, the introduction is a vital element of your research paper . It helps the reader decide whether your paper is worth their time. As such, it's worth taking your time to get it right.
In this article, we'll tell you everything you need to know about writing an effective introduction for your research paper.
- The importance of an introduction in research papers
The primary purpose of an introduction is to provide an overview of your paper. This lets readers gauge whether they want to continue reading or not. The introduction should provide a meaningful roadmap of your research to help them make this decision. It should let readers know whether the information they're interested in is likely to be found in the pages that follow.
Aside from providing readers with information about the content of your paper, the introduction also sets the tone. It shows readers the style of language they can expect, which can further help them to decide how far to read.
When you take into account both of these roles that an introduction plays, it becomes clear that crafting an engaging introduction is the best way to get your paper read more widely. First impressions count, and the introduction provides that impression to readers.
- The optimum length for a research paper introduction
While there's no magic formula to determine exactly how long a research paper introduction should be, there are a few guidelines. Some variables that impact the ideal introduction length include:
Field of study
Complexity of the topic
Specific requirements of the course or publication
A commonly recommended length of a research paper introduction is around 10% of the total paper’s length. So, a ten-page paper has a one-page introduction. If the topic is complex, it may require more background to craft a compelling intro. Humanities papers tend to have longer introductions than those of the hard sciences.
The best way to craft an introduction of the right length is to focus on clarity and conciseness. Tell the reader only what is necessary to set up your research. An introduction edited down with this goal in mind should end up at an acceptable length.
- Evaluating successful research paper introductions
A good way to gauge how to create a great introduction is by looking at examples from across your field. The most influential and well-regarded papers should provide some insights into what makes a good introduction.
Dissecting examples: what works and why
We can make some general assumptions by looking at common elements of a good introduction, regardless of the field of research.
A common structure is to start with a broad context, and then narrow that down to specific research questions or hypotheses. This creates a funnel that establishes the scope and relevance.
The most effective introductions are careful about the assumptions they make regarding reader knowledge. By clearly defining key terms and concepts instead of assuming the reader is familiar with them, these introductions set a more solid foundation for understanding.
To pull in the reader and make that all-important good first impression, excellent research paper introductions will often incorporate a compelling narrative or some striking fact that grabs the reader's attention.
Finally, good introductions provide clear citations from past research to back up the claims they're making. In the case of argumentative papers or essays (those that take a stance on a topic or issue), a strong thesis statement compels the reader to continue reading.
Common pitfalls to avoid in research paper introductions
You can also learn what not to do by looking at other research papers. Many authors have made mistakes you can learn from.
We've talked about the need to be clear and concise. Many introductions fail at this; they're verbose, vague, or otherwise fail to convey the research problem or hypothesis efficiently. This often comes in the form of an overemphasis on background information, which obscures the main research focus.
Ensure your introduction provides the proper emphasis and excitement around your research and its significance. Otherwise, fewer people will want to read more about it.
- Crafting a compelling introduction for a research paper
Let’s take a look at the steps required to craft an introduction that pulls readers in and compels them to learn more about your research.
Step 1: Capturing interest and setting the scene
To capture the reader's interest immediately, begin your introduction with a compelling question, a surprising fact, a provocative quote, or some other mechanism that will hook readers and pull them further into the paper.
As they continue reading, the introduction should contextualize your research within the current field, showing readers its relevance and importance. Clarify any essential terms that will help them better understand what you're saying. This keeps the fundamentals of your research accessible to all readers from all backgrounds.
Step 2: Building a solid foundation with background information
Including background information in your introduction serves two major purposes:
It helps to clarify the topic for the reader
It establishes the depth of your research
The approach you take when conveying this information depends on the type of paper.
For argumentative papers, you'll want to develop engaging background narratives. These should provide context for the argument you'll be presenting.
For empirical papers, highlighting past research is the key. Often, there will be some questions that weren't answered in those past papers. If your paper is focused on those areas, those papers make ideal candidates for you to discuss and critique in your introduction.
Step 3: Pinpointing the research challenge
To capture the attention of the reader, you need to explain what research challenges you'll be discussing.
For argumentative papers, this involves articulating why the argument you'll be making is important. What is its relevance to current discussions or problems? What is the potential impact of people accepting or rejecting your argument?
For empirical papers, explain how your research is addressing a gap in existing knowledge. What new insights or contributions will your research bring to your field?
Step 4: Clarifying your research aims and objectives
We mentioned earlier that the introduction to a research paper can serve as a roadmap for what's within. We've also frequently discussed the need for clarity. This step addresses both of these.
When writing an argumentative paper, craft a thesis statement with impact. Clearly articulate what your position is and the main points you intend to present. This will map out for the reader exactly what they'll get from reading the rest.
For empirical papers, focus on formulating precise research questions and hypotheses. Directly link them to the gaps or issues you've identified in existing research to show the reader the precise direction your research paper will take.
Step 5: Sketching the blueprint of your study
Continue building a roadmap for your readers by designing a structured outline for the paper. Guide the reader through your research journey, explaining what the different sections will contain and their relationship to one another.
This outline should flow seamlessly as you move from section to section. Creating this outline early can also help guide the creation of the paper itself, resulting in a final product that's better organized. In doing so, you'll craft a paper where each section flows intuitively from the next.
Step 6: Integrating your research question
To avoid letting your research question get lost in background information or clarifications, craft your introduction in such a way that the research question resonates throughout. The research question should clearly address a gap in existing knowledge or offer a new perspective on an existing problem.
Tell users your research question explicitly but also remember to frequently come back to it. When providing context or clarification, point out how it relates to the research question. This keeps your focus where it needs to be and prevents the topic of the paper from becoming under-emphasized.
Step 7: Establishing the scope and limitations
So far, we've talked mostly about what's in the paper and how to convey that information to readers. The opposite is also important. Information that's outside the scope of your paper should be made clear to the reader in the introduction so their expectations for what is to follow are set appropriately.
Similarly, be honest and upfront about the limitations of the study. Any constraints in methodology, data, or how far your findings can be generalized should be fully communicated in the introduction.
Step 8: Concluding the introduction with a promise
The final few lines of the introduction are your last chance to convince people to continue reading the rest of the paper. Here is where you should make it very clear what benefit they'll get from doing so. What topics will be covered? What questions will be answered? Make it clear what they will get for continuing.
By providing a quick recap of the key points contained in the introduction in its final lines and properly setting the stage for what follows in the rest of the paper, you refocus the reader's attention on the topic of your research and guide them to read more.
- Research paper introduction best practices
Following the steps above will give you a compelling introduction that hits on all the key points an introduction should have. Some more tips and tricks can make an introduction even more polished.
As you follow the steps above, keep the following tips in mind.
Set the right tone and style
Like every piece of writing, a research paper should be written for the audience. That is to say, it should match the tone and style that your academic discipline and target audience expect. This is typically a formal and academic tone, though the degree of formality varies by field.
Kno w the audience
The perfect introduction balances clarity with conciseness. The amount of clarification required for a given topic depends greatly on the target audience. Knowing who will be reading your paper will guide you in determining how much background information is required.
Adopt the CARS (create a research space) model
The CARS model is a helpful tool for structuring introductions. This structure has three parts. The beginning of the introduction establishes the general research area. Next, relevant literature is reviewed and critiqued. The final section outlines the purpose of your study as it relates to the previous parts.
Master the art of funneling
The CARS method is one example of a well-funneled introduction. These start broadly and then slowly narrow down to your specific research problem. It provides a nice narrative flow that provides the right information at the right time. If you stray from the CARS model, try to retain this same type of funneling.
Incorporate narrative element
People read research papers largely to be informed. But to inform the reader, you have to hold their attention. A narrative style, particularly in the introduction, is a great way to do that. This can be a compelling story, an intriguing question, or a description of a real-world problem.
Write the introduction last
By writing the introduction after the rest of the paper, you'll have a better idea of what your research entails and how the paper is structured. This prevents the common problem of writing something in the introduction and then forgetting to include it in the paper. It also means anything particularly exciting in the paper isn’t neglected in the intro.
Should you be using a customer insights hub?
Do you want to discover previous research faster?
Do you share your research findings with others?
Do you analyze research data?
Start for free today, add your research, and get to key insights faster
Editor’s picks
Last updated: 18 April 2023
Last updated: 27 February 2023
Last updated: 22 August 2024
Last updated: 5 February 2023
Last updated: 16 April 2023
Last updated: 9 March 2023
Last updated: 30 April 2024
Last updated: 12 December 2023
Last updated: 11 March 2024
Last updated: 4 July 2024
Last updated: 6 March 2024
Last updated: 5 March 2024
Last updated: 13 May 2024
Latest articles
Related topics, .css-je19u9{-webkit-align-items:flex-end;-webkit-box-align:flex-end;-ms-flex-align:flex-end;align-items:flex-end;display:-webkit-box;display:-webkit-flex;display:-ms-flexbox;display:flex;-webkit-flex-direction:row;-ms-flex-direction:row;flex-direction:row;-webkit-box-flex-wrap:wrap;-webkit-flex-wrap:wrap;-ms-flex-wrap:wrap;flex-wrap:wrap;-webkit-box-pack:center;-ms-flex-pack:center;-webkit-justify-content:center;justify-content:center;row-gap:0;text-align:center;max-width:671px;}@media (max-width: 1079px){.css-je19u9{max-width:400px;}.css-je19u9>span{white-space:pre;}}@media (max-width: 799px){.css-je19u9{max-width:400px;}.css-je19u9>span{white-space:pre;}} decide what to .css-1kiodld{max-height:56px;display:-webkit-box;display:-webkit-flex;display:-ms-flexbox;display:flex;-webkit-align-items:center;-webkit-box-align:center;-ms-flex-align:center;align-items:center;}@media (max-width: 1079px){.css-1kiodld{display:none;}} build next, decide what to build next, log in or sign up.
Get started for free
Research Paper Introduction Examples

Looking for research paper introduction examples? Quotes, anecdotes, questions, examples, and broad statements—all of them can be used successfully to write an introduction for a research paper. It’s instructive to see them in action, in the hands of skilled academic writers.
Let’s begin with David M. Kennedy’s superb history, Freedom from Fear: The American People in Depression and War, 1929–1945 . Kennedy begins each chapter with a quote, followed by his text. The quote above chapter 1 shows President Hoover speaking in 1928 about America’s golden future. The text below it begins with the stock market collapse of 1929. It is a riveting account of just how wrong Hoover was. The text about the Depression is stronger because it contrasts so starkly with the optimistic quotation.
Academic Writing, Editing, Proofreading, And Problem Solving Services
Get 10% off with 24start discount code.
“We in America today are nearer the final triumph over poverty than ever before in the history of any land.”—Herbert Hoover, August 11, 1928 Like an earthquake, the stock market crash of October 1929 cracked startlingly across the United States, the herald of a crisis that was to shake the American way of life to its foundations. The events of the ensuing decade opened a fissure across the landscape of American history no less gaping than that opened by the volley on Lexington Common in April 1775 or by the bombardment of Sumter on another April four score and six years later. (adsbygoogle = window.adsbygoogle || []).push({}); The ratcheting ticker machines in the autumn of 1929 did not merely record avalanching stock prices. In time they came also to symbolize the end of an era. (David M. Kennedy, Freedom from Fear: The American People in Depression and War, 1929–1945 . New York: Oxford University Press, 1999, p. 10)
Kennedy has exciting, wrenching material to work with. John Mueller faces the exact opposite problem. In Retreat from Doomsday: The Obsolescence of Major War , he is trying to explain why Great Powers have suddenly stopped fighting each other. For centuries they made war on each other with devastating regularity, killing millions in the process. But now, Mueller thinks, they have not just paused; they have stopped permanently. He is literally trying to explain why “nothing is happening now.” That may be an exciting topic intellectually, it may have great practical significance, but “nothing happened” is not a very promising subject for an exciting opening paragraph. Mueller manages to make it exciting and, at the same time, shows why it matters so much. Here’s his opening, aptly entitled “History’s Greatest Nonevent”:
On May 15, 1984, the major countries of the developed world had managed to remain at peace with each other for the longest continuous stretch of time since the days of the Roman Empire. If a significant battle in a war had been fought on that day, the press would have bristled with it. As usual, however, a landmark crossing in the history of peace caused no stir: the most prominent story in the New York Times that day concerned the saga of a manicurist, a machinist, and a cleaning woman who had just won a big Lotto contest. This book seeks to develop an explanation for what is probably the greatest nonevent in human history. (John Mueller, Retreat from Doomsday: The Obsolescence of Major War . New York: Basic Books, 1989, p. 3)
In the space of a few sentences, Mueller sets up his puzzle and reveals its profound human significance. At the same time, he shows just how easy it is to miss this milestone in the buzz of daily events. Notice how concretely he does that. He doesn’t just say that the New York Times ignored this record setting peace. He offers telling details about what they covered instead: “a manicurist, a machinist, and a cleaning woman who had just won a big Lotto contest.” Likewise, David Kennedy immediately entangles us in concrete events: the stunning stock market crash of 1929. These are powerful openings that capture readers’ interests, establish puzzles, and launch narratives.
Sociologist James Coleman begins in a completely different way, by posing the basic questions he will study. His ambitious book, Foundations of Social Theory , develops a comprehensive theory of social life, so it is entirely appropriate for him to begin with some major questions. But he could just as easily have begun with a compelling story or anecdote. He includes many of them elsewhere in his book. His choice for the opening, though, is to state his major themes plainly and frame them as a paradox. Sociologists, he says, are interested in aggregate behavior—how people act in groups, organizations, or large numbers—yet they mostly examine individuals:
A central problem in social science is that of accounting for the function of some kind of social system. Yet in most social research, observations are not made on the system as a whole, but on some part of it. In fact, the natural unit of observation is the individual person… This has led to a widening gap between theory and research… (James S. Coleman, Foundations of Social Theory . Cambridge, MA: Harvard University Press, 1990, pp. 1–2)
After expanding on this point, Coleman explains that he will not try to remedy the problem by looking solely at groups or aggregate-level data. That’s a false solution, he says, because aggregates don’t act; individuals do. So the real problem is to show the links between individual actions and aggregate outcomes, between the micro and the macro.
The major problem for explanations of system behavior based on actions and orientations at a level below that of the system [in this case, on individual-level actions] is that of moving from the lower level to the system level. This has been called the micro-to-macro problem, and it is pervasive throughout the social sciences. (Coleman, Foundations of Social Theory , p. 6)
Explaining how to deal with this “micro-to-macro problem” is the central issue of Coleman’s book, and he announces it at the beginning.
Coleman’s theory-driven opening stands at the opposite end of the spectrum from engaging stories or anecdotes, which are designed to lure the reader into the narrative and ease the path to a more analytic treatment later in the text. Take, for example, the opening sentences of Robert L. Herbert’s sweeping study Impressionism: Art, Leisure, and Parisian Society : “When Henry Tuckerman came to Paris in 1867, one of the thousands of Americans attracted there by the huge international exposition, he was bowled over by the extraordinary changes since his previous visit twenty years before.” (Robert L. Herbert, Impressionism: Art, Leisure, and Parisian Society . New Haven, CT: Yale University Press, 1988, p. 1.) Herbert fills in the evocative details to set the stage for his analysis of the emerging Impressionist art movement and its connection to Parisian society and leisure in this period.
David Bromwich writes about Wordsworth, a poet so familiar to students of English literature that it is hard to see him afresh, before his great achievements, when he was just a young outsider starting to write. To draw us into Wordsworth’s early work, Bromwich wants us to set aside our entrenched images of the famous mature poet and see him as he was in the 1790s, as a beginning writer on the margins of society. He accomplishes this ambitious task in the opening sentences of Disowned by Memory: Wordsworth’s Poetry of the 1790s :
Wordsworth turned to poetry after the revolution to remind himself that he was still a human being. It was a curious solution, to a difficulty many would not have felt. The whole interest of his predicament is that he did feel it. Yet Wordsworth is now so established an eminence—his name so firmly fixed with readers as a moralist of self-trust emanating from complete self-security—that it may seem perverse to imagine him as a criminal seeking expiation. Still, that is a picture we get from The Borderers and, at a longer distance, from “Tintern Abbey.” (David Bromwich, Disowned by Memory: Wordsworth’s Poetry of the 1790s . Chicago: University of Chicago Press, 1998, p. 1)
That’s a wonderful opening! Look at how much Bromwich accomplishes in just a few words. He not only prepares the way for analyzing Wordsworth’s early poetry; he juxtaposes the anguished young man who wrote it to the self-confident, distinguished figure he became—the eminent man we can’t help remembering as we read his early poetry.
Let us highlight a couple of other points in this passage because they illustrate some intelligent writing choices. First, look at the odd comma in this sentence: “It was a curious solution, to a difficulty many would not have felt.” Any standard grammar book would say that comma is wrong and should be omitted. Why did Bromwich insert it? Because he’s a fine writer, thinking of his sentence rhythm and the point he wants to make. The comma does exactly what it should. It makes us pause, breaking the sentence into two parts, each with an interesting point. One is that Wordsworth felt a difficulty others would not have; the other is that he solved it in a distinctive way. It would be easy for readers to glide over this double message, so Bromwich has inserted a speed bump to slow us down. Most of the time, you should follow grammatical rules, like those about commas, but you should bend them when it serves a good purpose. That’s what the writer does here.
The second small point is the phrase “after the revolution” in the first sentence: “Wordsworth turned to poetry after the revolution to remind himself that he was still a human being.” Why doesn’t Bromwich say “after the French Revolution”? Because he has judged his book’s audience. He is writing for specialists who already know which revolution is reverberating through English life in the 1790s. It is the French Revolution, not the earlier loss of the American colonies. If Bromwich were writing for a much broader audience—say, the New York Times Book Review—he would probably insert the extra word to avoid confusion.
The message “Know your audience” applies to all writers. Don’t talk down to them by assuming they can’t get dressed in the morning. Don’t strut around showing off your book learnin’ by tossing in arcane facts and esoteric language for its own sake. Neither will win over readers.
Bromwich, Herbert, and Coleman open their works in different ways, but their choices work well for their different texts. Your task is to decide what kind of opening will work best for yours. Don’t let that happen by default, by grabbing the first idea you happen upon. Consider a couple of different ways of opening your thesis and then choose the one you prefer. Give yourself some options, think them over, then make an informed choice.
Using the Introduction to Map out Your Writing
Whether you begin with a story, puzzle, or broad statement, the next part of the research paper introduction should pose your main questions and establish your argument. This is your thesis statement—your viewpoint along with the supporting reasons and evidence. It should be articulated plainly so readers understand full well what your paper is about and what it will argue.
After that, give your readers a road map of what’s to come. That’s normally done at the end of the introductory section (or, in a book, at the end of the introductory chapter). Here’s John J. Mearsheimer presenting such a road map in The Tragedy of Great Power Politics . He not only tells us the order of upcoming chapters, he explains why he’s chosen that order and which chapters are most important:
The Plan of the Book The rest of the chapters in this book are concerned mainly with answering the six big questions about power which I identified earlier. Chapter 2, which is probably the most important chapter in the book, lays out my theory of why states compete for power and why they pursue hegemony. In Chapters 3 and 4, I define power and explain how to measure it. I do this in order to lay the groundwork for testing my theory… (John J. Mearsheimer, The Tragedy of Great Power Politics . New York: W. W. Norton, 2001, p. 27)
As this excerpt makes clear, Mearsheimer has already laid out his “six big questions” in the research paper introduction. Now he’s showing us the path ahead, the path to answering those questions.
At the end of the research paper introduction, give your readers a road map of what’s to come. Tell them what the upcoming sections will be and why they are arranged in this particular order.
Learn how to write an introduction for a research paper .
ORDER HIGH QUALITY CUSTOM PAPER

How to Write a Research Paper Introduction (with Examples)

Table of Contents
The research paper introduction section, along with the Title and Abstract, can be considered the face of any research paper. The following article is intended to guide you in organizing and writing the research paper introduction for a quality academic article or dissertation.
The research paper introduction aims to present the topic to the reader. A study will only be accepted for publishing if you can ascertain that the available literature cannot answer your research question. So it is important to ensure that you have read important studies on that particular topic, especially those within the last five to ten years, and that they are properly referenced in this section. 1
What should be included in the research paper introduction is decided by what you want to tell readers about the reason behind the research and how you plan to fill the knowledge gap. The best research paper introduction provides a systemic review of existing work and demonstrates additional work that needs to be done. It needs to be brief, captivating, and well-referenced; a well-drafted research paper introduction will help the researcher win half the battle.
The introduction for a research paper is where you set up your topic and approach for the reader. It has several key goals:
- Present your research topic
- Capture reader interest
- Summarize existing research
- Position your own approach
- Define your specific research problem and problem statement
- Highlight the novelty and contributions of the study
- Give an overview of the paper’s structure
The research paper introduction can vary in size and structure depending on whether your paper presents the results of original empirical research or is a review paper. Some research paper introduction examples are only half a page while others are a few pages long. In many cases, the introduction will be shorter than all of the other sections of your paper; its length depends on the size of your paper as a whole.
What is the introduction for a research paper?
The introduction in a research paper is placed at the beginning to guide the reader from a broad subject area to the specific topic that your research addresses. They present the following information to the reader
- Scope: The topic covered in the research paper
- Context: Background of your topic
- Importance: Why your research matters in that particular area of research and the industry problem that can be targeted
Why is the introduction important in a research paper?
The research paper introduction conveys a lot of information and can be considered an essential roadmap for the rest of your paper. A good introduction for a research paper is important for the following reasons:
- It stimulates your reader’s interest: A good introduction section can make your readers want to read your paper by capturing their interest. It informs the reader what they are going to learn and helps determine if the topic is of interest to them.
- It helps the reader understand the research background: Without a clear introduction, your readers may feel confused and even struggle when reading your paper. A good research paper introduction will prepare them for the in-depth research to come. It provides you the opportunity to engage with the readers and demonstrate your knowledge and authority on the specific topic.
- It explains why your research paper is worth reading: Your introduction can convey a lot of information to your readers. It introduces the topic, why the topic is important, and how you plan to proceed with your research.
- It helps guide the reader through the rest of the paper: The research paper introduction gives the reader a sense of the nature of the information that will support your arguments and the general organization of the paragraphs that will follow.
What are the parts of introduction in the research?
A good research paper introduction section should comprise three main elements: 2
- What is known: This sets the stage for your research. It informs the readers of what is known on the subject.
- What is lacking: This is aimed at justifying the reason for carrying out your research. This could involve investigating a new concept or method or building upon previous research.
- What you aim to do: This part briefly states the objectives of your research and its major contributions. Your detailed hypothesis will also form a part of this section.
Check out how Peace Alemede uses Paperpal to write her research paper

Peace Alemede, Student, University of Ilorin
Paperpal has been an excellent and beneficial tool for editing my research work. With the help of Paperpal, I am now able to write and produce results at a much faster rate. For instance, I recently used Paperpal to edit a research article that is currently being considered for publication. The tool allowed me to align the language of my paragraph ideas to a more academic setting, thereby saving me both time and resources. As a result, my work was deemed accurate for use. I highly recommend this tool to anyone in need of efficient and effective research paper editing. Peace Alemede, Student, University of Ilorin, Nigeria
Start Writing for Free
How to write a research paper introduction?
The first step in writing the research paper introduction is to inform the reader what your topic is and why it’s interesting or important. This is generally accomplished with a strong opening statement. The second step involves establishing the kinds of research that have been done and ending with limitations or gaps in the research that you intend to address.
Finally, the research paper introduction clarifies how your own research fits in and what problem it addresses. If your research involved testing hypotheses, these should be stated along with your research question. The hypothesis should be presented in the past tense since it will have been tested by the time you are writing the research paper introduction.
The following key points, with examples, can guide you when writing the research paper introduction section:
1. Introduce the research topic:
- Highlight the importance of the research field or topic
- Describe the background of the topic
- Present an overview of current research on the topic
Example: The inclusion of experiential and competency-based learning has benefitted electronics engineering education. Industry partnerships provide an excellent alternative for students wanting to engage in solving real-world challenges. Industry-academia participation has grown in recent years due to the need for skilled engineers with practical training and specialized expertise. However, from the educational perspective, many activities are needed to incorporate sustainable development goals into the university curricula and consolidate learning innovation in universities.
2. Determine a research niche:
- Reveal a gap in existing research or oppose an existing assumption
- Formulate the research question
Example: There have been plausible efforts to integrate educational activities in higher education electronics engineering programs. However, very few studies have considered using educational research methods for performance evaluation of competency-based higher engineering education, with a focus on technical and or transversal skills. To remedy the current need for evaluating competencies in STEM fields and providing sustainable development goals in engineering education, in this study, a comparison was drawn between study groups without and with industry partners.
3. Place your research within the research niche:
- State the purpose of your study
- Highlight the key characteristics of your study
- Describe important results
- Highlight the novelty of the study.
- Offer a brief overview of the structure of the paper.
Example: The study evaluates the main competency needed in the applied electronics course, which is a fundamental core subject for many electronics engineering undergraduate programs. We compared two groups, without and with an industrial partner, that offered real-world projects to solve during the semester. This comparison can help determine significant differences in both groups in terms of developing subject competency and achieving sustainable development goals.
Write a Research Paper Introduction in Minutes with Paperpal
Paperpal is a generative AI-powered academic writing assistant. It’s trained on millions of published scholarly articles and over 20 years of STM experience. Paperpal helps authors write better and faster with:
- Real-time writing suggestions
- In-depth checks for language and grammar correction
- Paraphrasing to add variety, ensure academic tone, and trim text to meet journal limits
With Paperpal, create a research paper introduction effortlessly. In this step-by-step guide, we’ll walk you through how Paperpal transforms your initial ideas into a polished and publication-ready introduction.
How to use Paperpal to write the Introduction section
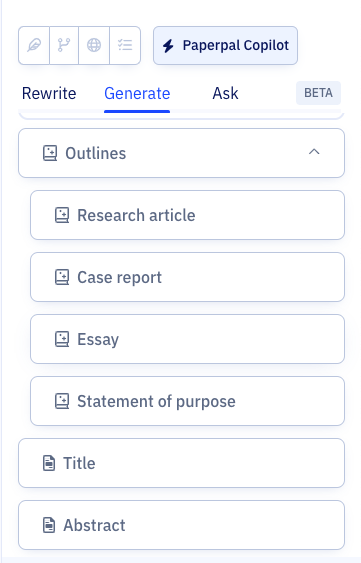
Step 1: Sign up on Paperpal and click on the Copilot feature, under this choose Outlines > Research Article > Introduction
Step 2: Add your unstructured notes or initial draft, whether in English or another language, to Paperpal, which is to be used as the base for your content.
Step 3: Fill in the specifics, such as your field of study, brief description or details you want to include, which will help the AI generate the outline for your Introduction.
Step 4: Use this outline and sentence suggestions to develop your content, adding citations where needed and modifying it to align with your specific research focus.
Step 5: Turn to Paperpal’s granular language checks to refine your content, tailor it to reflect your personal writing style, and ensure it effectively conveys your message.
You can use the same process to develop each section of your article, and finally your research paper in half the time and without any of the stress.
Frequently Asked Questions
What is the purpose of the introduction in research papers.
The purpose of the research paper introduction is to introduce the reader to the problem definition, justify the need for the study, and describe the main theme of the study. The aim is to gain the reader’s attention by providing them with necessary background information and establishing the main purpose and direction of the research.
How long should the research paper introduction be?
The length of the research paper introduction can vary across journals and disciplines. While there are no strict word limits for writing the research paper introduction, an ideal length would be one page, with a maximum of 400 words over 1-4 paragraphs. Generally, it is one of the shorter sections of the paper as the reader is assumed to have at least a reasonable knowledge about the topic. 2
For example, for a study evaluating the role of building design in ensuring fire safety, there is no need to discuss definitions and nature of fire in the introduction; you could start by commenting upon the existing practices for fire safety and how your study will add to the existing knowledge and practice.
What should be included in the research paper introduction?
When deciding what to include in the research paper introduction, the rest of the paper should also be considered. The aim is to introduce the reader smoothly to the topic and facilitate an easy read without much dependency on external sources. 3
Below is a list of elements you can include to prepare a research paper introduction outline and follow it when you are writing the research paper introduction.
- Topic introduction: This can include key definitions and a brief history of the topic.
- Research context and background: Offer the readers some general information and then narrow it down to specific aspects.
- Details of the research you conducted: A brief literature review can be included to support your arguments or line of thought.
- Rationale for the study: This establishes the relevance of your study and establishes its importance.
- Importance of your research: The main contributions are highlighted to help establish the novelty of your study
- Research hypothesis: Introduce your research question and propose an expected outcome. Organization of the paper: Include a short paragraph of 3-4 sentences that highlights your plan for the entire paper
Should I include citations in the introduction for a research paper?
Cite only works that are most relevant to your topic; as a general rule, you can include one to three. Note that readers want to see evidence of original thinking. So it is better to avoid using too many references as it does not leave much room for your personal standpoint to shine through.
Citations in your research paper introduction support the key points, and the number of citations depend on the subject matter and the point discussed. If the research paper introduction is too long or overflowing with citations, it is better to cite a few review articles rather than the individual articles summarized in the review.
A good point to remember when citing research papers in the introduction section is to include at least one-third of the references in the introduction.
Should I provide a literature review in the research paper introduction?
The literature review plays a significant role in the research paper introduction section. A good literature review accomplishes the following:
- Introduces the topic
- Establishes the study’s significance
- Provides an overview of the relevant literature
- Provides context for the study using literature
- Identifies knowledge gaps
However, remember to avoid making the following mistakes when writing a research paper introduction:
- Do not use studies from the literature review to aggressively support your research
- Avoid direct quoting
- Do not allow literature review to be the focus of this section. Instead, the literature review should only aid in setting a foundation for the manuscript.
Key points to remember
Remember the following key points for writing a good research paper introduction: 4
- Avoid stuffing too much general information: Avoid including what an average reader would know and include only that information related to the problem being addressed in the research paper introduction. For example, when describing a comparative study of non-traditional methods for mechanical design optimization, information related to the traditional methods and differences between traditional and non-traditional methods would not be relevant. In this case, the introduction for the research paper should begin with the state-of-the-art non-traditional methods and methods to evaluate the efficiency of newly developed algorithms.
- Avoid packing too many references: Cite only the required works in your research paper introduction. The other works can be included in the discussion section to strengthen your findings.
- Avoid extensive criticism of previous studies: Avoid being overly critical of earlier studies while setting the rationale for your study. A better place for this would be the Discussion section, where you can highlight the advantages of your method.
- Avoid describing conclusions of the study: When writing a research paper introduction remember not to include the findings of your study. The aim is to let the readers know what question is being answered. The actual answer should only be given in the Results and Discussion section.
To summarize, the research paper introduction section should be brief yet informative. It should convince the reader the need to conduct the study and motivate him to read further. If you’re feeling stuck or unsure, choose trusted AI academic writing assistants like Paperpal to effortlessly craft your research paper introduction and other sections of your research article.
- Jawaid, S. A., & Jawaid, M. (2019). How to write introduction and discussion. Saudi Journal of Anaesthesia, 13(Suppl 1), S18.
- Dewan, P., & Gupta, P. (2016). Writing the title, abstract and introduction: Looks matter!. Indian pediatrics, 53, 235-241.
- Cetin, S., & Hackam, D. J. (2005). An approach to the writing of a scientific Manuscript1. Journal of Surgical Research, 128(2), 165-167.
- Bavdekar, S. B. (2015). Writing introduction: Laying the foundations of a research paper. Journal of the Association of Physicians of India, 63(7), 44-6.
Paperpal is a comprehensive AI writing toolkit that helps students and researchers achieve 2x the writing in half the time. It leverages 21+ years of STM experience and insights from millions of research articles to provide in-depth academic writing, language editing, and submission readiness support to help you write better, faster.
Get accurate academic translations, rewriting support, grammar checks, vocabulary suggestions, and generative AI assistance that delivers human precision at machine speed. Try for free or upgrade to Paperpal Prime starting at US$19 a month to access premium features, including consistency, plagiarism, and 30+ submission readiness checks to help you succeed.
Experience the future of academic writing – Sign up to Paperpal and start writing for free!
Related Reads:
- 5 Reasons for Rejection After Peer Review
- Ethical Research Practices For Research with Human Subjects
- 8 Most Effective Ways to Increase Motivation for Thesis Writing
- 6 Tips for Post-Doc Researchers to Take Their Career to the Next Level
Practice vs. Practise: Learn the Difference
Academic paraphrasing: why paperpal’s rewrite should be your first choice , you may also like, how to cite in apa format (7th edition):..., how to write your research paper in apa..., how to choose a dissertation topic, how to write a phd research proposal, how to write an academic paragraph (step-by-step guide), research funding basics: what should a grant proposal..., how to write an abstract in research papers..., how to write dissertation acknowledgements, how to write the first draft of a..., mla works cited page: format, template & examples.
Free Introduction to Research Generator
📖 introductions in research.
- ✅ 7 Tips for Introductions
- ⚡ 7 Mistakes to Avoid
🔗 References
Research is crucial in developing new knowledge, solving complex tasks, and gaining headway in various fields. Sometimes, a researcher has the perfect subject to work with and is ready to write about it. However, they realize that they struggle to compose their thoughts and start on their task.
Our research introduction generator is perfect for such occasions.
- Is easy to use,
- Saves time,
- Helps tailor a unique introduction.
The tool might inspire you to take the paper in a new direction. Aside from a user-friendly instrument, we also provide valuable information and advice to make paper writing much easier.
Essay Writing and Introductions
The introduction is the first part of a research paper or an essay in an academic setting . It explains the reason for looking into an issue, its significance, and its goals. With that said, an introduction doesn't cover the study methods or the results of the study. There are separate paper sections to expand on this information in great detail.
A good intro begins with a general statement and narrows it down to the selected research subject. It provides used sources and is usually no longer than four paragraphs. However, the size of the introduction may vary depending on the style guide and research topic . It differs from one field to another, which our introduction in research generator is designed to accommodate.
How to Structure an Intro Paragraph
The introduction gives a concise overview of your research. Important background information makes it easier for the audience to comprehend the significance of your work . Understanding the proper structure of the introduction is vital to get your point across in a straightforward manner.
A well-made intro consists of three elements :
| ✏️ Hook sentence | An introduction starts with a that captivates the reader. It either makes or breaks any incentive to continue with the paper. Researchers should take extra time and effort to perfect the hook sentence. It will serve as an appetizer to the research they've poured their heart into. |
| 🔎️ Background research overview | After the hook sentence, one should briefly explain the . You must talk about the previous studies on the issue that will be further addressed in the paper. It gives readers a taste of what's to come later in the article. |
| 📝 Strong thesis statement | A good introduction ends with a thesis statement anchoring the entire research paper. It explains the main argument for which you'll build a case in one or two sentences. |
✅ 7 Tips for Successful Research Paper Introductions
This section covers the most effective tips for improving your introduction. Several things play into its success:
- Start with the general and narrow it down . The first paragraph briefly covers the broader research field and moves to a particular subject. This approach makes the paper easier to understand for the wider audience .
- Explain the importance and objectives . One should clearly state their aims with a particular research topic. Otherwise, the readers won't understand why they should care about its outcome.
- Use the right amount of citations . The introduction should be based on the latest related data. Do not overuse quotations , as they distract readers from the paper itself.
- Provide a clear-cut research question or hypothesis . The former works best for papers on formal sciences and exploratory research. You may use the later format for empirical scientific research.
- Provide an overview of the paper when possible . The last part of the introduction may include a rundown of the document's structure. Note that its addition varies from one discipline to another. It's more prevalent in papers on technology and less so in medical research.
- Keep it short . The introduction part should be around 500-1000 words. Check the guidelines or ask your professors to better pinpoint the right length for your intro.
- Don't provide too much detail . Avoid mentioning too many specifics in the introductory part. There will be dedicated sections of the paper disclosing them later on. Better use general statements and exclude lengthy explanations.
⚡ 7 Mistakes to Avoid When Writing an Intro
Introductions are often considered to be the most difficult part of writing an essay – perhaps, even more difficult than conclusions! This is why we've also prepared a list of common mistakes you better avoid when working on them.
When writing an introduction, try to avoid...
| ❌ | . Sometimes researchers include data unrelated to the subject of their work. It wastes their time and makes the introductory part harder to structure. |
| ❌ | . As mentioned before, this paper segment should state the article's aim in general terms. If you explain everything at the beginning, there's no reason to write the rest of the document. |
| ❌ | . Sometimes the introduction fails to convince readers about the importance of the work in concrete terms. Make sure to concentrate on the value your work will bring to your field. |
| ❌ | . This tells the readers that the writer doesn't have a fair grasp of the subject. Weigh each piece of information and stick only to relevant facts. |
| ❌ | . The entire paper has to be original. Our handy research introduction generator will help ensure that your writing is unique and effective. |
| ❌ | . A good introduction should clearly state the importance of the study you've decided to investigate. One may achieve this by hinting at the broader . |
| ❌ | . As with all writing, the introductory part needs to be structured efficiently. When sentences feel out of place, it makes readers less likely to continue reading your paper. |
Our research introduction generator will help deal with your writer's block and be beneficial in later work! Remember to give our FAQ a look.
❓ Research Introduction Generator - FAQ
Updated: Jul 19th, 2024
- Introduction to Research. – Richard F. Taflinger, Washington State University
- Introduction Sections in Scientific Research Reports. – George Mason University
- How to Write a Good Introduction in 3 Steps (With Example). – Indeed
- The Role of an Introduction. – Pomona College
- 5 Things to Avoid When Writing an Introduction. – Walden University
- Introduction to Research. – Michigan Technological University
- Introductions and Conclusions. – Leora Freedman and Jerry Plotnick, University of Toronto
- Avoid these three mistakes when writing your introduction. – David Otey, Speaking of Solutions
- Organizing Academic Research Papers: The Introduction. – Sacred Heart University Library
- Introductions. – University of North Carolina at Chapel Hill
IvyPanda uses cookies and similar technologies to enhance your experience, enabling functionalities such as:
- Basic site functions
- Ensuring secure, safe transactions
- Secure account login
- Remembering account, browser, and regional preferences
- Remembering privacy and security settings
- Analyzing site traffic and usage
- Personalized search, content, and recommendations
- Displaying relevant, targeted ads on and off IvyPanda
Please refer to IvyPanda's Cookies Policy and Privacy Policy for detailed information.
Certain technologies we use are essential for critical functions such as security and site integrity, account authentication, security and privacy preferences, internal site usage and maintenance data, and ensuring the site operates correctly for browsing and transactions.
Cookies and similar technologies are used to enhance your experience by:
- Remembering general and regional preferences
- Personalizing content, search, recommendations, and offers
Some functions, such as personalized recommendations, account preferences, or localization, may not work correctly without these technologies. For more details, please refer to IvyPanda's Cookies Policy .
To enable personalized advertising (such as interest-based ads), we may share your data with our marketing and advertising partners using cookies and other technologies. These partners may have their own information collected about you. Turning off the personalized advertising setting won't stop you from seeing IvyPanda ads, but it may make the ads you see less relevant or more repetitive.
Personalized advertising may be considered a "sale" or "sharing" of the information under California and other state privacy laws, and you may have the right to opt out. Turning off personalized advertising allows you to exercise your right to opt out. Learn more in IvyPanda's Cookies Policy and Privacy Policy .
- Clerc Center | PK-12 & Outreach
- KDES | PK-8th Grade School (D.C. Metro Area)
- MSSD | 9th-12th Grade School (Nationwide)
- Gallaudet University Regional Centers
- Parent Advocacy App
- K-12 ASL Content Standards
- National Resources
- Youth Programs
- Academic Bowl
- Battle Of The Books
- National Literary Competition
- Youth Debate Bowl
- Youth Esports Series
- Bison Sports Camp
- Discover College and Careers (DC²)
- Financial Wizards
- Immerse Into ASL
- Alumni Relations
- Alumni Association
- Homecoming Weekend
- Class Giving
- Get Tickets / BisonPass
- Sport Calendars
- Cross Country
- Swimming & Diving
- Track & Field
- Indoor Track & Field
- Cheerleading
- Winter Cheerleading
- Human Resources
- Plan a Visit
- Request Info

- Areas of Study
- Accessible Human-Centered Computing
- American Sign Language
- Art and Media Design
- Communication Studies
- Criminal Justice
- Data Science
- Deaf Studies
- Early Intervention Studies Graduate Programs
- Educational Neuroscience
- Hearing, Speech, and Language Sciences
- Information Technology
- International Development
- Interpretation and Translation
- Linguistics
- Mathematics
- Philosophy and Religion
- Physical Education & Recreation
- Public Affairs
- Public Health
- Sexuality and Gender Studies
- Social Work
- Theatre and Dance
- World Languages and Cultures
- B.A. in American Sign Language
- B.A. in Biology
- B.A. in Communication Studies
- B.A. in Communication Studies for Online Degree Completion Program
- B.A. in Deaf Studies
- B.A. in Deaf Studies for Online Degree Completion Program
- B.A. in Education with a Specialization in Early Childhood Education
- B.A. in Education with a Specialization in Elementary Education
- B.A. in English
- B.A. in English for Online Degree Completion Program
- B.A. in Government
- B.A. in Government with a Specialization in Law
- B.A. in History
- B.A. in Interdisciplinary Spanish
- B.A. in International Studies
- B.A. in Mathematics
- B.A. in Philosophy
- B.A. in Psychology
- B.A. in Psychology for Online Degree Completion Program
- B.A. in Social Work (BSW)
- B.A. in Sociology with a concentration in Criminology
- B.A. in Theatre Arts: Production/Performance
- B.A. or B.S. in Education with a Specialization in Secondary Education: Science, English, Mathematics or Social Studies
- B.S. in Accounting
- B.S. in Accounting for Online Degree Completion Program
- B.S. in Biology
- B.S. in Business Administration
- B.S. in Business Administration for Online Degree Completion Program
- B.S. in Data Science
- B.S. in Information Technology
- B.S. in Mathematics
- B.S. in Physical Education and Recreation
- B.S. in Public Health
- B.S. in Risk Management and Insurance
- General Education
- Honors Program
- Peace Corps Prep program
- Self-Directed Major
- M.A. in Counseling: Clinical Mental Health Counseling
- M.A. in Counseling: School Counseling
- M.A. in Deaf Education
- M.A. in Deaf Education Studies
- M.A. in Deaf Studies: Cultural Studies
- M.A. in Deaf Studies: Language and Human Rights
- M.A. in Early Childhood Education and Deaf Education
- M.A. in Early Intervention Studies
- M.A. in Elementary Education and Deaf Education
- M.A. in International Development
- M.A. in Interpretation: Combined Interpreting Practice and Research
- M.A. in Interpretation: Interpreting Research
- M.A. in Linguistics
- M.A. in Secondary Education and Deaf Education
- M.A. in Sign Language Education
- M.S. in Accessible Human-Centered Computing
- M.S. in Speech-Language Pathology
- Master of Public Administration
- Master of Social Work (MSW)
- Au.D. in Audiology
- Ed.D. in Transformational Leadership and Administration in Deaf Education
- Ph.D. in Clinical Psychology
- Ph.D. in Critical Studies in the Education of Deaf Learners
- Ph.D. in Hearing, Speech, and Language Sciences
- Ph.D. in Linguistics
- Ph.D. in Translation and Interpreting Studies
- Ph.D. Program in Educational Neuroscience (PEN)
- Psy.D. in School Psychology
- Individual Courses and Training
- National Caregiver Certification Course
- CASLI Test Prep Courses
- Course Sections
- Certificates
- Certificate in Sexuality and Gender Studies
- Educating Deaf Students with Disabilities (online, post-bachelor’s)
- American Sign Language and English Bilingual Early Childhood Deaf Education
- Early Intervention Studies
- Online Degree Programs
- ODCP Minor in Communication Studies
- ODCP Minor in Deaf Studies
- ODCP Minor in Psychology
- ODCP Minor in Writing
- University Capstone Honors for Online Degree Completion Program
Quick Links
- PK-12 & Outreach
- NSO Schedule

Words that introduce Quotes or Paraphrases
202.448-7036
Remember that you are required to cite your sources for paraphrases and direct quotes. For more information on MLA Style, APA style, Chicago Style, ASA Style, CSE Style, and I-Search Format, refer to our Gallaudet TIP Citations and References link.
Words that introduce Quotes or Paraphrases are basically three keys verbs:
- Neutral Verbs( here )
- Stronger Verbs( here )
- Inference Verbs( here )
Neutral Verbs: When used to introduce a quote, the following verbs basically mean “says”
Examples of Neutral Verbs
The author says. The author notes. The author believes. The author observes. The author comments. The author relates. The author declares. The author remarks. The author discusses. The author reports. The author explains. The author reveals. The author expresses. The author states. The author mentions. The author acknowledges. The author suggests. The author thinks. The author points out. The author responds. The author shows. The author confirms.
Sample Sentences
- Dr. Billow says that being exposed to television violence at a young age desensitizes children to violence in real life (author’s last name p.##).
- As the author notes , “In an ideal classroom, both gifted children and learning disabled children should feel challenged” (p.##).
- Burdow believes that being able to write using proper English grammar is an important skill (author’s last name p.##).
- Dr. Patel observes that “most people tend to respond well to hypnotherapy” (p. ##).
- We see this self doubt again in the second scene, when Agatha comments , “Oh, times like this I just don’t know whether I am right or wrong, good or bad” (p. ##).
- Goeff then relates that his childhood was “the time he learned to live on less than bread alone” (p. ##).
- The author declares , “All people, rich or poor, should pay the same taxes to the government” (p. ##).
- Godfried remarks , “Ignorance is a skill learned by many of the greatest fools” (author’s last name p.##).
- The article discusses the qualities of a good American housewife in the 1950s (author’s last name p.##).
- After the war is over, the General reports that “It seemed a useless battle to fight even from the start” (p.##).
- Danelli explains , “All mammals have hair” (p.##).
- The author reveals his true feelings with his ironic remark that we should “just resort to cannibalism to defeat world hunger” (p. ##).
- Forton expresses disapproval of the American welfare system (author’s last name, year, p. ##).
- The author states that “More than fifty percent of all marriages end in divorce” (p. ##).
- He also mentions , “Many children grow up feeling responsible for their parents’ mistakes” (p. ##).
- Jones acknowledges that although the divorce rate is increasing, most young children still dream of getting married (author’s last name, year, p. ##).
- The author suggests that we hone our English skills before venturing into the work force (author’s last name, year, p. ##).
- The author thinks that the recent weather has been too hot (author’s last name, year, p. ##).
- Folsh points out that there were hundreds of people from varying backgrounds at the convention (author’s last name, year, p. ##).
- Julia Hertz responded to allegations that her company was aware of the faulty tires on their cars (author’s last name, year, p. ##).
- His research shows that 7% of Americans suffer from Social Anxiety Disorder (author’s last name, year, p. ##).
- Jostin’s research confirmed his earlier hypothesis: mice really are smarter than rats (author’s last, year, name p. ##).
Stronger Verbs: These verbs indicate that there is some kind of argument, and that the quote shows either support of or disagreement with one side of the argument.
Examples of Stronger Verbs The author agrees . . .The author rejects . The author argues . The author compares . (the two studies) The author asserts . The author admits . The author cautions . The author disputes . The author emphasizes . The author contends . The author insists . The author denies . The author maintains . The author refutes . The author claims . The author endorses .
Sample Sentences MLA Style
- Despite criticism, Johnston agrees that smoking should be banned in all public places (author’s last name p.##).
- The author argues that “subjecting non-smokers to toxic second-hand smoke is not only unfair, but a violation of their right to a safe environment” (p.##).
- Vick asserts that “cigarette smoke is unpleasant, and dangerous” (p.##).
- The author cautions that “people who subject themselves to smoky bars night after night could develop illnesses such as emphysema or lung cancer” (p.##).
- Rosentrhaw emphasizes that “second-hand smoke can kill” (p.##).
- Still, tobacco company executives insist that they “were not fully aware of the long term damages caused by smoking” when they launched their nationwide advertising campaign (author’s last name p.##).
- Though bar owners disagree, Johnston maintains that banning smoking in all public places will not negatively affect bar business (author’s last name p.##).
- Jefferson claims that banning smoking in public places will hurt America’s economy (author’s last name p.##).
- Johnson refutes allegations that his personal finances have been in trouble for the past five years (author’s last name, year, p. ##).
- Whiley rejects the idea that the earth could have been formed by a massive explosion in space (author’s last name, year, p. ##).
- Lucci compares the house prices in Maryland, Virginia, and the District of Columbia (author’s last name, year, p. ##).
- Although they have stopped short of admitting that smoking causes cancer in humans, tobacco companies have admitted that “smoking causes cancer in laboratory rats” (p. ##).
- For years, local residents have been disputing the plans to build a new highway right through the center of town (author’s last name, year, p. ##).
- Residents contend that the new highway will lower property values (author’s last name, year, p. ##).
- The Department of Transportation denies claims that the new bridge will damage the fragile ecosystem of the Potomac River (author’s last name, year, p. ##).
- Joley endorses the bridge, saying “our goal is to make this city more accessible to those who live outside of it” (p. ##).
Inference Verbs: These verbs indicate that there is some kind of argument, and that the quote shows either support of or disagreement with one side of the argument. Examples of Inference Verbs The author implies . The author suggests . The author thinks . Sample Sentences MLA Style
- By calling them ignorant, the author implies that they were unschooled and narrow minded (author’s last name p.##).
- Her preoccupation with her looks suggests that she is too superficial to make her a believable character (author’s last name p.##).
- Based on his research, we can assume Hatfield thinks that our treatment of our environment has been careless (author’s last name p.##).
One phrase that is often used to introduce a quotation is: According to the author, . . .
- According to the author, children with ADD have a shorter attention span than children without ADD (author’s last name, year, p. ##).
202-448-7036
At a Glance
- Quick Facts
- University Leadership
- History & Traditions
- Accreditation
- Consumer Information
- Our 10-Year Vision: The Gallaudet Promise
- Annual Report of Achievements (ARA)
- The Signing Ecosystem
- Not Your Average University
Our Community
- Library & Archives
- Technology Support
- Interpreting Requests
- Ombuds Support
- Health and Wellness Programs
- Profile & Web Edits
Visit Gallaudet
- Explore Our Campus
- Virtual Tour
- Maps & Directions
- Shuttle Bus Schedule
- Kellogg Conference Hotel
- Welcome Center
- National Deaf Life Museum
- Apple Guide Maps
Engage Today
- Work at Gallaudet / Clerc Center
- Social Media Channels
- University Wide Events
- Sponsorship Requests
- Data Requests
- Media Inquiries
- Gallaudet Today Magazine
- Giving at Gallaudet
- Financial Aid
- Registrar’s Office
- Residence Life & Housing
- Safety & Security
- Undergraduate Admissions
- Graduate Admissions
- University Communications
- Clerc Center
Gallaudet University, chartered in 1864, is a private university for deaf and hard of hearing students.
Copyright © 2024 Gallaudet University. All rights reserved.
- Accessibility
- Cookie Consent Notice
- Privacy Policy
- File a Report
800 Florida Avenue NE, Washington, D.C. 20002
Have a language expert improve your writing
Run a free plagiarism check in 10 minutes, generate accurate citations for free.
- Knowledge Base
- How to write an essay introduction | 4 steps & examples
How to Write an Essay Introduction | 4 Steps & Examples
Published on February 4, 2019 by Shona McCombes . Revised on July 23, 2023.
A good introduction paragraph is an essential part of any academic essay . It sets up your argument and tells the reader what to expect.
The main goals of an introduction are to:
- Catch your reader’s attention.
- Give background on your topic.
- Present your thesis statement —the central point of your essay.
This introduction example is taken from our interactive essay example on the history of Braille.
The invention of Braille was a major turning point in the history of disability. The writing system of raised dots used by visually impaired people was developed by Louis Braille in nineteenth-century France. In a society that did not value disabled people in general, blindness was particularly stigmatized, and lack of access to reading and writing was a significant barrier to social participation. The idea of tactile reading was not entirely new, but existing methods based on sighted systems were difficult to learn and use. As the first writing system designed for blind people’s needs, Braille was a groundbreaking new accessibility tool. It not only provided practical benefits, but also helped change the cultural status of blindness. This essay begins by discussing the situation of blind people in nineteenth-century Europe. It then describes the invention of Braille and the gradual process of its acceptance within blind education. Subsequently, it explores the wide-ranging effects of this invention on blind people’s social and cultural lives.
Instantly correct all language mistakes in your text
Upload your document to correct all your mistakes in minutes

Table of contents
Step 1: hook your reader, step 2: give background information, step 3: present your thesis statement, step 4: map your essay’s structure, step 5: check and revise, more examples of essay introductions, other interesting articles, frequently asked questions about the essay introduction.
Your first sentence sets the tone for the whole essay, so spend some time on writing an effective hook.
Avoid long, dense sentences—start with something clear, concise and catchy that will spark your reader’s curiosity.
The hook should lead the reader into your essay, giving a sense of the topic you’re writing about and why it’s interesting. Avoid overly broad claims or plain statements of fact.
Examples: Writing a good hook
Take a look at these examples of weak hooks and learn how to improve them.
- Braille was an extremely important invention.
- The invention of Braille was a major turning point in the history of disability.
The first sentence is a dry fact; the second sentence is more interesting, making a bold claim about exactly why the topic is important.
- The internet is defined as “a global computer network providing a variety of information and communication facilities.”
- The spread of the internet has had a world-changing effect, not least on the world of education.
Avoid using a dictionary definition as your hook, especially if it’s an obvious term that everyone knows. The improved example here is still broad, but it gives us a much clearer sense of what the essay will be about.
- Mary Shelley’s Frankenstein is a famous book from the nineteenth century.
- Mary Shelley’s Frankenstein is often read as a crude cautionary tale about the dangers of scientific advancement.
Instead of just stating a fact that the reader already knows, the improved hook here tells us about the mainstream interpretation of the book, implying that this essay will offer a different interpretation.
Receive feedback on language, structure, and formatting
Professional editors proofread and edit your paper by focusing on:
- Academic style
- Vague sentences
- Style consistency
See an example

Next, give your reader the context they need to understand your topic and argument. Depending on the subject of your essay, this might include:
- Historical, geographical, or social context
- An outline of the debate you’re addressing
- A summary of relevant theories or research about the topic
- Definitions of key terms
The information here should be broad but clearly focused and relevant to your argument. Don’t give too much detail—you can mention points that you will return to later, but save your evidence and interpretation for the main body of the essay.
How much space you need for background depends on your topic and the scope of your essay. In our Braille example, we take a few sentences to introduce the topic and sketch the social context that the essay will address:
Now it’s time to narrow your focus and show exactly what you want to say about the topic. This is your thesis statement —a sentence or two that sums up your overall argument.
This is the most important part of your introduction. A good thesis isn’t just a statement of fact, but a claim that requires evidence and explanation.
The goal is to clearly convey your own position in a debate or your central point about a topic.
Particularly in longer essays, it’s helpful to end the introduction by signposting what will be covered in each part. Keep it concise and give your reader a clear sense of the direction your argument will take.
Here's why students love Scribbr's proofreading services
Discover proofreading & editing
As you research and write, your argument might change focus or direction as you learn more.
For this reason, it’s often a good idea to wait until later in the writing process before you write the introduction paragraph—it can even be the very last thing you write.
When you’ve finished writing the essay body and conclusion , you should return to the introduction and check that it matches the content of the essay.
It’s especially important to make sure your thesis statement accurately represents what you do in the essay. If your argument has gone in a different direction than planned, tweak your thesis statement to match what you actually say.
To polish your writing, you can use something like a paraphrasing tool .
You can use the checklist below to make sure your introduction does everything it’s supposed to.
Checklist: Essay introduction
My first sentence is engaging and relevant.
I have introduced the topic with necessary background information.
I have defined any important terms.
My thesis statement clearly presents my main point or argument.
Everything in the introduction is relevant to the main body of the essay.
You have a strong introduction - now make sure the rest of your essay is just as good.
- Argumentative
- Literary analysis
This introduction to an argumentative essay sets up the debate about the internet and education, and then clearly states the position the essay will argue for.
The spread of the internet has had a world-changing effect, not least on the world of education. The use of the internet in academic contexts is on the rise, and its role in learning is hotly debated. For many teachers who did not grow up with this technology, its effects seem alarming and potentially harmful. This concern, while understandable, is misguided. The negatives of internet use are outweighed by its critical benefits for students and educators—as a uniquely comprehensive and accessible information source; a means of exposure to and engagement with different perspectives; and a highly flexible learning environment.
This introduction to a short expository essay leads into the topic (the invention of the printing press) and states the main point the essay will explain (the effect of this invention on European society).
In many ways, the invention of the printing press marked the end of the Middle Ages. The medieval period in Europe is often remembered as a time of intellectual and political stagnation. Prior to the Renaissance, the average person had very limited access to books and was unlikely to be literate. The invention of the printing press in the 15th century allowed for much less restricted circulation of information in Europe, paving the way for the Reformation.
This introduction to a literary analysis essay , about Mary Shelley’s Frankenstein , starts by describing a simplistic popular view of the story, and then states how the author will give a more complex analysis of the text’s literary devices.
Mary Shelley’s Frankenstein is often read as a crude cautionary tale. Arguably the first science fiction novel, its plot can be read as a warning about the dangers of scientific advancement unrestrained by ethical considerations. In this reading, and in popular culture representations of the character as a “mad scientist”, Victor Frankenstein represents the callous, arrogant ambition of modern science. However, far from providing a stable image of the character, Shelley uses shifting narrative perspectives to gradually transform our impression of Frankenstein, portraying him in an increasingly negative light as the novel goes on. While he initially appears to be a naive but sympathetic idealist, after the creature’s narrative Frankenstein begins to resemble—even in his own telling—the thoughtlessly cruel figure the creature represents him as.
If you want to know more about AI tools , college essays , or fallacies make sure to check out some of our other articles with explanations and examples or go directly to our tools!
- Ad hominem fallacy
- Post hoc fallacy
- Appeal to authority fallacy
- False cause fallacy
- Sunk cost fallacy
College essays
- Choosing Essay Topic
- Write a College Essay
- Write a Diversity Essay
- College Essay Format & Structure
- Comparing and Contrasting in an Essay
(AI) Tools
- Grammar Checker
- Paraphrasing Tool
- Text Summarizer
- AI Detector
- Plagiarism Checker
- Citation Generator
Your essay introduction should include three main things, in this order:
- An opening hook to catch the reader’s attention.
- Relevant background information that the reader needs to know.
- A thesis statement that presents your main point or argument.
The length of each part depends on the length and complexity of your essay .
The “hook” is the first sentence of your essay introduction . It should lead the reader into your essay, giving a sense of why it’s interesting.
To write a good hook, avoid overly broad statements or long, dense sentences. Try to start with something clear, concise and catchy that will spark your reader’s curiosity.
A thesis statement is a sentence that sums up the central point of your paper or essay . Everything else you write should relate to this key idea.
The thesis statement is essential in any academic essay or research paper for two main reasons:
- It gives your writing direction and focus.
- It gives the reader a concise summary of your main point.
Without a clear thesis statement, an essay can end up rambling and unfocused, leaving your reader unsure of exactly what you want to say.
The structure of an essay is divided into an introduction that presents your topic and thesis statement , a body containing your in-depth analysis and arguments, and a conclusion wrapping up your ideas.
The structure of the body is flexible, but you should always spend some time thinking about how you can organize your essay to best serve your ideas.
Cite this Scribbr article
If you want to cite this source, you can copy and paste the citation or click the “Cite this Scribbr article” button to automatically add the citation to our free Citation Generator.
McCombes, S. (2023, July 23). How to Write an Essay Introduction | 4 Steps & Examples. Scribbr. Retrieved September 27, 2024, from https://www.scribbr.com/academic-essay/introduction/
Is this article helpful?

Shona McCombes
Other students also liked, how to write a thesis statement | 4 steps & examples, academic paragraph structure | step-by-step guide & examples, how to conclude an essay | interactive example, get unlimited documents corrected.
✔ Free APA citation check included ✔ Unlimited document corrections ✔ Specialized in correcting academic texts

Introductions
What this handout is about.
This handout will explain the functions of introductions, offer strategies for creating effective introductions, and provide some examples of less effective introductions to avoid.
The role of introductions
Introductions and conclusions can be the most difficult parts of papers to write. Usually when you sit down to respond to an assignment, you have at least some sense of what you want to say in the body of your paper. You might have chosen a few examples you want to use or have an idea that will help you answer the main question of your assignment; these sections, therefore, may not be as hard to write. And it’s fine to write them first! But in your final draft, these middle parts of the paper can’t just come out of thin air; they need to be introduced and concluded in a way that makes sense to your reader.
Your introduction and conclusion act as bridges that transport your readers from their own lives into the “place” of your analysis. If your readers pick up your paper about education in the autobiography of Frederick Douglass, for example, they need a transition to help them leave behind the world of Chapel Hill, television, e-mail, and The Daily Tar Heel and to help them temporarily enter the world of nineteenth-century American slavery. By providing an introduction that helps your readers make a transition between their own world and the issues you will be writing about, you give your readers the tools they need to get into your topic and care about what you are saying. Similarly, once you’ve hooked your readers with the introduction and offered evidence to prove your thesis, your conclusion can provide a bridge to help your readers make the transition back to their daily lives. (See our handout on conclusions .)
Note that what constitutes a good introduction may vary widely based on the kind of paper you are writing and the academic discipline in which you are writing it. If you are uncertain what kind of introduction is expected, ask your instructor.
Why bother writing a good introduction?
You never get a second chance to make a first impression. The opening paragraph of your paper will provide your readers with their initial impressions of your argument, your writing style, and the overall quality of your work. A vague, disorganized, error-filled, off-the-wall, or boring introduction will probably create a negative impression. On the other hand, a concise, engaging, and well-written introduction will start your readers off thinking highly of you, your analytical skills, your writing, and your paper.
Your introduction is an important road map for the rest of your paper. Your introduction conveys a lot of information to your readers. You can let them know what your topic is, why it is important, and how you plan to proceed with your discussion. In many academic disciplines, your introduction should contain a thesis that will assert your main argument. Your introduction should also give the reader a sense of the kinds of information you will use to make that argument and the general organization of the paragraphs and pages that will follow. After reading your introduction, your readers should not have any major surprises in store when they read the main body of your paper.
Ideally, your introduction will make your readers want to read your paper. The introduction should capture your readers’ interest, making them want to read the rest of your paper. Opening with a compelling story, an interesting question, or a vivid example can get your readers to see why your topic matters and serve as an invitation for them to join you for an engaging intellectual conversation (remember, though, that these strategies may not be suitable for all papers and disciplines).
Strategies for writing an effective introduction
Start by thinking about the question (or questions) you are trying to answer. Your entire essay will be a response to this question, and your introduction is the first step toward that end. Your direct answer to the assigned question will be your thesis, and your thesis will likely be included in your introduction, so it is a good idea to use the question as a jumping off point. Imagine that you are assigned the following question:
Drawing on the Narrative of the Life of Frederick Douglass , discuss the relationship between education and slavery in 19th-century America. Consider the following: How did white control of education reinforce slavery? How did Douglass and other enslaved African Americans view education while they endured slavery? And what role did education play in the acquisition of freedom? Most importantly, consider the degree to which education was or was not a major force for social change with regard to slavery.
You will probably refer back to your assignment extensively as you prepare your complete essay, and the prompt itself can also give you some clues about how to approach the introduction. Notice that it starts with a broad statement and then narrows to focus on specific questions from the book. One strategy might be to use a similar model in your own introduction—start off with a big picture sentence or two and then focus in on the details of your argument about Douglass. Of course, a different approach could also be very successful, but looking at the way the professor set up the question can sometimes give you some ideas for how you might answer it. (See our handout on understanding assignments for additional information on the hidden clues in assignments.)
Decide how general or broad your opening should be. Keep in mind that even a “big picture” opening needs to be clearly related to your topic; an opening sentence that said “Human beings, more than any other creatures on earth, are capable of learning” would be too broad for our sample assignment about slavery and education. If you have ever used Google Maps or similar programs, that experience can provide a helpful way of thinking about how broad your opening should be. Imagine that you’re researching Chapel Hill. If what you want to find out is whether Chapel Hill is at roughly the same latitude as Rome, it might make sense to hit that little “minus” sign on the online map until it has zoomed all the way out and you can see the whole globe. If you’re trying to figure out how to get from Chapel Hill to Wrightsville Beach, it might make more sense to zoom in to the level where you can see most of North Carolina (but not the rest of the world, or even the rest of the United States). And if you are looking for the intersection of Ridge Road and Manning Drive so that you can find the Writing Center’s main office, you may need to zoom all the way in. The question you are asking determines how “broad” your view should be. In the sample assignment above, the questions are probably at the “state” or “city” level of generality. When writing, you need to place your ideas in context—but that context doesn’t generally have to be as big as the whole galaxy!
Try writing your introduction last. You may think that you have to write your introduction first, but that isn’t necessarily true, and it isn’t always the most effective way to craft a good introduction. You may find that you don’t know precisely what you are going to argue at the beginning of the writing process. It is perfectly fine to start out thinking that you want to argue a particular point but wind up arguing something slightly or even dramatically different by the time you’ve written most of the paper. The writing process can be an important way to organize your ideas, think through complicated issues, refine your thoughts, and develop a sophisticated argument. However, an introduction written at the beginning of that discovery process will not necessarily reflect what you wind up with at the end. You will need to revise your paper to make sure that the introduction, all of the evidence, and the conclusion reflect the argument you intend. Sometimes it’s easiest to just write up all of your evidence first and then write the introduction last—that way you can be sure that the introduction will match the body of the paper.
Don’t be afraid to write a tentative introduction first and then change it later. Some people find that they need to write some kind of introduction in order to get the writing process started. That’s fine, but if you are one of those people, be sure to return to your initial introduction later and rewrite if necessary.
Open with something that will draw readers in. Consider these options (remembering that they may not be suitable for all kinds of papers):
- an intriguing example —for example, Douglass writes about a mistress who initially teaches him but then ceases her instruction as she learns more about slavery.
- a provocative quotation that is closely related to your argument —for example, Douglass writes that “education and slavery were incompatible with each other.” (Quotes from famous people, inspirational quotes, etc. may not work well for an academic paper; in this example, the quote is from the author himself.)
- a puzzling scenario —for example, Frederick Douglass says of slaves that “[N]othing has been left undone to cripple their intellects, darken their minds, debase their moral nature, obliterate all traces of their relationship to mankind; and yet how wonderfully they have sustained the mighty load of a most frightful bondage, under which they have been groaning for centuries!” Douglass clearly asserts that slave owners went to great lengths to destroy the mental capacities of slaves, yet his own life story proves that these efforts could be unsuccessful.
- a vivid and perhaps unexpected anecdote —for example, “Learning about slavery in the American history course at Frederick Douglass High School, students studied the work slaves did, the impact of slavery on their families, and the rules that governed their lives. We didn’t discuss education, however, until one student, Mary, raised her hand and asked, ‘But when did they go to school?’ That modern high school students could not conceive of an American childhood devoid of formal education speaks volumes about the centrality of education to American youth today and also suggests the significance of the deprivation of education in past generations.”
- a thought-provoking question —for example, given all of the freedoms that were denied enslaved individuals in the American South, why does Frederick Douglass focus his attentions so squarely on education and literacy?
Pay special attention to your first sentence. Start off on the right foot with your readers by making sure that the first sentence actually says something useful and that it does so in an interesting and polished way.
How to evaluate your introduction draft
Ask a friend to read your introduction and then tell you what they expect the paper will discuss, what kinds of evidence the paper will use, and what the tone of the paper will be. If your friend is able to predict the rest of your paper accurately, you probably have a good introduction.
Five kinds of less effective introductions
1. The placeholder introduction. When you don’t have much to say on a given topic, it is easy to create this kind of introduction. Essentially, this kind of weaker introduction contains several sentences that are vague and don’t really say much. They exist just to take up the “introduction space” in your paper. If you had something more effective to say, you would probably say it, but in the meantime this paragraph is just a place holder.
Example: Slavery was one of the greatest tragedies in American history. There were many different aspects of slavery. Each created different kinds of problems for enslaved people.
2. The restated question introduction. Restating the question can sometimes be an effective strategy, but it can be easy to stop at JUST restating the question instead of offering a more specific, interesting introduction to your paper. The professor or teaching assistant wrote your question and will be reading many essays in response to it—they do not need to read a whole paragraph that simply restates the question.
Example: The Narrative of the Life of Frederick Douglass discusses the relationship between education and slavery in 19th century America, showing how white control of education reinforced slavery and how Douglass and other enslaved African Americans viewed education while they endured. Moreover, the book discusses the role that education played in the acquisition of freedom. Education was a major force for social change with regard to slavery.
3. The Webster’s Dictionary introduction. This introduction begins by giving the dictionary definition of one or more of the words in the assigned question. Anyone can look a word up in the dictionary and copy down what Webster says. If you want to open with a discussion of an important term, it may be far more interesting for you (and your reader) if you develop your own definition of the term in the specific context of your class and assignment. You may also be able to use a definition from one of the sources you’ve been reading for class. Also recognize that the dictionary is also not a particularly authoritative work—it doesn’t take into account the context of your course and doesn’t offer particularly detailed information. If you feel that you must seek out an authority, try to find one that is very relevant and specific. Perhaps a quotation from a source reading might prove better? Dictionary introductions are also ineffective simply because they are so overused. Instructors may see a great many papers that begin in this way, greatly decreasing the dramatic impact that any one of those papers will have.
Example: Webster’s dictionary defines slavery as “the state of being a slave,” as “the practice of owning slaves,” and as “a condition of hard work and subjection.”
4. The “dawn of man” introduction. This kind of introduction generally makes broad, sweeping statements about the relevance of this topic since the beginning of time, throughout the world, etc. It is usually very general (similar to the placeholder introduction) and fails to connect to the thesis. It may employ cliches—the phrases “the dawn of man” and “throughout human history” are examples, and it’s hard to imagine a time when starting with one of these would work. Instructors often find them extremely annoying.
Example: Since the dawn of man, slavery has been a problem in human history.
5. The book report introduction. This introduction is what you had to do for your elementary school book reports. It gives the name and author of the book you are writing about, tells what the book is about, and offers other basic facts about the book. You might resort to this sort of introduction when you are trying to fill space because it’s a familiar, comfortable format. It is ineffective because it offers details that your reader probably already knows and that are irrelevant to the thesis.
Example: Frederick Douglass wrote his autobiography, Narrative of the Life of Frederick Douglass, An American Slave , in the 1840s. It was published in 1986 by Penguin Books. In it, he tells the story of his life.
And now for the conclusion…
Writing an effective introduction can be tough. Try playing around with several different options and choose the one that ends up sounding best to you!
Just as your introduction helps readers make the transition to your topic, your conclusion needs to help them return to their daily lives–but with a lasting sense of how what they have just read is useful or meaningful. Check out our handout on conclusions for tips on ending your paper as effectively as you began it!
Works consulted
We consulted these works while writing this handout. This is not a comprehensive list of resources on the handout’s topic, and we encourage you to do your own research to find additional publications. Please do not use this list as a model for the format of your own reference list, as it may not match the citation style you are using. For guidance on formatting citations, please see the UNC Libraries citation tutorial . We revise these tips periodically and welcome feedback.
Douglass, Frederick. 1995. Narrative of the Life of Frederick Douglass, an American Slave, Written by Himself . New York: Dover.
You may reproduce it for non-commercial use if you use the entire handout and attribute the source: The Writing Center, University of North Carolina at Chapel Hill
Make a Gift
Quoting and integrating sources into your paper
In any study of a subject, people engage in a “conversation” of sorts, where they read or listen to others’ ideas, consider them with their own viewpoints, and then develop their own stance. It is important in this “conversation” to acknowledge when we use someone else’s words or ideas. If we didn’t come up with it ourselves, we need to tell our readers who did come up with it.
It is important to draw on the work of experts to formulate your own ideas. Quoting and paraphrasing the work of authors engaged in writing about your topic adds expert support to your argument and thesis statement. You are contributing to a scholarly conversation with scholars who are experts on your topic with your writing. This is the difference between a scholarly research paper and any other paper: you must include your own voice in your analysis and ideas alongside scholars or experts.
All your sources must relate to your thesis, or central argument, whether they are in agreement or not. It is a good idea to address all sides of the argument or thesis to make your stance stronger. There are two main ways to incorporate sources into your research paper.
Quoting is when you use the exact words from a source. You will need to put quotation marks around the words that are not your own and cite where they came from. For example:
“It wasn’t really a tune, but from the first note the beast’s eyes began to droop . . . Slowly the dog’s growls ceased – it tottered on its paws and fell to its knees, then it slumped to the ground, fast asleep” (Rowling 275).
Follow these guidelines when opting to cite a passage:
- Choose to quote passages that seem especially well phrased or are unique to the author or subject matter.
- Be selective in your quotations. Avoid over-quoting. You also don’t have to quote an entire passage. Use ellipses (. . .) to indicate omitted words. Check with your professor for their ideal length of quotations – some professors place word limits on how much of a sentence or paragraph you should quote.
- Before or after quoting a passage, include an explanation in which you interpret the significance of the quote for the reader. Avoid “hanging quotes” that have no context or introduction. It is better to err on the side of your reader not understanding your point until you spell it out for them, rather than assume readers will follow your thought process exactly.
- If you are having trouble paraphrasing (putting something into your own words), that may be a sign that you should quote it.
- Shorter quotes are generally incorporated into the flow of a sentence while longer quotes may be set off in “blocks.” Check your citation handbook for quoting guidelines.
Paraphrasing is when you state the ideas from another source in your own words . Even when you use your own words, if the ideas or facts came from another source, you need to cite where they came from. Quotation marks are not used. For example:
With the simple music of the flute, Harry lulled the dog to sleep (Rowling 275).
Follow these guidelines when opting to paraphrase a passage:
- Don’t take a passage and change a word here or there. You must write out the idea in your own words. Simply changing a few words from the original source or restating the information exactly using different words is considered plagiarism .
- Read the passage, reflect upon it, and restate it in a way that is meaningful to you within the context of your paper . You are using this to back up a point you are making, so your paraphrased content should be tailored to that point specifically.
- After reading the passage that you want to paraphrase, look away from it, and imagine explaining the main point to another person.
- After paraphrasing the passage, go back and compare it to the original. Are there any phrases that have come directly from the original source? If so, you should rephrase it or put the original in quotation marks. If you cannot state an idea in your own words, you should use the direct quotation.
A summary is similar to paraphrasing, but used in cases where you are trying to give an overview of many ideas. As in paraphrasing, quotation marks are not used, but a citation is still necessary. For example:
Through a combination of skill and their invisibility cloak, Harry, Ron, and Hermione slipped through Hogwarts to the dog’s room and down through the trapdoor within (Rowling 271-77).
Important guidelines
When integrating a source into your paper, remember to use these three important components:
- Introductory phrase to the source material : mention the author, date, or any other relevant information when introducing a quote or paraphrase.
- Source material : a direct quote, paraphrase, or summary with proper citation.
- Analysis of source material : your response, interpretations, or arguments regarding the source material should introduce or follow it. When incorporating source material into your paper, relate your source and analysis back to your original thesis.
Ideally, papers will contain a good balance of direct quotations, paraphrasing and your own thoughts. Too much reliance on quotations and paraphrasing can make it seem like you are only using the work of others and have no original thoughts on the topic.
Always properly cite an author’s original idea, whether you have directly quoted or paraphrased it. If you have questions about how to cite properly in your chosen citation style, browse these citation guides . You can also review our guide to understanding plagiarism .
University Writing Center
The University of Nevada, Reno Writing Center provides helpful guidance on quoting and paraphrasing and explains how to make sure your paraphrasing does not veer into plagiarism. If you have any questions about quoting or paraphrasing, or need help at any point in the writing process, schedule an appointment with the Writing Center.
Works Cited
Rowling, J.K. Harry Potter and the Sorcerer's Stone. A.A. Levine Books, 1998.
- PRO Courses Guides New Tech Help Pro Expert Videos About wikiHow Pro Upgrade Sign In
- EDIT Edit this Article
- EXPLORE Tech Help Pro About Us Random Article Quizzes Request a New Article Community Dashboard This Or That Game Happiness Hub Popular Categories Arts and Entertainment Artwork Books Movies Computers and Electronics Computers Phone Skills Technology Hacks Health Men's Health Mental Health Women's Health Relationships Dating Love Relationship Issues Hobbies and Crafts Crafts Drawing Games Education & Communication Communication Skills Personal Development Studying Personal Care and Style Fashion Hair Care Personal Hygiene Youth Personal Care School Stuff Dating All Categories Arts and Entertainment Finance and Business Home and Garden Relationship Quizzes Cars & Other Vehicles Food and Entertaining Personal Care and Style Sports and Fitness Computers and Electronics Health Pets and Animals Travel Education & Communication Hobbies and Crafts Philosophy and Religion Work World Family Life Holidays and Traditions Relationships Youth
- Browse Articles
- Learn Something New
- Quizzes Hot
- Happiness Hub
- This Or That Game
- Train Your Brain
- Explore More
- Support wikiHow
- About wikiHow
- Log in / Sign up
- Education and Communications
- Technical Writing
How to Lead Into a Quote
Last Updated: January 11, 2023 Fact Checked
This article was co-authored by Lynn Kirkham . Lynn Kirkham is a Professional Public Speaker and Founder of Yes You Can Speak, a San Francisco Bay Area-based public speaking educational business empowering thousands of professionals to take command of whatever stage they've been given - from job interviews, boardroom talks to TEDx and large conference platforms. Lynn was chosen as the official TEDx Berkeley speaker coach for the last four years and has worked with executives at Google, Facebook, Intuit, Genentech, Intel, VMware, and others. This article has been fact-checked, ensuring the accuracy of any cited facts and confirming the authority of its sources. This article has been viewed 86,333 times.
Introducing a quote in a paper can be tricky, as you want the quote to feel seamless and relevant to your topic. You may want to use a quote from a literary text to support your ideas in an essay, or as evidence in your research paper. The key to using quotes effectively is to always use a lead-in or introduction to the quote. Try using an introductory phrase or verb to lead into the quote. You can also use your own assertions to introduce the quote in the text.
Leading With an Introductory Phrase or Verb

- According to Smith, “Life is beautiful.”
- In Smith's view, “Life is beautiful.”
- In Smith's words, “Life is beautiful.”

- Do not use “says” as a descriptive verb to introduce a quote, unless you are quoting from an interview.
- Arendt remarks, “Even in the darkest of times, we have the right to expect some illumination.”
- Arendt states, “Even in the darkest of times, we have the right to expect some illumination.”

- Arendt points out that “totalitarianism is to be feared.”
- Arendt emphasizes that “totalitarianism is to be feared.”
- Arendt describes her book as “an exploration of power.”
Leading with Your Own Assertion

- For example, you may write an assertion like, “Arendt does not see totalitarianism as a positive result of war.”
- Or you may write an assertion like, “Hamlet argues against Rosencrantz's claim that he lacks ambition.”

- Arendt does not see totalitarianism as a positive result of war: “Totalitarianism is to be feared and loathed.”
- Hamlet argues against Rosencrantz's claim that he lacks ambition: "I could be bounded in a nutshell and count myself a king of infinite space.”

- For Arendt, state sanctioned propaganda was essential totalitarian regimes, where “one could make people believe the most fantastic statements,” thereby confirming the state's power over its citizens.
- Hamlet is doubtful of Rosencrantz's view, claiming he could be “bounded in a nutshell” and still feel powerful, “a king of infinite space.”
Polishing the Lead-In

- You can also look at your use of quotes throughout the paper to confirm they flow well. Make sure you are consistent with how you introduce quotes in the paper. Use one to two different ways to introduce quotes and stick to them so the reader can follow your train of thought.

- You should also check that you italicize any titles in the lead-in. Capitalize any author names or titles in the lead-in, as well.

- Place the citation at the end of the quote, if you are using in quote citations.
- Arendt does not see totalitarianism as a positive result of war: “Totalitarianism is to be feared and loathed” ( On Totalitarianism , 54).
- Hamlet is doubtful of Rosencrantz's view, claiming he could be “bounded in a nutshell” and still feel powerful, “a king of infinite space” ( Hamlet , 2.2).
Community Q&A

You Might Also Like

- ↑ https://www.ccis.edu/offices/academicresources/writingcenter/essaywritingassistance/suggestedwaystointroducequotations.aspx
- ↑ http://writingcenter.unc.edu/handouts/quotations/
- ↑ https://writing.wisc.edu/handbook/assignments/quoliterature/
- ↑ https://www.albright.edu/wp-content/uploads/2020/11/Adding-Lead-Ins-Before-a-Quote.pdf
- ↑ https://owl.purdue.edu/owl/research_and_citation/using_research/quoting_paraphrasing_and_summarizing/signal_and_lead_in_phrases.html
About This Article

- Send fan mail to authors
Reader Success Stories
Did this article help you?

Featured Articles

Trending Articles

Watch Articles

- Terms of Use
- Privacy Policy
- Do Not Sell or Share My Info
- Not Selling Info
Get all the best how-tos!
Sign up for wikiHow's weekly email newsletter
Purdue Online Writing Lab Purdue OWL® College of Liberal Arts
MLA Sample Paper

Welcome to the Purdue OWL
This page is brought to you by the OWL at Purdue University. When printing this page, you must include the entire legal notice.
Copyright ©1995-2018 by The Writing Lab & The OWL at Purdue and Purdue University. All rights reserved. This material may not be published, reproduced, broadcast, rewritten, or redistributed without permission. Use of this site constitutes acceptance of our terms and conditions of fair use.
This resource contains a sample MLA paper that adheres to the 2016 updates. To download the MLA sample paper, click this link .
Stack Exchange Network
Stack Exchange network consists of 183 Q&A communities including Stack Overflow , the largest, most trusted online community for developers to learn, share their knowledge, and build their careers.
Q&A for work
Connect and share knowledge within a single location that is structured and easy to search.
Is it bad to start an introduction with a direct quote?
I'm a statistics student at the undergraduate level, writing an undergraduate thesis about genetics. I already have the objectives well defined and I will write the introduction lined with those objectives.
I found a text in a website with authors name and publication date that would be nice to put in my introduction. Is a bad thing start an introduction with a citation?
EDIT: Is a direct quote.
- introduction
- Perhaps this is tangential but monograph (which generally refers to a single-author book) can't be the right word for an undergraduate thesis (at least in AmE). – virmaior Commented Aug 28, 2016 at 13:53
- Do you mean literally the very first words? I had put a long quote from at the end of the first paragraph of my thesis and it was fine I think, but it wasn't the very first words, it was more the eye-catcher on the first page of Introduction. – yo' Commented Aug 28, 2016 at 19:56
- Are you quoting a website, or are you quoting a book which was also cited by this website? If the latter, you most certainly need to follow up and get the book and check that the quote exists, is in fact the exact wording you're using, and that you're comfortable with the work as your initial building block - it says a lot about what you're doing, particularly to people who have read it in full (have you?). – E.P. Commented Aug 28, 2016 at 19:58
- Also, compare the following two narratives: "I found this great quote in some website and I just decided to pop it into my thesis, and as my star starting lines no less", versus "I chased up this quote from some website, which led me to this great book which I read and I thought it was awesome, so I found the bit I liked best and I quoted it in my thesis". Spot the difference? – E.P. Commented Aug 28, 2016 at 20:00
4 Answers 4
While I am not aware of any hard and fast rule against it, I would find it off-putting to read a scientific document that started its prose with a direct quote. There are just so many ways to start with one's own words that it feels lazy and lacking in self-confidence to me to use another's words for the first impression of a reader.
Note, however, that I am speaking of using a quotation as the first piece of one's prose, as distinct from the practice of putting a separated "thematic" quotation at the start of a document of chapter. I see this somewhat more often, and though I find it a bit "cute" in scientific work, I don't have a problem with it the way I would if somebody starts their prose with a quotation.
I generally am not crazy about starting anything with a direct quote unless it absolutely adds value. It's easy when you use this particular trope to just use a quote for the sake of using a quote, and often it comes off as cheesy. In the context of a scientific paper I would probably shy away from doing this, unless you have some sort of reason that you want to "lighten up" your content. Honestly, I really only have found it to be done tastefully with fiction.
It depends a lot on the purpose of the quote. If it is there to replace your own explanations and thoughts, then it is bad. However, a short quote from a respected source that emphasizes the importance or the difficulty of the problem discussed in the thesis can look way more convincing than any of your own blah-blah-blah in this respect, especially if you have something to say about the problem later that other people could not. In general, use your own words when speaking about the nitty-gritty of what you do, but refer to other people opinions, if you can, when you discuss the meta-issues like why it is worth doing, etc. In the first case, excessive quotations create an impression that you are just parroting somebody else's work, and in the second case absence of any appeal to the external opinion may make you look like if you are desperately trying to sell something no one else cares about, especially if you use a lot of standard buzzwords (another thing I would rather abstain from unless they are a part of a direct quote).
The introduction of any document should provide the readers the importance and necessity of this work. If the quote is relevant to the importance you can use it by a presentence of yourself. Overally speaking the direct quote in academics is not generally acceptable with an exception for pioneers of that field. You can use an implication of this qoute and write in your language with a citation to the original document.
You must log in to answer this question.
Not the answer you're looking for browse other questions tagged citations statistics introduction ..
- Featured on Meta
- Preventing unauthorized automated access to the network
- User activation: Learnings and opportunities
- Join Stack Overflow’s CEO and me for the first Stack IRL Community Event in...
Hot Network Questions
- BTD6 Kinetic Chaos (9/26/24 Odyssey)
- If Voyager is still an active NASA spacecraft, does it have a flight director? Is that a part time job?
- Are file attachments in email safe for transferring financial documents?
- \ContinuedFloat with three table not working
- Book where a parent recounts an anecdote about a painting of a Russian sled pursued by wolves
- Randomly color the words
- How can I draw the intersection of a plane with a dome tent?
- Why do evacuations result in so many injuries?
- Why does Lebanon apparently lack aerial defenses?
- What is the name for this BC-BE back-to-back transistor configuration?
- Where is this NPC's voice coming from?
- Can excited state Fukui functions be calculated?
- Can one freely add content to a quotation in square brackets?
- How many natural operations on subsets are there?
- When does derived tensor product commute with arbitrary products?
- Informal "chats" with potential grad school advisors
- In the Silmarillion or the Appendices to ROTK, Do the Dwarves of Khazad-dûm know about the Balrog below prior to Durin receiving the ring?
- Why is my Lenovo ThinkPad running Ubuntu using the e1000e Ethernet driver?
- In a shell script, how do i wait for a volume to be available?
- Is it possible to know where the Sun is just by looking at the Moon?
- Taking out the film from the roll can it still work?
- Can I redeem myself with a better research paper if my thesis sucks?
- Is my TOTP key secure on a free hosting provider server with FTP and .htaccess restrictions?
- How to fix bottom of stainless steel pot that has been separated from its main body?
IMAGES
VIDEO
COMMENTS
Use An Introductory Phrase Naming The Source, Followed By A Comma to Quote A Critic or Researcher. Note that the first letter after the quotation marks should be upper case. According to MLA guidelines, if you change the case of a letter from the original, you must indicate this with brackets. APA format doesn't require brackets.
Table of contents. Step 1: Introduce your topic. Step 2: Describe the background. Step 3: Establish your research problem. Step 4: Specify your objective (s) Step 5: Map out your paper. Research paper introduction examples. Frequently asked questions about the research paper introduction.
5. Hook your reader. Think of a quotation as a "hook" that will get your reader's attention and make her want to read more of your paper. The well-executed quotation is one way to draw your reader in to your essay. [2] 6. Ensure that the quotation contributes to your essay.
Introducing Quotations. These phrases alert your reader that you are about to quote directly from another source. As with the phrases above, some are quite neutral, while others allow you to imply things about the quote's tone, similarity, contrast, and/or significance in relation to other sources or to your larger argument. X states ...
4. Quote important evidence. Quotations can be particularly helpful for an argumentative or study-based research paper, as you can use them to provide direct evidence for an important point you are making. Add oomph to your position by quoting someone who also backs it, with good reason.
Citing a quote in APA Style. To cite a direct quote in APA, you must include the author's last name, the year, and a page number, all separated by commas. If the quote appears on a single page, use "p."; if it spans a page range, use "pp.". An APA in-text citation can be parenthetical or narrative.
After you've done some extra polishing, I suggest a simple test for the introductory section. As an experiment, chop off the first few paragraphs. Let the paper begin on, say, paragraph 2 or even page 2. If you don't lose much, or actually gain in clarity and pace, then you've got a problem. There are two solutions.
Download this page as a PDF: Introducing and Contextualizing Quotations. Return to Writing Studio Handouts. Quotations (as well as paraphrases and summaries) play an essential role in academic writing, from literary analyses to scientific research papers; they are part of a writer's ever-important evidence, or support, for his or her argument.
Finally, for longer quotations, use a block quote. These are also introduced with a colon, but they don't have to follow a full sentence. Furthermore, quoted text should be indented and the block quote should begin on a new line. For example, we could introduce a block quote as follows: Andronicus (1978) describes the fresco in the following ...
By following the steps below, you can learn how to write an introduction for a research paper that helps readers "shake hands" with your topic. In each step, thinking about the answers to key questions can help you reach your readers. 1. Get your readers' attention. To speak to your readers effectively, you need to know who they are.
Step 2: Building a solid foundation with background information. Including background information in your introduction serves two major purposes: It helps to clarify the topic for the reader. It establishes the depth of your research. The approach you take when conveying this information depends on the type of paper.
Quotes, anecdotes, questions, examples, and broad statements—all of them can be used successfully to write an introduction for a research paper. It's instructive to see them in action, in the hands of skilled academic writers. Let's begin with David M. Kennedy's superb history, Freedom from Fear: The American People in Depression and ...
Define your specific research problem and problem statement. Highlight the novelty and contributions of the study. Give an overview of the paper's structure. The research paper introduction can vary in size and structure depending on whether your paper presents the results of original empirical research or is a review paper.
Essay Writing and Introductions. The introduction is the first part of a research paper or an essay in an academic setting. It explains the reason for looking into an issue, its significance, and its goals. With that said, an introduction doesn't cover the study methods or the results of the study. There are separate paper sections to expand on ...
Jostin's research confirmed his earlier hypothesis: mice really are smarter than rats (author's last, year, name p. ##). Stronger Verbs: These verbs indicate that there is some kind of argument, and that the quote shows either support of or disagreement with one side of the argument. Examples of Stronger Verbs The author agrees . . .The ...
Table of contents. Step 1: Hook your reader. Step 2: Give background information. Step 3: Present your thesis statement. Step 4: Map your essay's structure. Step 5: Check and revise. More examples of essay introductions. Other interesting articles. Frequently asked questions about the essay introduction.
1. The placeholder introduction. When you don't have much to say on a given topic, it is easy to create this kind of introduction. Essentially, this kind of weaker introduction contains several sentences that are vague and don't really say much. They exist just to take up the "introduction space" in your paper.
Important guidelines. When integrating a source into your paper, remember to use these three important components: Introductory phrase to the source material: mention the author, date, or any other relevant information when introducing a quote or paraphrase. Source material: a direct quote, paraphrase, or summary with proper citation.
2. Introduce the quote with a descriptive verb. Descriptive verbs are a good way to introduce a quote in the text in a brief and concise way. Use descriptive verbs like "states," "remarks," "notes," "comments," or "maintains.". Always use the last name of the author, followed by the descriptive verb.
Media Files: APA Sample Student Paper , APA Sample Professional Paper This resource is enhanced by Acrobat PDF files. Download the free Acrobat Reader. Note: The APA Publication Manual, 7 th Edition specifies different formatting conventions for student and professional papers (i.e., papers written for credit in a course and papers intended for scholarly publication).
Use the introduction to state your thesis—that is, a short statement of your argument or your perspective. Review of the Literature. In a term or research paper, a large portion of the content is your report on the research you read about your topic (called the literature). You'll need to summarize and discuss how others view the topic, and ...
This material may not be published, reproduced, broadcast, rewritten, or redistributed without permission. Use of this site constitutes acceptance of our terms and conditions of fair use. This resource contains a sample MLA paper that adheres to the 2016 updates. To download the MLA sample paper, click this link.
If the quote is relevant to the importance you can use it by a presentence of yourself. Overally speaking the direct quote in academics is not generally acceptable with an exception for pioneers of that field. You can use an implication of this qoute and write in your language with a citation to the original document. Share. Improve this answer.